Subjective and Objective Safety
The Effect of Road Safety Measures on Subjective Safety among Vulnerable Road Users
Subjective and Objective Safety
The Effect of Road Safety Measures on Subjective Safety among
Vulnerable Road Users
Michael Sørensen Marjan Mosslemi
The Institute of Transport Economics (TØI) holds the exclusive rights to the use of the entire report and its individual sections. Contents of the report may be used for referencing or as a source of information. Quotations or references must be attributed to TØI as the source with specific mention made to the author and report number. Contents must not be altered. For other use, advance permission must be provided by TØI. The report is covered by the terms and conditions specified by the Norwegian Copyright Act.
ISSN 0808-1190
ISBN 978-82-480-0960-3 Paper version
Forfattere:
Michael Sørensen Marjan Mosslemi
Author(s): Michael Sørensen
Marjan Mosslemi TØI rapport: Sider ISBN Papir: ISBN Elektronisk: ISSN ISBN Electronic: TØI report: Pages ISBN Paper: ISSN Dato: Date: 03.2009 03.2009 1009/2009 1009/2009 0808-1190 0808-1190 140 140 978-82-480-0959-7 978-82-480-0959-7 978-82-480-0960-3 978-82-480-0960-3 Finansieringskilde:
Financed by: The Research Council of Norway Norges Forskningsråd
Project: Prosjekt: 3404 - Risikodiskrepans: Sikkerhet og
risikopersepsjon i ulike transportformer 3404 - Risikodiskrepans: Sikkerhet og
risikopersepsjon i ulike transportformer
Fridulv Sagberg Kvalitetsansvarlig: Fridulv Sagberg Quality manager: Aslak Fyhri Prosjektleder: Aslak Fyhri Project manager: Fotgjenger Sikkerhet Syklist trygghet Emneord: Cyclist Pedestrian Perceived risk Safety Key words:
Prosjektets formål har vært å sammenfatte effekten av 54 trafikksikkerhetstiltak og 125 varianter av disse tiltakene på myke trafikanters følelse av trygghet. Vurderingen er basert på litteraturstudier og teoretiske betraktninger. Vi fant kun 14 tiltak som er blitt direkte evaluert, samt 14 tiltak som er blitt indirekte evaluert. 39 av de 54 hovedtiltakene er vurdert å ha en positiv effekt på trygghet. Blant de 125 variantene av tiltakene er det vurdert at 78 har positiv effekt for både sikkerhet og trygghet og 25 har omvendt effekt på sikkerhet henholdsvis trygghet. Det vil si at de har positiv effekt for den ene og negativ for den andre. 20 tiltak har ukjent eller tvetydig effekt på sikkerhet eller trygghet. Ytterligere undersøkelser er relevant for minst 50 varianter av tiltakene. 13 Tiltak er valgt som de mest relevante for ytterligere evaluering.
Sammendrag:
The objective of the project has been to summarize the effect of 54 road safety measures on subjective safety among vulnerable road users. The assessment is based on literature and theoretical considerations. The effect has only been directly studied for 14 measures and indirectly studied for another 14 measures. 39 measures are assessed to have a positive effect of subjective safety. Among 125 submeasures it is assessed that 78 have a positive effect on both objective and subjective safety and 25 have an opposite effect on objective and subjective safety, i.e. having positive effect on one parameter and negative effect on the other. 20 measures have an unknown or unclear effect on objective or subjective safety. Further
investigation is relevant for at least 50 of the submeasures. 13 measures most relevant for further studies are selected.
Summary: English Language of report: Transportøkonomisk Institutt Gaustadalleen 21, 0349 Oslo Telefon 22 57 38 00 - www.toi.no Institute of Transport Economics
Gaustadalleen 21, 0349 Oslo, Norway Telefon 22 57 38 00 - www.toi.no
Preface
This report is part of the RiskDisk project (Risk discrepancy: Safety and risk perception of different means of transport) funded by the Research Council of Norway. The project is a follow up to the RISIT project (Risk and safety in transport) and consists of several parts. The project is planed to finish ultimo 2009. The main objective of the RiskDisk project is to study discrepancies between 1) Objective and subjective risk perception, 2) Emotional and cognitive aspects of risk perception and 3) Perceived risk for accidents (safety) and unpleasant incidents (security).
This report focuses on the first item among the above-mentioned items. The other items are and will be treated in other TØI reports.
The aim of this report has been to collect all available knowledge and studies regarding the effects of various road safety measures on subjective safety, and assess the relationship between road safety measures with confirmed positive effect on road safety and perceived risk for accidents.
The study includes 54 road safety measures that are divided into 125 submeasures. To make an assessment of the effect on subjective safety for these measures, over 200 studies or references have been included in study. For each measure, the literature study has been supplemented with theoretical
consideration about the effect on subjective safety.
Senior Research Psychologist Aslak Fyhri has been project manager. Senior Research Engineer Michael Sørensen has been responsible for this report and has written the greater part of the report and appendix. Research Engineer Marjan Mosslemi has written parts of chapter 2 and parts of the appendix. Chief Research Officer Fridulv Sagberg has been responsible for quality assurance. Secretary Trude Rømming has prepared the text for printing.
Oslo, April 2009
Institute of Transport Economics
Lasse Fridstrøm Marika Kolbenstvedt
Table of contents
Summary Sammendrag
1 Introduction ... 1
1.1 Background and objective ... 1
1.2 Method ... 2
1.3 Delimitation ... 4
1.4 Report structure ... 5
2 Subjective and objective safety ... 6
2.1 Objective safety ... 6
2.2 Subjective safety ... 8
2.3 Correlation between objective and subjective safety ... 10
2.4 Factors influencing subjective safety ... 12
2.5 Summary ... 17
3 Selection of road safety measures ... 18
3.1 Criteria ... 18
3.2 Selection ... 20
3.3 Summary ... 22
4 The effects on objective safety ... 23
4.1 Road Design and Road Furniture ... 23
4.2 Road maintenance ... 25
4.3 Traffic control ... 25
4.4 Vehicle design and protective devices ... 27
4.5 Driver training, education and enforcement ... 27
4.6 Summary ... 28
5 The effects on subjective safety ... 29
5.1 Road Design and Road Furniture ... 29
5.2 Road maintenance ... 34
5.3 Traffic control ... 35
5.4 Vehicle design and protective devices ... 39
5.5 Driver training, education and enforcement ... 42
5.6 Summary ... 44
6 Classification of the measures ... 45
6.1 Different categories ... 45
6.2 Classification ... 46
7 Lack of knowledge ... 54
7.1 Unknown effect on subjective safety ... 54
7.2 Magnitude of effect, exposure and road users ... 56
7.3 Unknown effect on objective safety ... 57
7.4 Classification ... 57
7.5 Recommendation for further research ... 58
7.6 Summary ... 61
8 Conclusion ... 62
8.1 Objective and method ... 62
8.2 Effect on subjective safety ... 62
8.3 Classification ... 63
8.4 Lack of knowledge ... 63
8.5 Further research ... 64
9 References ... 65
1 Appendix. The effects on subjective safety ... 79
1.1 Road Design and Road Furniture ... 80
1.2 Road maintenance ... 102
1.3 Traffic control ... 107
1.4 Vehicle design and protective devices ... 128
Oslo 2009, 140 pages English language Summary:
Subjective and Objective Safety
The Effect of Road Safety Measures on Subjective Safety
among Vulnerable Road Users
A literature study of 54 safety measures that may affect vulnerable road users reveals that the effect on subjective safety has been studied directly for only 14 measures and indirectly for another 14 measures. Supplementary theoretical considerations show that 70-80 % of the measures probably have a positive effect on subjective safety. 78 out of 125 submeasures are assessed to have a positive effect on both objective and subjective safety, while 25 have opposite effects on objective and subjective safety. Further investigation is relevant for at least 50 of the submeasures. One fourth of these measures are ranked as the measures most relevant for further studies.
Objective and subjective safety
Objective safety can be described as the actual number or risk of road accidents or injuries, while subjective safety is the feeling or perception of safety, i.e. how people subjectively experience accident risk in traffic.
The objective of this project have been to collect all available knowledge and studies regarding the effects of various road safety measures on subjective safety, and to assess relationships and discrepancies between the effects on objective and subjective safety for selected road safety measures.
54 road safety measures selected for the study
Among 111 road safety measures described in “The Handbook of Road Safety Measures” 54 measures have been selected for this study. These measures have been divided into 125 varying submeasures. The measures are selected because they are assumed to affect objective safety, subjective safety and/or mobility among cyclists and/or pedestrians.
A comprehensive literature study regarding each of the selected measures was conducted. Over 200 studies or references have been included in this study. However, for many of the measures no evaluation studies have been found. Thus, supplementary theoretical and qualitative considerations about the effect on subjective safety have been performed for each measure.
Positive effect on subjective safety
Table S.1 summarizes the number of measures and submeasures with various effects on subjective safety among vulnerable road users.
Table S.1. Number of measures and submeasures with varying effect on subjective safety among vulnerable road users. Brackets indicate the number of
submeasures.
Category
Number of Measures
Effect
Positive Negative No, unknown, ambiguous
Design and road
furniture 17 (45) 9 (30) 3 (10) 5 (5)
Road maintenance 5 (5) 5 (5) 0 (0) 0 (0)
Traffic control 17 (39) 12 (35) 3 (3) 2 (1)
Vehicle design and
protective devices 8 (25) 6 (23) 0 (0) 2 (2)
Training, education
and enforcement 7 (11) 7 (11) 0 (0) 0 (0)
Total 54 (125) 39 (104) 6 (13) 9 (8)
TØI report 1009/2009
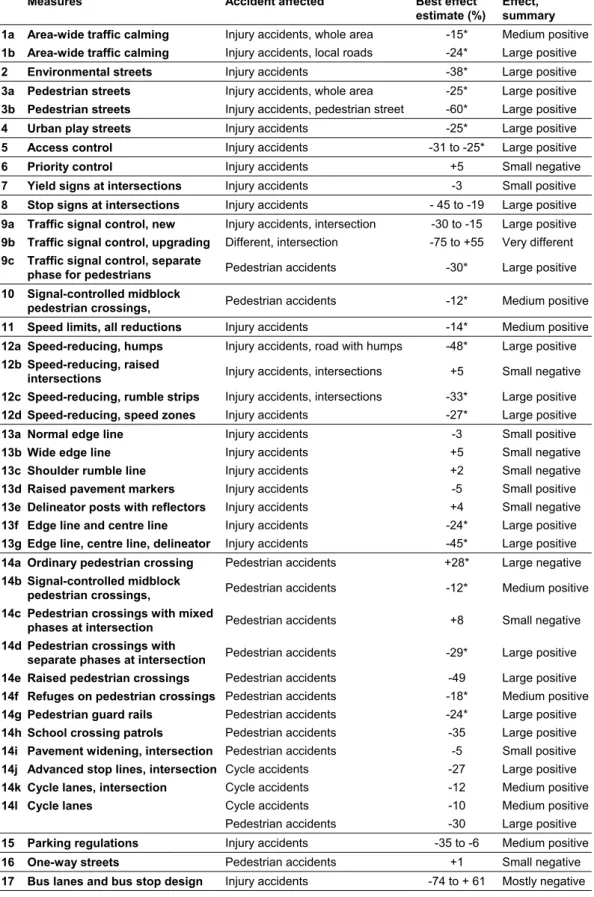
Based on the results from the studies found in literature and the qualitative considerations, it is assessed that 39 measures or 104 submeasures to a larger or smaller extent have positive effects on subjective safety of cyclists, pedestrians or both of them. This corresponds to 70-83 % of the measures. The 39 measures with probably positive effect on subjective safety are listed in table S.2.
Table S.2. Measures with positive effect on subjective safety.
Design and road furniture
− Tracks for walking and
cycling − Motorways − Bypasses − Arterial roads − Channelisation of junctions − Staggered junctions
− Guardrails, crash cushions
− Horizontal curve treatments − Road lighting Road maintenance − Ordinary resurfacing − Improving evenness − Improving friction − Winter maintenance of roads
− Winter maintenance of foot
and cycle tracks
Traffic control
− Traffic calming
− Environmental streets
− Pedestrian streets
− Urban play streets
− Access control
− Traffic signal control
at intersections − Signal-controlled pedestrian crossings − Speed limits − Speed-reducing devices
− Traffic control for
Vulnerable road users
− Parking regulation
− One-way streets
Vehicle design and protective devices
− Reflective materials and
protective clothing
− Cycle helmets
− Regulating automobile engine
capacity and top speed
− Safety equipment on trucks
− Bicycle safety equipment
Safety standards for trailers and caravans
Training, education and enforcement
− Safety standards for
transporting school children
− Education before school
− Education in schools
− Stationary speed enforcement
− Patrolling
− Automatic speed enforcement
− Red light cameras
Only six measures or 13 submeasures are assessed to have negative effects on subjective safety. This corresponds to 9-10 %. The remaining nine measures have none, unknown or ambiguous effect. Measures with negative, none, unknown or ambiguous effect are listed in table S.3.
Table S.3. Measures with no, unknown, ambiguous or negative effect on subjective safety among vulnerable road users.
No, unknown, ambiguous effect Negative effect
− Roundabouts
− Black spot treatment
− Cross section improvements
− Roadside safety treatment
− Rehabilitation, reconstruction and resurfacing
− Priority control
− Road markings
− Regulating vehicle mass
− Under-run guard rails on trucks
− Redesigning junctions
− Interchanges
− Improving road alignment and
sight conditions
− Yield signs at intersections
− Stop signs at intersections
− Bus lanes and bus stop design
TØI report 1009/2009
Positive effect on both objective and subjective safety
The 125 submeasures are classified regarding effect on objective and subjective safety. The classification is summaries in table S.4.Fortunately most of the measures are classified as “good” measures having positive effect on both objective and subjective safety. In total, 78 (62 %) of the 125 submeasures are included in this category.
Table S.4. Total number of submeasures in each of the nine defined groups with varying effect on objective and subjective safety.
Subjective
Objective Positive Negative No, unknown, ambiguous Total
Positive 78 9 6 93
Negative 16 2 1 19
No, unknown, ambiguous 10 2 1 13
Total 104 13 8 125
TØI report 1009/2009
The remaining 47 (38 %) of the measures are “problem” measures. These measures should be used with caution and an assessment of the effect should be made considering the specific case.
20 measures are measures with unknown or unclear effect on objective or subjective safety.
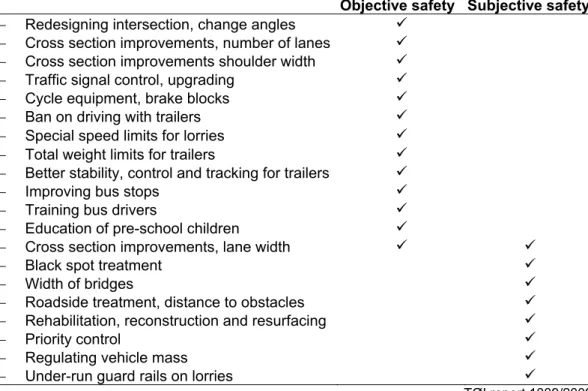
25 measures are measures with opposite effect on objective and subjective safety. Among these 16 measures have positive effect on subjective safety and negative effect on objective safety, while nine measures have positive effect on objective safety and negative effect on subjective safety. Table S.5 lists these 25 measures.
Two measures have negative effect on both objective and subjective safety. These measures should not be used if the aim is improving objective and subjective safety.
Table S.5. Measures with opposite effect on objective and subjective safety.
Positive effect on subjective safety and negative effect on objective safety
Positive effect on objective safety and negative effect on subjective safety
− Tracks for cycling
− T-junctions, full channelisation
− T-junctions, minor road channelisation
− Curve treatments, road widening
− Curve treatments, transition curves
− Ordinary resurfacing of roads
− Improving the evenness of the surface
− Winter maintenance of tracks, more
− Speed-reducing, raised intersections
− Wide edge line
− Shoulder rumble line
− Roundabouts, mixed traffic
− Redesigning, gradient on road
− Redesigning, sight condition
− Interchanges (instead of crossroad)
− Passing lanes (one side)
− Road alignment, general
improvement
− Sight conditions, removing obstacles
− Yield signs at intersections
− Stop signs at intersections
− Delineator posts with reflectors
− Ordinary pedestrian crossing
− Pedestrian crossings, mixed phases, intersection
− One-way streets
− Cycle equipment, spokes reflectors
TØI report 1009/2009
Significant lack of knowledge
This project reveals lack of knowledge among several road safety measures regarding their effect on subjective safety among vulnerable road users. Among the 54 measures, the effect has been studied directly for only 14 measures (26 %) and indirectly for another 14 measures. Table S.6 summarises the number of measures studied for five categories of safety measures.
Table S.6. Number of measures where the effect on subjective safety among vulnerable road users directly or indirectly has been studied.
Category Measures Directly Indirectly No studies
1. Design and road furniture 17 3 1 13
2. Road maintenance 5 2 3 0
3. Traffic control 17 7 4 6
4. Vehicle design and protective devices 8 2 3 3
5. Training, education and enforcement 7 0 3 4
Total 54 14 14 26
TØI report 1009/2009
There is not only a lack of knowledge on the effect on subjective safety, but also on the effect on objective safety. The problem is that the effect on objective safety for cyclists and/or pedestrians has been evaluated for fewer than 20 % of the sub-measures. For the remaining 80 % the general effect for all road users are used.
Thus, it is assumed that the effect among vulnerable road users has the same sign as the effect for all road users. This may not always be the case.
Difficult to estimate the effect
This project reveals 10 varying problems with estimating the effect of road safety measures on subjective safety among vulnerable road users:
1. Few studies: The effect on subjective safety among vulnerable road users has only been studied directly for less than one fourth of the measures included. 2. Amount of studies: For each measure studied it is only possible to find one
or maybe a few studies dealing with the question.
3. Quality of studies: The quality of the studies has not been examined, but some of the studies are based on very few respondents.
4. Over-interpretation: The effect on subjective safety among vulnerable road users has been studied indirectly for about another fourth of the measures included. The result of these studies may have been over-interpreted. 5. Qualitative considerations not verified: Assumptions about various
correlations have not been verified satisfactorily.
6. Difficult to sum up qualitative considerations: It is difficult to assess the effect when factors having an impact on subjective safety have opposite directions. This is the case for several of the measures.
7. Ambiguous or unknown results: Ambiguous or unknown results about the effect on subjective safety for several measures.
8. Magnitude of effect: The magnitude of the effect on subjective safety is often unknown.
9. Number: Number of vulnerable road users in the area is not taken account for in the assessment of effect.
10.Division of vulnerable road users: Vulnerable road users are not divided systematically between cyclists and pedestrians. This may only be possible in the qualitative considerations.
More research needed
Due to the quality and the quantity of the evaluation studies performed further evaluation is both recommended for measures already studied and for measures not studied before.
50 measures are identified for further investigation. However, it is very ambitious to recommend further studies for 50 varying measures. Thus, 13 (one fourth) of the measures have been selected as measures where further studies are most relevant.
The measures selected are those with ambiguous, unknown, significant and/or opposite effect on objective and/or subjective safety among vulnerable road users, those where professionals and/or the public “disagree” about the effects and those dominating the current debate among professionals and in the media.
The 13 measures divided into four groups are:
1. Infrastructure for vulnerable road users: Track for cycling, winter maintenance of tracks and pedestrian crossings
2. Cross sections improvements: lane width and shoulder width 3. Equipment for bicycle and bicyclist: Helmet, brake blocks, spokes
reflectors, and retro-reflective materials
4. Regulations of heavy vehicles: Weight, ban on trailers, speed, and rails. Beside evaluation studies of specific measures some more general studies that quantify the assumed correlation between influencing factors and subjective safety used in the theoretical considerations are also needed.
Oslo 2009, 140 sider Sammendrag:
Trygghet og sikkerhet
Trafikksikkerhetstiltaks effekt på myke trafikanters
trygghetsfølelse
En litteraturstudie av 54 trafikksikkerhetstiltak som kan tenkes å påvirke myke trafikanters trygghetsfølelse viser at effekten kun er blitt direkte evaluert for 14 tiltak og indirekte for 14 andre tiltak. Supplerende teoretiske betraktninger viser at 70-80 % av tiltakene formodentlig har positiv effekt på trygghet. Blant 125 varianter av tiltakene er det vurdert at 78 har positiv effekt for både sikkerhet og trygghetsfølelse. 25 tiltak har omvendt effekt på sikkerhet henholdsvis trygghet. Det vil si at de har positiv effekt på der ene og negativ på der andre. Flere undersøkelser er relevant for minst 50 varianter av tiltakene. En fjerdedel av disse tiltak er rangert som de mest relevante for ytterligere evaluering.
Faktisk sikkerhet og opplevelse av utrygghet
Sikkerhet kan beskrives som det faktiske antall trafikkulykker eller skadde, eller som risiko for ulykker, mens opplevelse av trygghet er følelsen av sikkerhet, eller med andre ord hvordan folk opplever risikoen for trafikkulykker.
Prosjektets formål har vært å samle inn alle tilgjengelige undersøkelser med hensyn til den trygghetsmessige effekten av ulike trafikksikkerhetstiltak, og prøve å undersøke om det er noen sammenheng eller eventuelt diskrepans mellom effekt på sikkerhet og effekt på trygghetsfølelse for utvalgte trafikksikkerhetstiltak.
54 trafikksikkerhetstiltak inngår i undersøkelsen
54 trafikksikkerhetstiltak blant de 111 tiltak beskrevet i ”Trafikksikkerhets-håndboken” er blitt valgt til å inngå i undersøkelsen. Disse tiltakene er igjen blitt oppdelt i 125 ulike varianter. Kun tiltak som formodes å påvirke sikkerhet, trygghet, fremkommelighet eller tilgjengelighet for syklister og/eller fotgjengere er blitt behandlet i studien.
Det er foretatt en omfattende litteraturstudie for hver av de valgte tiltak.
Litteraturstudien omfatter i alt over 200 ulike studier og referanser. For flere av tiltakene er det imidlertid ikke funnet noen evalueringsstudier. Gjennomgangen er derfor for hvert tiltak supplert med teoretiske og kvalitative vurderinger av den trygghetsmessige effekten.
Positiv effekt på opplevd trygghet
I tabell S.1 sammenfattes antall tiltak og undertiltak med ulike effekt på opplevd trygghet for myke trafikanter.
Tabell S.1. Antall tiltak og ulike varianter i parentes med positiv, negativ og ingen, ukjent eller tvetydig effekt på myke trafikanters opplevelse av trygghet fordelt på fem ulike grupper av tiltak.
Kategori Antall tiltak
Effekt
Positiv Negativ Ingen, ukjent, tvetydig
Vegutforming og utstyr 17 (45) 9 (30) 3 (10) 5 (5) Vegvedlikehold 5 (5) 5 (5) 0 (0) 0 (0) Trafikkregulering 17 (39) 12 (35) 3 (3) 2 (1) Kjøretøyteknikk og personlig verneutstyr 8 (25) 6 (23) 0 (0) 2 (2) Føreropplæring, trafikkopplæring, kontroll 7 (11) 7 (11) 0 (0) 0 (0) I alt 54 (125) 39 (104) 6 (13) 9 (8) TØI rapport 1009/2009
Basert på resultater i de undersøkelser som er funnet, og de mer teoretiske betraktninger vurderes det at 39 tiltak eller 104 varianter av tiltak i større eller mindre grad har positiv betydning for trygghet for syklister, fotgjengere eller begge trafikantgrupper. Det svarer til 70-85 % av tiltakene. De 39 tiltak med sannsynligvis positiv effekt for trygghet er listet i tabell S.2.
Tabell S.2. Tiltak med positiv effekt på myke trafikanters opplevelse av trygghet.
Vegutforming og utstyr − Gang og sykkelveger − Motorveger − Omkjøringsveger − Hovedveger og innfartsveger i byer − Kanalisering av kryss − Oppdeling av X-kryss til to
T-kryss − Vegrekkverk og støtputer − Tiltak i horisontalkurver − Vegbelysning Vegvedlikehold − Alminnelig reasfaltering − Bedring av jevnhet − Bedring av friksjon − Vintervedlikehold av veger − Vintervedlikehold av gang og sykkelveger Trafikkregulering − Trafikksanering − Miljøgater − Gågater − Gatetun − Avkjørselsregulering − Signalregulering i kryss − Signalregulering av gangfelt − Fartsgrenser − Fysisk fartsregulering − Regulering for myke
trafikanter − Parkeringsregulering − Envegsregulering Kjøretøyteknikk og personlig verneutstyr − Reflekterende materialer og vernetøy − Sykkelhjelm − Regulering av bilers motorstyrke og toppfart − Sikkerhetsutstyr på tunge biler − Syklers sikkerhetsutstyr − Krav til kjøretøys tilhengere
Føreropplæring,
trafikkopplæring, kontroll − Sikkerhetskrav til skoleskyss − Opplæring av førskolebarn − Opplæring i skolen − Stasjonære fartskontroller − Patruljering − Automatisk fartskontroll − Automatisk rødlyskontroll TØI rapport 1009/2009
Kun seks tiltak eller 13 varianter av tiltak er vurdert å ha negativ effekt på trygghet. Det svarer til 9-10 %. De resterende ni tiltak har ingen, ukjent eller tvetydig effekt. Tiltak med negativ, ingen, ukjent eller tvetydig effekt er listet i tabell S.3.
Tabell S.3. Tiltak med ingen, ukjent, tvetydig eller negativ effekt på myke trafikanters opplevelse av trygghet.
Ingen, ukjent, tvetydig effekt Negativ effekt
− Rundkjøringer
− Utbedring av ulykkesbelastede steder − Utbedring av vegers tverrprofil − Utbedring av vegers sideterreng − Generell utbedring av eksisterende veg − Forkjørsregulering av vegstrekninger − Vegoppmerking
− Regulering av bilers masse
− Underkjørringshinder og sidehinder på lastebiler
− Endret geometrisk utformning
av kryss − Toplanskryss
− Utbedring av vegers linjeføring
og siktforhold − Vikepliktregulering i kryss − Stoppliktregulering i kryss − Kollektivfelt og sikring av stoppesteder TØI rapport 1009/2009
Positiv effekt på både sikkerhet og trygghet
De 125 varianter av tiltak er blitt klassifisert i forhold til sin effekt på sikkerhet og trygghet. Klassifiseringen er sammenfattet i tabell S.4.
De fleste av tiltakene er klassifisert som ”gode” tiltak som har positiv betydning for både sikkerhet og trygghet. I alt er 78 (62 %) av de 125 tiltaksvarianter å finne i denne kategori.
Tabell S. 4. Antall varianter av tiltak i hver av de ni definerte grupper med ulike effekt på sikkerhet og trygghet.
Trygghet
Sikkerhet Positiv Negativ Ingen, ukjent, tvetydig I alt
Positiv 78 9 6 93
Negativ 16 2 1 19
Ingen, ukjent, tvetydig 10 2 1 13
I alt 104 13 8 125
TØI rapport 1009/2009
De resterende 47 (38 %) varianter av tiltak er ”problem-tiltak”. Disse tiltakene skal benyttes med forsiktighet, og hver gang tiltakene brukes bør det foretas en konkret vurdering av effekten på trygghet og sikkerhet.
20 av disse tiltakene er tiltak med ingen, ukjent eller tvetydig effekt på sikkerhet eller trygghet.
25 av tiltakene er tiltak med omvendt effekt på sikkerhet henholdsvis trygghet. Blant disse er det 16 tiltak som har positiv effekt på trygghet og negativ effekt på sikkerhet og ni tiltak som har positiv effekt på sikkerhet og negativ effekt på trygghet. De 25 tiltakene er listet i tabell S.5.
To tiltak har negativ effekt på både sikkerhet og trygghet. Disse tiltak bør ikke brukes hvis målet er å forbedre sikkerhet og/eller trygghet.
Tabell S.5. Varianter av tiltak med omvendt effekt på sikkerhet henholdsvis opplevelse av trygghet.
Positiv effekt på trygghet og negativ effekt på sikkerhet
Positiv effekt på sikkerhet og negativ effekt på trygghet
− Sykkelveger
− T-kryss, full kanalisering
− T-kryss, kanalisering på sideveg − Breddeutvidelse i kurve
− Overgangskurver − Alminnelig reasfaltering − Bedring av vegdekkers jevnhet
− Vintervedlikehold av gang og sykkelveger − Fysisk fartsregulering, opphøyd kryss − Bred kantlinje
− Profilert kantlinje − Kantstolpe med refleks − Vanlig gangfelt
− Gangfelt med blandet fase i signalregulert kryss − Envegsregulering
− Sykkelutstyr, eikerefleks
− Rundkjøringer, blandet trafikk
− Endring av stigningsforhold på
vegarmer inn mot kryss
− Siktforbedrende tiltak i kryss
− Toplanskryss − Forbikjøringsfelt
− Utbedring av vegers linjeføring
− Utbedring av siktforhold
− Vikepliktregulering i kryss
− Stoppliktregulering i kryss
TØI rapport 1009/2009
Betydelig mangel på kunnskap
Dette prosjekt avslører mangel på kunnskap for atskillige trafikksikkerhetstiltak med hensyn til den trygghetsmessige effekt for myke trafikanter. Blant de 54 tiltakene er effekten kun blitt direkte evaluert ved eller etter gjennomføring for 14 tiltak (26 %) og indirekte for andre 14 tiltak. I tabell S.6. er antall tiltak som er blitt evaluert sammenfattet for fem overordnete grupper av tiltak.
Tabell S.6. Antall tiltak der effekten på trygghet for myke trafikanter er blitt undersøkt direkte eller indirekte.
Kategori
Tiltak Direkte Indirekte Ikke
undersøkt
1. Vegutforming og utstyr 17 3 1 13
2. Vegvedlikehold 5 2 3 0
3. Trafikkregulering 17 7 4 6
4. Kjøretøyteknikk og personlig verneutstyr 8 2 3 3
5. Føreropplæring, trafikkopplæring, kontroll 7 0 3 4
I alt 54 14 14 26
TØI rapport 1009/2009
Det er ikke kun mangel på viten i forhold til den trygghetsmessige effekten, men også i forhold til effekten på sikkerhet. Problemet er at den sikkerhetsmessige effekten for syklister og/eller fotgjengere kun er blitt evaluert for under 20 % av de ulike varianter av tiltak. For de resterende tiltak er den generelle effekten for alle trafikanter benyttet i klassifiseringen. Det er således antatt at effekten i
forhold til myke trafikanter har samme fortegn som effekten for alle trafikanter. Det er ikke nødvendigvis alltid tilfellet.
Vanskelig å estimere effekt
I dette prosjektet er det identifisert 10 ulike problemer med å estimere effekten av trafikksikkerhetstiltak på trygghet for myke trafikanter:
1. Få studier: Effekten på trygghet for myke trafikanter er kun direkte blitt undersøkt for under en fjerdedel av de inkluderte tiltak.
2. Antall studier: For hvert av tiltakene som er blitt undersøkt er det gjerne bare en eller to studier som behandler problemstillingen.
3. Kvalitet på studier: Kvaliteten på de inkluderte studier er ikke blitt undersøkt systematisk, men flere av studiene er gjennomført med et lavt antall respondenter.
4. Overfortolkning: Effekten på trygghet for myke trafikanter er indirekte blitt undersøkt for omkring en fjerdedel av tiltakene. Resultatet av disse
undersøkelser kan kanskje være overfortolket.
5. Kvalitative vurderinger er ikke verifisert: Antagelse om sammenheng mellom trygghet og faktorer som påvirker trygghet er ikke blitt verifisert på en tilfredsstillende måte.
6. Vanskelig å summere vurderinger: Det er vanskelig å vurdere den samlede effekt når faktorer som påvirker trygghet har ulik retning. Det er tilfellet for atskillige tiltak.
7. Tvetydige eller ukjente resultater: For flere tiltak er det tvetydige eller ukjente resultater om den trygghetsmessige effekt.
8. Størrelse av effekt: Størrelsen av den trygghetsmessige effekt er ofte ukjent. 9. Mengde: Mengden av syklister og fotgjengere i området er ikke inkludert i
effektvurderingen.
10.Oppdeling av myke trafikanter: Myke trafikanter er ikke oppdelt systematisk mellom syklister og fotgjengere. Det er ofte kun mulig i de kvalitative vurderinger.
Behov for mer forskning
På grunn av manglende kvalitet og kvantitet på gjennomførte evalueringer anbefales det å gjennomføre flere undersøkelser både av tiltak som tidligere er blitt evaluert og tiltak som ikke tidligere er blitt evaluert.
Det er identifisert 50 ulike varianter av tiltak som det bør foretas flere undersøkelser av. De 13 (en fjerdedel) mest relevante tiltak for grundigere undersøkelser er blitt utpekt.
Disse tiltak har tvetydig, ukjent, betydelig og/eller omvendt effekt på sikkerhet og/eller trygghet for syklister og/eller fotgjengere. I tillegg er det tiltak der fagfolk er ”uenige” om effekter eller der ikke fagfolk ikke ”forstår eller aksepterer” de
funne resultater. Endelig er det tiltak som dominerer den nåværende debatt blant fagfolk og i medier.
De 13 tiltak oppdelt i fire grupper er:
1. Infrastruktur for myke trafikanter: Sykkelveger, gangfelt og vintervedlikehold av sykkelveger
2. Vegens tverrprofil: Kjørefeltsbredde og skulderbredde
3. Sikkerhetsutstyr på syklist og sykkel: Sykkelhjelm, brems, reflekser på sykkel, reflekser på syklist
4. Regulering av tung trafikk: Vekt, forbud mod tilhenger, fart, underkjøringshinder.
Ut over evaluering av konkrete tiltak er det også behov for mer generelle undersøkelser som kan verifisere og kvantifisere de antatte sammenhengene mellom trygghet og faktorer som kan tenkes å påvirke trygghet.
1 Introduction
1.1 Background and objective
This report is part of the RiskDisk project (Discrepancies in risk perception), which is a follow up to the RISIT project (Risk and safety in transport) (Forskningsrådet 2008).
The main objective of the RiskDisk project is to study discrepancies between:
− Objective and subjective risk perception
− Emotional and cognitive aspects of risk perception
− Perceived risk for accidents (safety) and unpleasant incidents (security).
This report focuses on the first item among the above-mentioned items. The objective is primarily to study the relationship between road safety measures with confirmed positive effect on road safety and perceived risk for accidents. In other words, the objective is to collect all available knowledge and studies regarding the effects of different road safety measures on subjective safety and make an overall overview of all the measures.
Secondly, the objective is to identify road safety measures where the effect on subjective safety has not been studied, or the conclusions from different studies differ and are not unambiguous, or professionals are disagreeing about the effects. This will be used for selection of road safety measures in further investigations of the RiskDisk project.
There are three reasons why this work is needed:
1. Subjective safety related to different road safety measures: Several studies as part of the RiskDisk and the RISIT projects (Amundsen and Bjørnskau 2003, Grøndahl, Amundsen, Fyhri and Ulleberg 2007, Backer-Grøndahl, Fyhri and Ulleberg 2008, Bjørnskau 2004, Elvik and Bjørnskau 2005) as well as some other projects (Alm and Lindberg 2000, 2002, 2004, Bouyer, Bagdassarian, Chaabanne and Mullet 2001) have studied
subjective safety for different cases and from different aspects:
− For different transport modes as for example plane, train, boat, bus, car,
motorcycle, bicycle and walking
− For different situation as for example day and night
− In different places as for example stations and bus stops
− For people with different characteristic as sex and age.
However, subjective safety related to different road design, road operation and maintenance and for different road (safety) measures have been
studied to a lesser extent and summarized in a macro level. It has only been carried out in the micro level regarding the evaluation of concrete measures and projects. A literature search by Sælensminde (2002)
illustrates how few studies have been carried out in this respect. A search using the words “insecur?” and “bicycle?” in three bibliographical databases; “ISI Web of Science”, “PsycINFO” and “MEDLINE” gave only two hits. A similar literature search by Elvik (2000) in the database www.transportconnect.net gave only one hit. Amundsen and Bjørnskau (2003) therefore recommend more research on how people react to different road measures to increase objective and partly subjective safety. 2. Effect catalogue: Effect catalogue or handbooks with summary and
overview of the effect of road safety measures on objective safety (Elvik and Vaa 2004, Elvik, Erke and Vaa 2008), and the effect of different measures on the environment regarding noise, energy consumption, climate, pollution, barrier, land use and aesthetics (Amundsen and Kolbenstvedt 2008) exist. However, no comprehensive and complete effect catalogue for road traffic measures on subjective safety has been made.
3. Traffic planning: Traffic planning is very complex and it is getting ever more complex as a result of increasing traffic and the progressive focus on its negative effects. The objective of traffic planning is to make the
infrastructure as effective as possible by maximising the positive effects
such as high mobility andaccessibility and minimising the negative effects
such as road accidents, insecurity, noise, energy consumption, climate change, pollution, barrier, land use and aesthetics as well as the traffic-related problems such as traffic queue and lack of parking. To make a systematic assessment and selection of the routing of roads, road design and road measures, it is necessary to know the nature and size of the effects including the effects on subjective safety.
1.2 Method
In order to fulfil the project’s objective, four different methods are employed through the project as following:
1. Selection of road safety measures
2. Literature study of existing studies and evaluations
3. Theoretical and qualitative considerations
4. Classification of road safety measures.
The purpose of the first part of the project is to select relevant road safety measures for this study. Some criteria for selection are outlined, and all the road safety measures described in “The Handbook of Road Safety Measures” (Elvik and Vaa 2004, Elvik, Erke and Vaa 2008) which fulfil these criteria are chosen. The criteria for selection of road safety measures and the actual selection are described in chapter 3.
Afterwards, a comprehensive literature study regarding each of the selected measures is conducted. The purpose of the literature study is to collect the available knowledge and studies concerning the effects of each measure on subjective safety so that it becomes possible to make an overall estimate of each measure.
The studies have been gathered by means of a systematic literature search consisting of a fixed part and a variable part. The fixed part is a comprehensive search for studies in a sample of sources. The fixed part of the search was conducted for the following samples:
− The bibliographical databases Science Direct, ISI web of Science, Worldcat
and Silverplatter, Transport
− www.google.com
− The library of the Institute of Transport Economics
− Scandinavian journals
− Proceedings from selected conferences
− Reports issued by selected research institutes.
The literature search was conducted using the name for the actual measure and a variation of the following key words:
− Subjective safety − Perceived safety − Anxiety − Insecurity − Public perception/opinion − Community attitudes.
The variable part of the literature search comprises references found in the reference lists in the studies which were retrieved in the fixed part of the search. For many of the selected road safety measures, none of the available studies have investigated their effects on the subjective safety of vulnerable road users. Thus, theoretical and qualitative considerations about factors having impact on
subjective safety are made in this report for each measure to assess if the measures have positive or negative effects, as well as whether the effects are large, medium or small. The focus in this project is primarily on these assessments.
The last part of the project is a classification of the selected measures based on their effects on objective and subjective safety. The lack of knowledge concerning the subjective safety effects of some measures is also considered and included in this classification.
1.3 Delimitation
The delimitation of the project emerges indirectly from the described objective and methods. However, this is clarified in the following.
− Road traffic: The project focuses only on road traffic and not plane, train or boat traffic.
− Vulnerable road users: The project focuses only on subjective safety among vulnerable road users, i.e. cyclists and pedestrians. The reason for this is firstly due to the fact that the percentage of road users feeling unsafe is highest among cyclists and pedestrians. It is only motorcyclists that feel more unsafe (Amundsen and Bjørnskau 2003, Bjørnskau 2004). Secondly the discrepancies between objective and subjective safety are especially interesting among vulnerable road users because they have the most discrepancies (Elvik and Bjørnskau 2005).
− Road safety: The feeling of subjective unsafety and insecurity is influenced by the possible outcome of a road accident as well as fear for terror and incidents like mugging, harassment or other unpleasant experiences. A study by Backer-Grøndahl, Amundsen, Fyhri and Ulleberg (2007) shows for example that road users worry more about accidents than incidents on private transport modes including bicycles, and more about unpleasant incidents than accidents on public transport modes and as pedestrians. Subjective unsafety in this project primarily refers to the perceived risk and fear of road accidents.
- Subjectivity: It is difficult to calculate the subjective safety numerically. In this project it is not tried to make or suggest a method for calculating numerical values for the subjective safety effects. Instead, the effect on subjective safety will be described in terms of positive effect, negative effect, large effect, middle effect, little effect, no effect or unknown effect.
- Variation: Subjective safety for different transport modes and situations varies from person to person and may even change for one person over time. The subjective safety for a person is influenced by knowledge, experience, life situation and technological development (Drottz-Sjøberg 1991). In this project it is only tried to identify a kind of average effect on subjective safety.
- North Europe: The description of the effects on objective and subjective safety in this study is primarily based on the situation in North Europe, but all the available evaluations from the western world are included in the literature study.
- Road safety measures: The included road safety measures are not described thoroughly. To get a thorough description of each measure, we refer to Elvik and Vaa (2004).
- First version: This is the first attempt to make a catalogue regarding the effects of road safety measures on subjective safety. Thus, it should not be considered as a complete work at this stage. It is recommended to
1.4 Report structure
This report is divided into eight chapters and one appendix.
The next chapter is a clarification of the objective and subjective safety concepts and the correlation between them. Objective and subjective safety for cyclists and pedestrians are also described in this chapter.
Selecting the relevant road safety measures are accomplished in chapter 3. Chapter 4 and 5 summarise the effects on objective and subjective safety for the selected measures.
Based on the results from chapter 4 and 5, the selected measures are classified in different categories in chapter 6.
Gaps of knowledge are clarified in chapter 7, and chapter 8 is the conclusion. The appendix consists of a comprehensive clarification of the effects on subjective safety among vulnerable road users for each of the 54 selected road safety measures. Thus, if the reader wants to read more about specific road measures we refer to the appendix. The appendix also includes a lot of references to relevant studies about each measure.
2 Subjective and objective safety
This chapter describes objective and subjective safety concepts regarding cyclists and pedestrians. Correlation between objective and subjective safety is also described in this chapter. Finally, factors influencing subjective safety are described.
2.1 Objective safety
2.1.1 Definition
Objective or statistic road safety is a measure for road safety which is based on the recorded numbers of road accidents and injuries. Objective safety can be described as the actual numbers, but it can also be described as risk. Risk is normally understood as the probability of road accident or injury per unit of road traffic exposure. Road traffic risk is normally calculated as the number of
accidents or injuries per distance travelled. Risk figures are useful in order to compare how different groups are at risk in road traffic. Thus, it is also useful in order to select road safety measures which may be most efficient (Bjørnskau 2008).
2.1.2 Cyclists
Every year about 730 cyclists are injured and 7-8 killed in Norway according to the official statistics for road accidents. However, the real numbers are much higher as many of the accidents, especially single accidents, are not recorded by the police. Table 2.1 summarizes the police recorded number of killed and injured cyclists in Norway in 2005-2007.
Table 2.1. Killed and injured cyclists in Norway (Statistisk sentralbyrå 2008).
2005 2006 2007
Fatalities 7 8 7
Critically injured cyclists 1 4 4
Seriously injured cyclists 52 64 56
Slightly injured cyclists 675 596 607
Unknown injury 8 67 67
Total 743 739 741
Table 2.2 summarizes the risk for cyclists in Norway calculated as killed and injured cyclists per million person kilometre. In 2005, 0.82 cyclists were killed or injured per million person kilometres. 0.011 cyclists were killed per million person kilometres.
In the last 20 years the risk for cyclists has decreased from 1.43 to 0.82 killed or injured per million person kilometres.
Compared to other groups of road users, the risk for cyclists is the third highest. It is only riders of mopeds and light motorcycles that have a higher risk. Compared to car drivers and passengers, cyclists have 5-6 times higher risk. On average, the injury rate for cyclists in the six countries of Norway, Denmark, Sweden,
Germany, The Netherlands and Great Britain is about 9 times higher than the injury rate for car drivers based on studies from 1990 to 2002 (Elvik and Vaa 2004).
The calculation of risk is based on the police recorded road accidents, so the real risk is much higher. At the same time, the number for exposure is uncertain (Bjørnskau 2008).
Table 2.2. Killed and injured road users in Norway per million person kilometres in 1985, 1992, 1998, 2001 and 2005 divided on different groups of road users (Bjørnskau 2008). 1985 1992 1998 2001 2005 Car drivers 0.19 0.19 0.19 0.18 0.15 Car passengers 0.19 0.17 0.16 0.14 0.13 Pedestrians 0.64 0.79 0.68 0.63 0.47 Cyclists 1.43 1.22 1.23 1.08 0.82 Moped riders 2.12 1.45 1.22 1.31 1.29
Light motorcycle riders 4.23 1.56 1.48 1.38 1.27
Heavy motorcycle riders 4.20 1.69 1.33 0.91 0.61 2.1.3 Pedestrians
Table 2.3 summarizes the number of killed and injured pedestrians in Norway in 2005, 2006 and 2007. The number of annual killed pedestrians varies between 23 and 35 and the annual numbers of injured pedestrians recorded by the police varies between 790 and 870.
Table 2.2 shows the number of killed and injured pedestrians per million person kilometres. In 2005 0.47 pedestrians were killed or injured per million person kilometres. At the same time, 0.017 pedestrians were killed per million person kilometres. In the last 20 year the risk for pedestrians has varied between 0.79 killed or injured per million person kilometres in 1992 and 0.47 in 2005. Compared to other groups of road users, the risk for pedestrians is the third lowest. It is almost half the risk for cyclist. Compared to car drivers and passengers, pedestrians 3-4 times higher risk. In Norway, Denmark, Sweden, Germany, the Netherlands and Great Britain the injury rate for pedestrians is in average about seven times as high as the injury rate for car drivers (Elvik and Vaa 2004).
Table 2.3. Killed and injured pedestrians in Norway (Statistisk sentralbyrå 2008).
2005 2006 2007
Fatalities 32 35 23
Critically injured pedestrians 9 10 9
Seriously injured pedestrians 93 114 75
Slightly injured pedestrians 738 676 632
Unknown injury 11 67 75
2.2 Subjective safety
2.2.1 Definition
Subjective safety is also termed as perceived safety, insecurity or anxiety. In this project the subjective safety term is used. There are several definitions and descriptions regarding subjective safety. Six examples are as following:
− Feeling of safety, i.e. how people subjectively experience accident risk in
traffic. How much do people believe that the risk of accident exists, and how uncomfortable they feel about it? The answer to this combined question is an expression for subjective safety. In other words, subjective safety has two dimensions: How dangerous do people perceive traffic and how unpleasant is this belief (Elvik, Erke and Vaa 2008).
− Insecurity in traffic is a feeling of discomfort that occurs when a person
feels overruled or looses control in a traffic situation. This is related to the feeling of traffic safety and accident risk in a specific situation and/or location. Insecurity can also occur when walking along a road or crossing it, but also on footpaths with separate paths (Nielsen, Thesberg, Jensen and Sørensen 2007).
− Perceived risk in transport depends mainly on: a) the potential of
catastrophe, b) the likelihood of being killed in an accident c) the degree to which we individually control the activity and possible outcome (Amundsen and Bjørnskau 2003).
− The concept consists of two parts; an emotional component which among
other factors include insecurity, fear, anxiety and worry, and a cognitive component which represents the perceived risk of an accident or injury (Sjöberg 1993).
− Subjective safety is the sum of two thoughts; the possibility for an accident
and the consequence of a possible accident (Værø 1992).
− Subjective safety is also the feeling of unsafety for other people. For
example parents worry for their children when they walk and play nearby traffic (Køltzow 1986, Elvik, Kolbenstvedt and Strangeby 1999).
2.2.2 Cyclists
Subjective safety of different road users including vulnerable road users has been studied in some projects. Results from two projects are summarized in the
following.
In the first study by Bjørnskau (2004), 1,000 Norwegians were asked how safe they think it is to travel by eight different modes of transport. The results are summarized in table 2.4.
3 % think that it is very unsafe to cycle and 25.1 % think it is a little unsafe. This is the second highest percentage of unsafety. Only the percentage of unsafety for motorcycling is higher.
In the other study by Backer-Grøndahl, Amundsen, Fyhri and Ulleberg (2007) respondents were asked how much on a scale from one to five they worry about accidents and/or unpleasant incidents for nine different means of transport. The
number of people which were interviewed was between 568 and 833 for each mode of transport.
Respondents reported to worry most about accidents when travelling with motorcycle, followed by car and bicycle. 7 % find cycling very unsafe (rank 5) and 12 % find cycling a little unsafe (rank 4).
Regarding unpleasant incidents, cycling gets the third lowest level. Only 5 % of the respondents associated cycling with unpleasant incidents.
Table 2.4. Results of a sample survey in Norway concerning how safe various modes of transport are perceived to be. Percentage distribution of answers (Bjørnskau 2004, Elvik and Bjørnskau 2005).
Very safe Safe A little unsafe Very unsafe Do not know Total
Air 57.4 37.3 3.1 1.3 1.1 100 Train 55.2 39.9 2.7 0.2 1.6 100 Boat 44.6 48.8 4.6 0.3 1.7 100 Bus 49.4 48.4 1.4 0.1 0.7 100 Car 21.3 68.0 9.4 0.8 0.5 100 Motorcycle 2.5 24.8 53.3 14.8 4.6 100 Bicycle 18.2 50.7 25.1 3.0 3.0 100 Walking 22.4 57.8 15.7 2.3 1.8 100
Table 2.5. Worry about accidents and unpleasant incidents on different means of transport. Means on a scale from one to five (Backer-Grøndahl, Amundsen, Fyhri and Ulleberg 2007, Backer-Grøndahl, Fyhri and Ulleberg 2008).
Transport mode Accidents Unpleasant incidents
Bus 1.94 1.80 Train 1.56 1.65 Metro 1.81 2.38 Tram 1.68 2.10 Taxi 2.36 1.91 Car 2.58 1.29 Motorcycle 3.85 1.54 Bicycle 2.55 1.59 Pedestrian 1.88 2.14 2.2.3 Pedestrians
Table 2.4 and table 2.5 describe subjective safety for pedestrians. According to Bjørnskau (2004), 2.3 % of the respondents think that it is very unsafe to walk and 15.7 % think it is a little unsafe. This means that walking is perceived a little more safe than cycling.
According to Backer-Grøndahl, Amundsen, Fyhri and Ulleberg (2007), people do not worry much about accidents when walking. Only 7 % find walking very unsafe or a little unsafe. On the contrary, walking gets a high score regarding unpleasant incidents. It is only travelling by metro which gets a higher score. 12 % of the respondents associate walking with unpleasant incidents.
2.3 Correlation between objective and subjective safety
The nature of correlation between objective and subjective safety depends on parameters being analysed. The nature of correlations varies for:
− Area
− Locations
− Means of transport
− Road safety measures.
An analysis of correlation between car drivers’ objective risk and reported feeling of risk in 19 Norwegian counties has been made. No correlation was found. However, the result should be taken with caution due to difficulties with measuring of subjective safety and because the calculation of correlation was done on aggregate level rather than individual level (Elvik 1997, Vaa 1991a). Figure 2.1 shows an example on correlations between number of times a location has been mentioned as dangerous and number of recorded accidents at the
location. The figure shows only a very weak correlation. This means that the locations people find dangerous are not necessary those which most road
accidents happen (Elvik, Erke and Vaa 2008). Maybe there is a larger correlation between risk where traffic volume is included and subjective safety, but this has not been investigated.
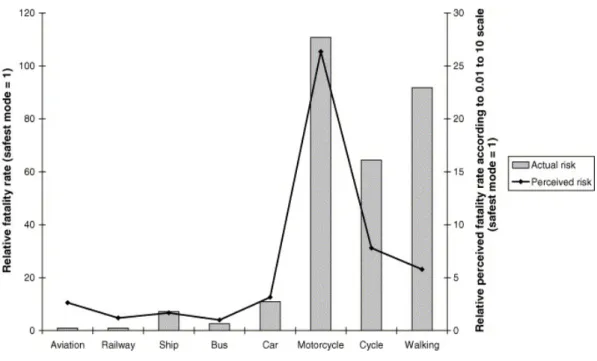
Figure 2.1. Correlation between number of times a location has been mentioned as dangerous and number of recorded accidents at the location (Hvoslef 1980). Figure 2.2 shows an example on correlations between actual and perceived fatality risk for various modes of transport in Norway. The figure shows that the differences in fatality rate between different modes of transport are quite well perceived by the Norwegian public (Elvik and Bjørnskau 2005).
Figure 2.2. Relationship between actual and perceived fatality risk for various modes of transport in Norway (Elvik and Bjørnskau 2005).
Regarding road safety measures the correlation between the effect on objective and subjective safety will probably vary a lot. Some measures have positive effect on both objective and subjective safety, some have positive effect on objective safety and negative effect on subjective safety, and others have negative effect on objective safety while positive effect on subjective safety.
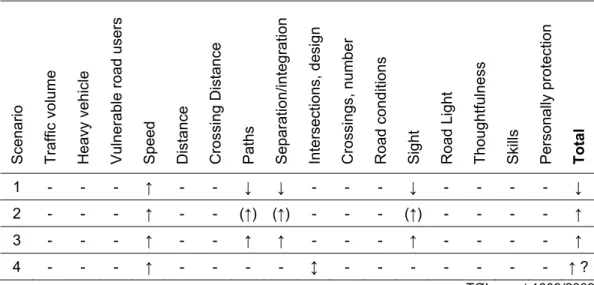
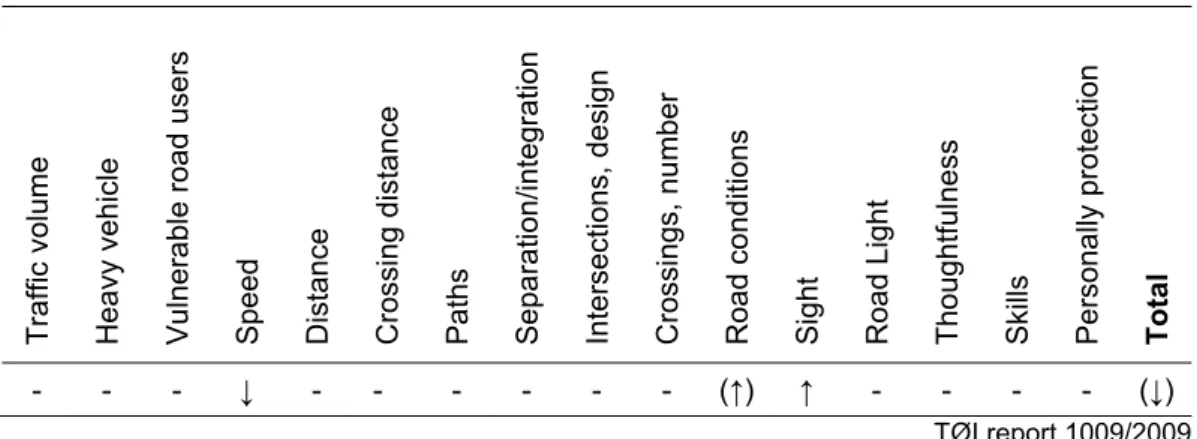
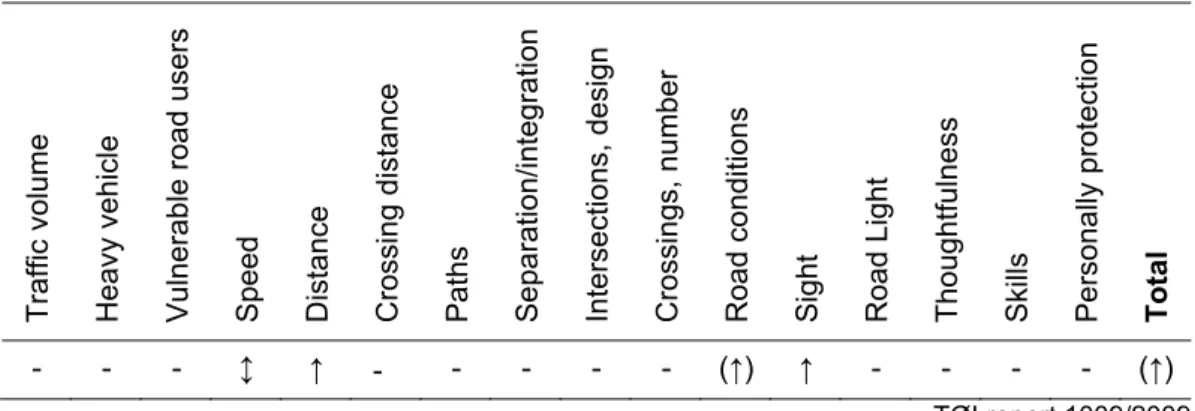
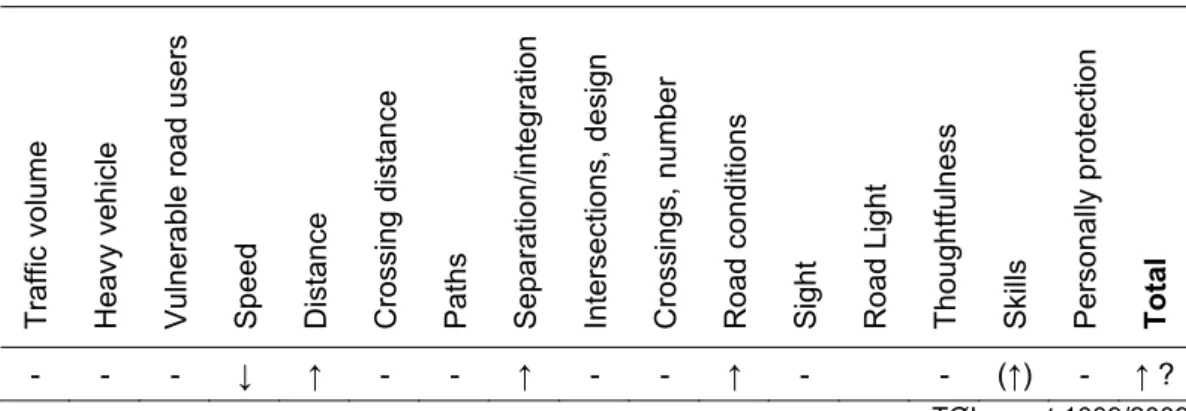
Figure 2.3. Potential relationship between effects on safety (objective safety) defined as the actual number of accidents and effects on security (subjective safety) defined as feeling of safety for four safety measures (Elvik 2000). The possible different effect on objective and subjective safety is illustrated in figure 2.3 for four different measures. It is seen that the use of seat belts is assumed to improve both safety and security. Higher speed is assumed to reduce
both safety and security. The other two cases present a conflict. An ordinary marked pedestrian crossing makes pedestrians feel safer but actually increases the number of accidents. The opposite is the case for roundabouts. It seems likely that roundabouts make drivers feel a little more insecure at the same time that the effect on objective safety is positive (Elvik 2002).
2.4 Factors influencing subjective safety
For many of the selected road safety measures, none of the available literature has studied their effects on the subjective safety of vulnerable road users. To
overcome this problem it is tried to make a more “theoretical consideration” about the possible effects. For this purpose, all factors having impacts on subjective safety of vulnerable road users are identified and listed here.
According to Amundsen and Bjørnskau (2003) only few projects have studied how the percentage of road users feeling unsafe or the degree of subjective safety is influenced by different factors. However, among the few available studies it seems that traffic volume is an important factor regarding subjective safety. The more the traffic, the higher percentage states that they feel unsafe. Lower speed is also mentioned frequently when people are asked about what can be done to increase their sense of safety in traffic.
Slippery and icy road conditions also increase the percentage of road users feeling unsafe. Finally, car drivers feel safer if they consider themselves as good drivers (Amundsen and Bjørnskau 2003).
According to a study by Backer-Grøndahl, Amundsen, Fyhri and Ulleberg (2007), carelessness of other road users as well as bad road conditions are factors which respectively contribute most to the feeling of unsafety among bicyclists. Dense traffic also contributes to the sense of unsafety. When it is dark, bad road lighting increases the percentage of both bicyclists and pedestrians feeling unsafe. Note that this feel of unsafety regards both road accidents and other unpleasant experiences.
Elvik and Sælensminde (2000) describes that subjective safety among vulnerable road users primarily is determined by traffic volume, speed and the number of road accidents.
A study by Kolbenstvedt (1986) showed that people living in areas where
pedestrians and cars are separate feel less unsafe than people living in areas where pedestrians and cars are integrated.
According to Sælensminde (2002), subjective safety of cyclists and pedestrians is to a great extent dependent on whether they have their own tracks for cycling and walking, or they should share paths with motorized traffic. However, tracks for cycling and walking do not completely eliminate the sense of unsafety because of the crossings between tracks and roads. Different designs of the crossings are also associated with different levels of perceived unsafety. Additionally, parameters such as width, sight and maintenance of the tracks including holes and cracks, sand and gravel in the road surface, and winter maintenance do also influence the feel of safety. Comfort is also influenced by these parameters.
A study regarding attitudes for substitution of car trips with walking and cycling concludes that one of the barriers towards this purpose is the feeling of unsafety. The most central source to feeling unsafe is small distance between vulnerable road users along the road and a large traffic volume (Lodden 2002, Stangeby 1997). Thus, the most important infrastructural and political measures to improve the conditions for vulnerable road users including promotion of subjective safety are shown in following (Stangeby 1997):
Infrastructural measures:
− More footpaths and cycling lanes
− Wider pavement
− Improved pedestrian subways
and crossings
− Smoother road surface.
Political measures:
− Prohibit cycling on pavements
− City centres free of cars
− Priority for walkers at crossings
− Different measures to reduce car
traffic.
In Denmark a formula for calculation of subjective safety of people cycling or working in or along a road have also been developed. The formula is
(Miljøministeriet 1992, Lahrmann and Leleur 1994, Værø 1992): F) (C 0.63) La (1.87 50 V ÅDT 0.1 0.5 S 3 + ⋅ + ⋅ ⋅ ⎟ ⎠ ⎞ ⎜ ⎝ ⎛ ⋅ ⋅ ⋅ = , where
S: Subjective safety. The factor 0.5 indicates that the calculation is done
for each road side. The total number for subjective safety is calculated as the sum of the calculation for each side. Depending on the number subjective safety classifies as insignificant, small, medium or large
ÅDT: Traffic volume
V: Speed
La: Percentage of heavy vehicles
C: Factor for existence of cycle path or cycle lane. The factor varies
between 0.1 for no cycling path to 0.5 for cycling path at the same side
F: Factor for existence of foot path. The factor varies between 0.1 for no
walking path to 0.5 for walking path at the same side.
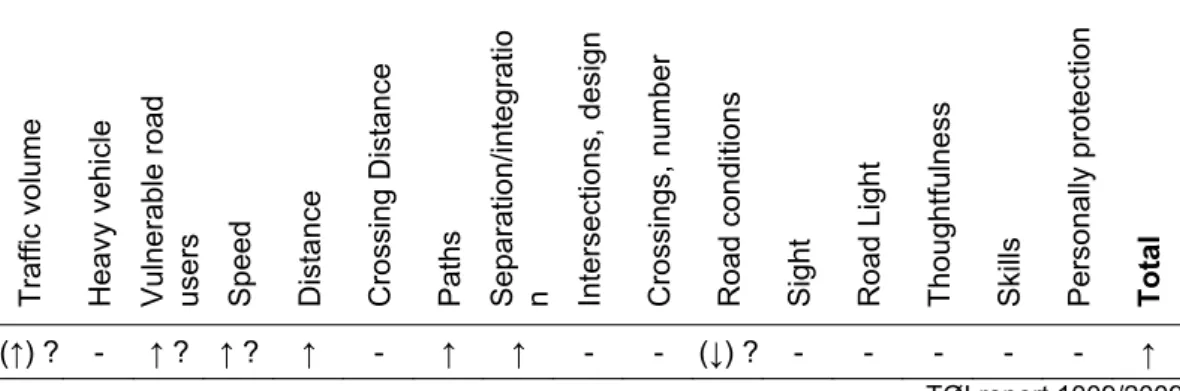
According to this formula, traffic volume, speed, heavy vehicles and the existence of cycle and foot path have impact on subjective safety of vulnerable road users. In addition, Miljøministeriet (1992) describes that distance between motor
vehicles and vulnerable road users influence the feeling of safety. This means that subjective safety, for example, can be improved by making the cycle or foot paths wider or having a verge and parking area between them and the road. Værø
(1992) also mentions that besides traffic volume,thoughtfulness of drivers has the
most influence on the subjective safety.
Vejdirektoratet (2009) has made a model regarding how to prioritise cycle tracks outside cities. The model is based on a point system where different road design parameters are assigned with different points. Subjective safety is included in the model as one of the seven parameters.
Table 2.6 explains how points for subjective safety are estimated. The calculation is based on information about traffic volume, volume of heavy vehicle, lane width, speed limit, shoulder width and number of crossings. It is explained that different parameters have different importance. The most important parameters in prioritised order is: 1) lane width, 2) volume of heavy vehicles, 3) speed limit, 5) shoulder width and 6) number of crossings. It is not indicated how important traffic volume is.
Table 2.6. Assignment of the points for subjective safety in the Danish model to prioritise cycle tracks outside cities. Each column is given a point, and the total points for subjective safety is the sum of the points in the six columns
(Vejdirektoratet 2009).For example a road with traffic volume = 3000, heavy vehicle = 500, lane width = 10, speed limit = 50, shoulder width = 1.5 and crossing = 3 gets 0.8+1.2+0.8+1.6+0.8+0.4 = 5.6 points. These points are summarises with points for other parameters. Cycle tracks are planned for roads with most points.
Traffic volume
(AADT) Heavy vehicle (AADT) Lane width(m) Speed limit (km/t) width (m)Shoulder Crossings pr. km Point
0 - 2000 0 - 200 > 2 0 - 4 0.4
2001 - 4000 201 - 400 > 9.0 < 50 1.6 - 2 5 - 8 0.8
4001 - 6000 401 - 600 1.1 - 1.5 9 - 12 1.2
6001 - 8000 601 - 800 8.51 - 9.0 50 0.6 - 1.0 13 - 16 1.6 Fyhri (2002, 2005) has made two studies about children’s journey to school in 2002 and 2005 respectively among 6,900 and 7,500 primary school pupils aged 6, 8 and 12 years. The pupils were chosen from representative sample of schools in Norway. The results show that the pupils considered the following factors as “unsafe” in traffic:
1. Difficult road to cross (stated by 31 % in 2002 and 29 % in 2005)
2. No footpaths or bicycle lane (stated by 24 % in 2002 and 23 % in 2005)
3. High speed (stated by 19 % in both 2002 and 2005)
4. High traffic volume (stated by 17 % in both 2002 and 2005)
5. Too narrow road (stated by 11 % in 2002 and 12 % in 2005)
6. Other reasons (stated by 9 % in 2002 and 8 % in 2005)
Similarly, Fyhri and Hjorthol (2006) studied the factors which are considered by parents as “unsafety” for children on their way to school. 734 parents answered the questionnaire. The most unsafe factors expressed by the parents were respectively as following:
1. High traffic volume and high speed along the road (stated by 63 %)
2. No bicycle lane (stated by 52 %)
3. No footpath (stated by 48 %)
4. No pedestrian crossing (stated by 43 %)
5. Bad winter maintenance (stated by 35 %)
6. High traffic volume and high speed at intersections (stated by 31 %)
7. No signal-controlled pedestrian crossings (stated by 29 %)
8. Lack of light on the road (stated by 29 %)
9. No tunnel or bridge for vulnerable road users (stated by 16 %)
10.Cycle and moped traffic with high speed (stated by 13 %)
11.Other factors (stated by 17 %).
Nielsen, Thesberg, Jensen and Sørensen (2007) have analyzed existing school route surveys carried out in Denmark from 2002 to 2007 in nine of the 13 old municipalities. It comprised 152 schools, and 31,513 children were interviewed. Among almost 32,000 children the following factors were pointed out as unsafe:
1. Many cars (stated by 21 %)
2. High speed (stated by 19 %)
3. Difficult to cross road (stated by 13 %)
4. Cars do not stop (stated by 12 %)
5. Bad sight conditions (stated by 8 %)
6. No footpaths or bicycle lane (stated by 7 %)
7. No light on paths (stated by 4 %)
8. Dangerous junction (stated by 1 %)
9. Many lorries (stated by 1 %).
Regarding the geometry of crossings, 3-leg junctions were stated as “unsafe” by 44%, 4-leg junctions were mentioned as “unsafe” by 15 %, and junctions between roads and paths were pointed out as “unsafe” by 13 % of the children (Nielsen, Thesberg, Jensen and Sørensen 2007).
Another study (Landis 2003) sought to mathematically express intersections’ geometry as well as operational and traffic characteristics which affect bicyclists’
perception of quality of service. A special event was created to place a significant
number of bicyclists on a roadway course which would take them through various intersection configurations. The purpose was to obtain the cyclists’ real-time responses to the roadway environment stimuli and to create and test a mathematical relationship between measurable factors and the participants’ reactions. The study reveals that roadway traffic volume, total width of the outside through lane, and intersection’s crossing distance are the primary factors affecting the cyclists’ perception of safety and comfort through movements at intersections.