Carpathian Journal of Earth and Environmental Sciences, October 2010, Vol. 5, No. 2, p. 61-70
INVESTIGATING THE LINK BETWEEN SOIL QUALITY AND
AGRICULTURAL LAND USE CHANGE. A CASE STUDY IN THE LAKE
BALATON CATCHMENT, HUNGARY
Peter SZILASSI
1, Gyozo JORDAN
2, Ferenc KOVACS
1, Anton Van ROMPAEY
3& Wim Van
DESSEL
31
University of Szeged Department of Physical Geography and Geoinformatics, 6722 Egyetem 2, Szeged, Hungary e-mail: toto@jgypk.u-szeged.hu
Geological Institute of Hungary,114, Stefánia 14, Budapest, Hungary KU Leuven, 3001 HaverleeCelestijnenlaan 200E, Leuven Belgium
Abstract: The social, political and economical driving forces behind land use change in Central and Eastern European countries, such as land privatisation and EU-membership are well documented. However, there are few studies that examine the possible role of environmental characteristics such as soil quality in land use change, and most of these studies keep a marginal importance of the environmental factors on the land use change. The objective of this study is to investigate the regional scale relationship between soil quality and land use change before (1981-1990), during (1990-2000), and after (2000-2006) the land privatisation in Hungary. The Lake Balaton catchment was selected as a study area for such analysis because of its rapidly changing historic landscapes which are well-documented in terms of data availability. Historic land use data were obtained from military topographic maps (1981), CORINE land cover maps (1990, 2000) and satellite images (2006) at 1:100,000 scale. The National Soil Quality Evaluation System (NSES) is used for representing soil quality by ‘soil quality scores’ that lump various soil parameters such as organic matter content, soil texture and erosion level, derived from regional soil mapping. GIS methods were used to analyse, verify and evaluate soil quality and it is connection with the agricultural land use change. Results of this study show that soil quality has a relevant role in shaping rural landscape patterns in Hungary. It is demonstrated that the soil quality acts as a location factor in the case of arable land use change between 1981-1990. In this period, arable lands have been moved to areas where the best soils were found. Models that are used to predict future land use changes should therefore take into account the change patterns (arable land migration) described in this paper. Results also show that spatial land use change can be linked to the pattern of the complex NSES soil quality scoring systems.
Keywords: land use change, land use management, land privatisation, soil quality, soil evaluation system, rural landscape
1 INTRODUCTION
The social, political and economical background of land use change in Central and Eastern European countries, such as the transition to market economy, land privatisation and EU- membership are well documented (Bicik et al., 2001; Krausmann et. al., 2003; Lipsky, 1995). Recent studies showed that agricultural land use change patterns have similar
trends in most of the Central and Eastern European countries (Feranec et al., 2000). After the collectivisation period, the intensive, productivist agriculture has been introduced, with high level use of fertilisers and artificial manure. An increased competition in an open agricultural market resulted in an extensification of agricultural practices (Van Dessel et al., 2008) or even land abandonment in peripherical regions with poor farming conditions after the
socio-economic transition. The agricultural core regions of Central and Eastern Europe are, however, characterised by a further intensification of the agricultural practices.
It is at present not clear that the spatial pattern of the recent, intensified agricultural land use changes can be connected or not with the soil quality. Bakker et al. (2005) Podmaniczky et al. (2009), and Lambin & Geist (2006) reported that soil degradation, especially soil erosion, would be a limiting factor of the agricultural land use, but the investigated study area is a Greek island, where the level of soil erosion is very high, and this process dramatically reshaped the frontiers of the agricultural land use.
In Central and Eastern Europe very few studies investigated the role of environmental factors such as soil quality, on the rural land use change patterns in regional scale.
Hietel et al. (2004, 2005) in the German marginal rural area at the local scale found that, in times of major land use changes, the physical attributes (soil texture, elevation, available water capacity) are correlated with land cover. Results of Hersperger & Bürgi (2008) showed that the natural factors are not important for agricultural intensification. Lowicki (2008) concluded that the environmental factors were of marginal, insignificant role on the spatial configuration of the landscapes under the Polish land privatisation.
An insight in the mechanisms of land use change in Central and Eastern Europe is, however, essential to understand the regional-scale soil-land use interactions of the past and to develop appropriate tools for integration into the EU agricultural and land management policies.
Bakker et al. (2005) showed that land use change patterns in the semi-arid Mediterranean areas are to a large extent controlled by the level of soil erosion. In Central and Eastern Europe very few studies investigated the role of soil quality that could control land use change patterns (Bakker et al., 2005).
In order to evaluate the significance of the soil quality factor in land use change processes, recent land use changes are analysed in a typical rural, agricultural landscape in Eastern Europe in the Lake Balaton catchment in Hungary.
Lake Balaton, the largest lake in Eastern Europe, is a recreational area of international significance (Szilassi, 2002) which puts the protection and management of its environment high on the agenda of regional, national and European policy
makers. Lake Balaton is considered to be one of the most environmentally sensitive areas in Hungary (Huszar et al., 1999; Jordan et al., 2005; Kertesz, et al., 1997). Soil degradation due to intensive agriculture in the catchment results in an increasing sediment yield into the lake (Jordan et al., 2005; Van Dessel et al., 2008) The objective of the long-term environmental management in the Balaton catchment is to develop an optimal land use pattern that minimises erosion and soil degradation (Szilassi et al., 2006) in order to protect lake water and ecological quality.
In this study the relationship between soil quality expressed by National Soil Quality Evaluation System (NSES) soil quality scores and land use changes before (1981-1990), during (1990-2000) and after (2000-2006) the political-economic transitions in the Lake Balaton is investigated.
Figure 1. A. Topography of the Lake Balaton catchment study area, also showing relief by a shaded relief model in
the background. Inset: location of the study area in Hungary. B. Land use map in 2006 of the Lake Balaton
2 STUDY AREA 2.1 Physiography
Lake Balaton is located in the Transdanubian region of western Hungary (Fig. 1). The total
catchment area (including the lake itself) is 5,775 km2
with elevations ranging from 104m to 599m a.s.l. The northern part of the catchment is a hilly area characterised by Permian red sandstone, Pliocene basaltic volcanic masses and Triassic carbonate sediment series.
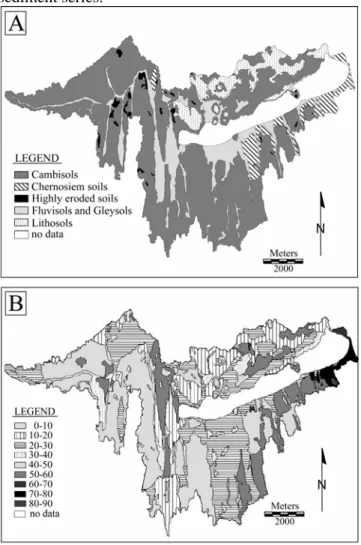
Figure 2. A. The soil map of the Lake Balaton catchment (MTA TAKI 1990). B. The Soil Quality Score Map of the study area (MTA TAKI 1990). Note the higher
soil quality scores in case of the loess areas with Chernosiem soils in the southern catchment and in the
alluvial basins
Tertiary clastic sediments, primarily sandstone, are the main rock types in the southern part of the catchment. Quaternary deposits consist of wetland sediments in the majority of the contributing
sub-catchments, while slope-foot scree, alluvial sediments and Pleistocene loess in valleys are characteristic in the whole catchment (Budai, & Csillag, 1999; Jordan, 2003; Jordan et al., 2003).
Due to variable geological, morphological and hydrological conditions, soil types and soil quality show a great variety and spatial diversity (Fuleky & Major, 1993). The most productive soils are associated with fluvisols covering the alluvial fans, and also in valley bottoms in the southern part of the catchment (Figs 1b 2a, b). Loess areas with chernosiem soils also have high soil productivities. On the hill tops and slopes of the hilly northern part of the catchment a lower soil quality is found, especially on strongly eroded cambisols. Low soil quality is also typical for the lithosols associated with Triassic carbonate rocks (rendzina) and Pliocene basaltic rocks (ranker) in the north (Fig. 2a).
The climate has a typical temperate wet continental character with long-term (50 years) annual
mean temperature of 9.5-9.7 °C, an annual mean
precipitation of 650-680mm, and with an annual
1960-1980 hours of sunshine (Marosi &Somogyi, 1990).
2.2 Agricultural soil quality of the study area The soil characteristics of Hungary were mapped between 1978 and 1980 at a scale of 1:100,000 scale (MTA TAKI, 1990). Soil parameters are represented by classes defined by numerical intervals or descriptive notes according to the National Soil Mapping Standards. The soil factors determining the agro-ecological potential, and the land suitability for agroecology is also represented in the map by so called ‘soil quality scores’ (Varallyai, 1985, 2005). ‘Soil quality scores’ were derived according to the National Soil Evaluation System (NSES). This method ranks soil quality on a scale of 100. The theoretical maximum score is 100. The quality score of a soil type is assessed by subtracting values from this maximum score depending on 17 measured parameters such as the observed humus content, soil pH, carbonate content, salt content, thickness of soil, the observed soil degradation status in the field, etc. (Varallyai, 1985, 2005). In this way, soil parameters are transformed into terms of ´soil quality´ which can be interpreted as ´agricultural soil fertility’ (Fuleky & Major 1993). The final map shows soil quality scores in 10 equal classes (Fig. 2b). The scoring of the National Soil Quality Evaluation System was used successfully countrywide contributing to the
development of one of the most productive agricultural systems in Europe (Domsodi, 2007).
The Lake Balaton catchment study area is dominated by middle (40-50) and the (20-30) soil quality scores (Tab. 1). The highest quality scores (70-80) are found on fluvisols which cover the alluvial fans of the main River Zala, and also on the bottoms of the southern valley in the south (Fig. 3). Loess areas with chernosiem soils are represented also by relatively high quality scores (60-70). On the tops and on the slopes of the hilly northern sub-catchments lower quality scores (20-30) are found associated with strongly eroded cambisols. Also, low quality scores (<20-30) are typical in case the lithosol (rendzina and ranker) soils found over carbonate and basaltic rocks in the north, respectively (Fig. 2a).
3 MATERIALS AND METHODS
3.1 Quantifying the main trends of land use changes connected to the socio-economic changes
Statistical census items of land use are available for of the (386) settlements administrative border in the Balaton catchment, and from the total area of Hungary from 1895, 1913, 1935, 1962, 1971 and 1984 years (Nemeth, 1988). All of the main land use types (arable land, and forest) data of settlements have been summarised for the total cathment area, and the percentage of the land use categories has been calculated. The 1990, 2000, and 2006 land use data of the Balaton catchment are based on the CORINE land cover maps.
The percentage land use change of the total area of Hungary has been calculated based on the yearly statistical data of Hungarian Central Statistical Office for 1895, 1913, 1935, 1962, 1971, 1984 1990, 2000, and 2006 years.
The obtained data has been compared with the main economic changes of Hungary such as land collectivisation (1949-1962), land privatisation (1990-1997), and EU membership (2004).
3.2 Land use mapping
For the analysis of land use pattern in the communist period (before 1990) the 1:100,000 scale National Military Topographic Map made in 1981 was digitized (ArcView, 2002). Land use patterns in the transitional period (1990-1996) and in the market economy period (1996-2004) were derived from the CORINE CLC 100 digital land cover data from 1990 and 2000 (FOMI 2005). The CORINE land cover classification (Heymann et al., 1994; Perdigao & Annoni, 1997), was converted to the less detailed land cover categories in order to be compatible with the military topographic map from 1981 (Table 1).
Finally, a land use map for 2006 depicting the situation after the EU-accession of Hungary in 2004 was generated based on the LANDSAT 5 TM satellite images (FOMI, 2007). Although all the above data sources refer to land cover, the ´arable land cover´ category, the very subject of the present study, is a well-defined land use type (Vuorela, 2002). Therefore, the use of land cover data for the present agricultural land use analysis is justified.
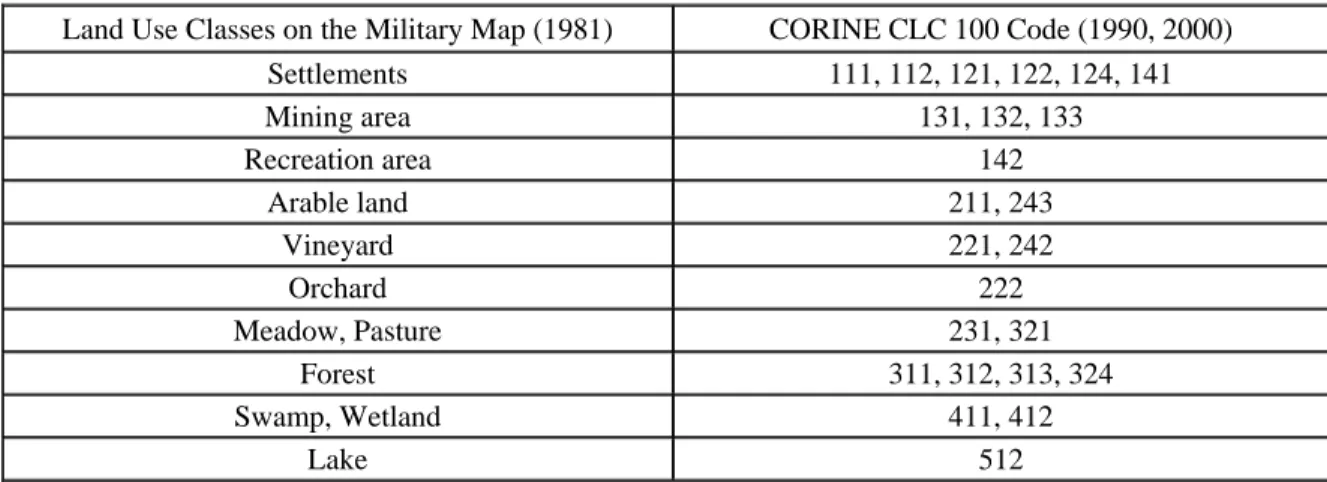
Table 1. Generalization of the CORINE CLC 100 land cover classes into land use categories used in this study. For descriptions of CORINE CLC 100 codes and classes see (Heymann et al. 1994. Perdigao and Annoni 1997)
Land Use Classes on the Military Map (1981) CORINE CLC 100 Code (1990, 2000) Settlements 111, 112, 121, 122, 124, 141 Mining area 131, 132, 133 Recreation area 142 Arable land 211, 243 Vineyard 221, 242 Orchard 222 Meadow, Pasture 231, 321 Forest 311, 312, 313, 324 Swamp, Wetland 411, 412 Lake 512
3.3. Spatial analysis
In order to calculate the proportion of arable lands for various soil qualities, the soil quality score map (Fig. 2b) was overlaid by the land use maps (Fig. 1b), and the area of arable lands, and its transformations into other land use types was aggregated for each soil quality score class (10 classes; see Fig. 2b). In this way the total area of the arable lands for each of the ten soil quality score class could be calculated. The procedure was carried out for the four available land use maps (1981, 1990, 2000, 2006). Next, the change of the area of arable lands within each soil quality score class was calculated in order to evaluate whether certain soil qualities control the spatial pattern of land use change. In order to standardize the observed changes, the total area of the arable lands in 1990 was divided by the total area of the arable lands in 1981 within each soil quality score category. So each percentage of change refers to the total area of the arable lands in the initial 1981 year within a specific soil quality score class. This procedure was repeated for all the successive land use maps (1981-1990, 1990-2000, 2000-2006) reflecting changes from the communist period to the transitional period and from the transitional period to the market economy period.
A final indicator for the arable land use changes between successive time periods within each soil quality category (see Figs 4a, 4b and 4c), was calculated using the following formula:
where:
LUC (land use change): the total change of the area of arable land within each soil quality categories between two successive periods t1 and t2,
TAL (total arable land): the total area of arable lands within each soil quality score category in the t1, and t2 succesive periods (1981, 1990, 2000 and 2006),
SPS: the ten soil quality categories (10-20, 20-30,…, 90-100).
For verification purposes, the percent change of some land use transformations (see Figs 5a,b,c and 6a,b,c) was calculated according to the following
formula:
where:
TRL (transformed land area): the area that was transformed from arable land to forest, pasture, meadow and vica versa, or from arable land to industry, roads, and built up area.
4. RESULTS AND DISCUSSION 4.1 General trends of the main land use changes, and socio-economic background
Agricultural activities have been ongoing in the Lake Balaton catchment since the Roman times (Szilassi, 2000). The dominant land uses have been arable land, vineyards, orchards, pasture and forest (Jordan et al., 2005). Just like in the rest of the country, the area of cultivated lands (mainly arable lands) was increasing from 1854 (first census data available) to the 1930s in the catchment (Szilassi, 2003) (Fig. 3).
Figure 3. The trends of the main land use changes in Hungary and in the Lake Balaton cathment in the 20th century based on statistical data (Nemeth 1988), and on the CORINE Land Cover maps (FOMI 2005). 100% is the total
area of the country and of the Lake Balaton cathment, respectively. See text for details.
In the 1930s, spatial pattern of orchards changed dramatically as the lake became an important touristic resort triggering a three-fold increase of orchard area
(from 0,4 % to 1,3 %) in the lakeside zone (Szilassi, 2007). At the same time, increase of the number and decrease of the size of the arable land parcels were the main processes (Szilassi et al., 2006). Due to the introduction of a centrally directed economy and the modernisation of agrotechnology, lands were collectivised and large-scale agricultural technologies were introduced in the 1960s. As a result, large homogeneous parcels were developed and the spatial landscape variability was dramatically reduced
(Fuleky & Major, 1993). The high level use of
fertilisers and chemical manure also has been introduced. During this period the main land use changes were the decrease of the total area of arable land and the increase of forested areas as a result of the reforestation of former arable lands. These trends were in perfect harmony with changes in the rest of Hungary (Fig. 3). Due to the land privatisation since the transition to market economy in the 1990s, there has been an increase of uncultivated areas, particularly in areas of labour-intensive vineyards. Parallel with this process, the use of fertilisers and chemical manures strongly decreased. However, the decrease of arable lands has become slower than prior to privatisation (Fig. 3). Because of the lack of a harmonised land management, the land use pattern became heterogeneous and spatially fragmented (Csorba, 2000; Jordan et al., 2005; Kovacs, 1999; Loczy, 2000; Mezosi et al., 1996; Szeles, 2005), (Fig 1b). New landowners are often temporary residents for touristic purposes, mainly at the shoreline settlements of Lake Balaton.
4.2 Spatial analysis of agricultural land use changes
In the period between 1981 and 1990, the total area of arable lands was stagnant changing from 35 % to 34 % in the Lake Balaton catchment study area (Fig. 3). More interesting is, however, that in this period the total area of the arable lands decreased for each soil quality category (Fig. 4a), but there is a great diversity in the magnitude of the changes. The highest level of decrease (49%, 190 ha) was detected for the lowest soil quality score category (scores 0-10), while decrease was the lowest (8%, 43 ha) for the best soils (scores 80-90) (Fig. 4a). In fact, there is a consequently decreasing trend from the poorest to the best soils across the ten soil quality score classes (Fig. 4a). This indicates a very systematic land use change mechanism which avoids the use of poor soils for
arable lands while keeping areas with the best soils for this land use type.
Figure 4. Total change of arable lands (%) in each soil quality score class between 1981-1990 (A), 1990-2000 (B),
This fact, together with the above findings, points out that the spatial distribution of arable lands in this period became more concentrated to areas with soil conditions that are the most suitable for arable land cultivation. In this high period of centrally planned and directed economy arrangement of agricultural lands were defined by the scientifically based agricultural suitability of cultivated areas and by national interest, irrespective of private interest and free market needs.
In the period 1990-2000, there was no significant change of the arable lands in the lake Balaton catchment. The total arable lands in Hungary also remained stagnant with a slight decrease from 51 % to 48% (Fig. 3). It is interesting to see the pattern of change of arable lands among the various soil quality areas. In case of the lower quality score classes (scores 10-20 and score 30-40) there was a total 4.7% (567 ha) decrease of arable lands (2.5% (370 ha) and 2.2% (197 ha), respectively). At the same time, for the higher quality score classes (scores 60-70) the aggregated area of arable lands increased by 5.2% (50 ha) (Fig. 4b). It is well documented that the agricultural suitability of the cultivated area was an important factor for the new landowners during the privatisation period (Szilassi et al., 2006), however, not to the extent of the previous centrally planned and directed economy period.
After land privatization, between 2000 and 2006, as the economy had been stabilised and agricultural lands had been privatised, agricultural activities were revitalised and food production on arable lands recovered to levels close to the period 1981-1990 (Szilassi, 2007). The total area of the arable lands did not change in the catchment this time (Fig. 3). The observed very small 1-2% changes are insignificant in all soil quality categories (Fig. 4c).
Land ownership, agricultural land use, subsidies and market conditions had stabilized in this most recent time of EU membership.
4.3 Verification of the results
In order to verify that soil quality really acted as a land use change in the study area int he period 1981-1990, land use transformations that do not depend on soil properties were considered. Areas which transformed from arable land into paved roads, built-up, industrial or mining areas were selected. If no significant relation were found between this type of ‘soil-independent’ land use changes and soil properties
the findings described above could be strengthened.
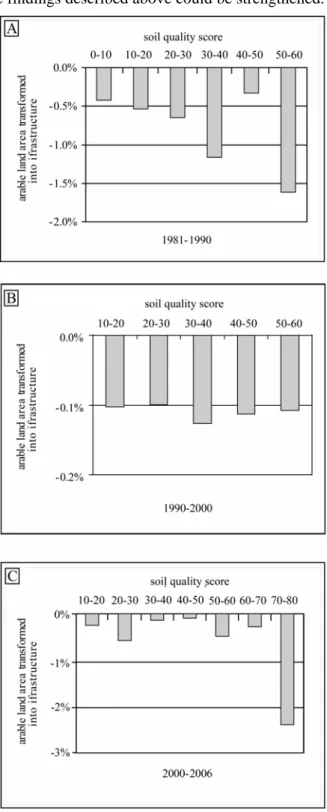
Figure 5. Verification of soil quality control on arable land use changes. The percentage change of the arable lands
transformed into paved roads, built-up, industrial and mining areas in each soil quality score class between
1981-1990 (A), 1981-1990-2000 (B), and 2000-2006 (C).
The Fig. 5a, b and c) suggest that there is no relation between soil quality and the selected land use
change types: arable land use changes for all soil quality categories remain low (<2% but mostly <1%) for all time periods and for each soil quality category (Fig. 5.a, b, c).
Between 1981 and 1990, the highest soil quality score class (scores 50-60) witnessed the highest (1.5%, 811 ha) and the lowest soil quality score class (scores 0-10) witnessed the lowest (0.5%, 1.6 ha) reduction of arable lands. The small change can be explained by the expansion of roads, built-up and industrial areas, as documented by socio-economic studies of the Lake Balaton region (Szilassi, 2007).
Between 1990 and 2000 the percentage of the transformed areas are similar and all very low (~-0.1%, 15-85 ha) in every soil quality score classes (Fig. 5b). Between 2000 and 2006 the percentage of the transformed areas are also very low (<2.4%, 10 ha) (Fig. 5c). These all show that this type of land use transformation is not related to soil quality at all and they occurred randomly in contrast to the land use changes shown in the preceeding discussion.
5. CONCLUSIONS
A spatial analysis of past land use changes and soil characteristics indicated that spatial pattern of soil quality in the study area has played an important role in land use changes in 1981-1990. A relationship was found between soil quality and changes in the spatial pattern of the main characteristic land use type, arable lands. The impact of soil quality on land abandonment and land cultivation was observable between 1981 ad 1990 because under the collectivization period the main trend was the decline of the arable lands on poor soils under a very well-planned and systematic land use management. During the land privatization in the period 1990-2000, the new landowners also based their decisions on soil properties (Van Dessel et al., 2008). However, fast changing and diverse landownership, financial capabilities of the landowners and market interests overprinted this tendency in the transitional period. After the privatization period and EU membership between 2000 and 2006, the spatial patterns of arable lands stabilized and little changes occurred.
Based on the results it can also be concluded that the complex soil evaluation methods, the soil quality scores, are good indicators of agrarian suitability of soils when they were systematically used in land use planning in 1981-1990.
Acknowledgement: This research has been supported by the Hungarian Scientific Research Found (OTKA) id: K 60203 2FT. Thanks are extended to Gabor Csillag of the Geological Institute of Hungary for his help with field work and for his valuable comments.
6. REFERENCES
ArcView., 2002. Arc View User’s Manual. ESRI, USA Bakker, M., Govers, G., Kosmas, C., Vanacke,r V., Oost
van, K., & Rounsevell M., 2005. Soil erosion as a driver of land use change. Agriculture, Ecosystems & Environment, 105, 467-485.
Bicik, I., Jelecek, L. & Stepanek, V., 2001. Land-use changes and their social driving forces in Czechia in the 19th and the 20th centuries. Land Use Policy 18, 65-73.
Budai, T. & Csillag, G., (Eds.), 1999. Geology of the Balaton Highland. Ocassional Publications of the Geological Institute of Hungary. 197. (in Hungarian with English summary)
Csorba, P., 2000. The transformation o landscape ecological structure following the land privatisation in Hungary since 1989. In.: Mander U., Jongman R.H.G ed.: Consequences of Land Use changes Advances in Ecoogical Scinces V. WIT Press Southampton, pp. 185-197.
Domsodi, J., 2007. Land Use. Dialog Campus, Budapest-Pecs, 448. (in Hungarian)
Feranec, J., Suri, M., Otahel, J., Cebecauer, T., Kolar, J., Soukup, T., Zdenkova, D., Waszmuth, J., Vajdea, V., Vijdea, A.M., & Nitica, C., 2000.
Inventory of major landscape changes in the Czech Republic, Hungary, Romania and Slovak Republic 1970s – 1990s. Journal of Applied Earth Observation and Geoinformation. 2, 129-139.
FOMI, 2005. (Hungarian Institute of Geodesy, Cartography and Remote Sensing) CORINE CLC 100Land Cover Data Base 1990, 2000.
FOMI, 2007. (Hungarian Institute of Geodesy, Cartography and Remote Sensing) LANDSAT 5 TM 12-09-2006. Center Lat: +46:50:59, Center Long: +017:00.44 Eurimage
Fuleky, Gy. & Major, I., 1993. Changes in the landscape during the last 200 years in the region of the ZalaValley and effect on the economic activity of the area. Landscape and Urban Planning, 27, 265-267. Hersperger, A. M. & Bürgi, M. 2008. Going beyond
landscape change description: Quantifying the importance of driving forces of landscape change in a Central Europe case study. Land Use Policy 26, 3, 640-648.
Heymann, Y., Steenmans, Ch., Croisille, G., & Bossard, M., 1994. CORINE Land Cover Technical Guide.
Office for Official Publications of the European Communities, Luxemburg, 136.
Hietel, E., Waldhardt, R., & Otte, A., 2004. Analysing land-cover changes in relation to environmental variables in Hesse, Germany. Landscape Ecology 19, 473-489.
Hietel, E., Waldhardt, R., & Otte, A., 2005 Linking socio-economic factors, environment and land cover in the German Highlands, 1945–1999. Journal of Environmental Management, 75, 2, 133-143.
Hungarian Central Statistical Office., 2000 Hungarian agriculture, (1851-2000). CD Rom Budapest, 425. Huszar, T., Mika, J., Loczy, D., Molnar, K., & Kertesz,
A., 1999. Climate Change and Soil Moisture: A Case Study Physics and Chemistry of the Earth Part A.
Solid Earth and Geodesy 24, 905-912.
Jordan, G., 2003. Morphometric analysis and tectonic interpretation of digital terrain data: a case study. Earth Surface Processes and Landforms, 28, 807-822.
Jordan, G., Csillag, G., Szucs, A. & Qvarfort, U., 2003.
Application of digital terrain modelling and GIS methods for the morphotectonic investigation of the
Kali Basin, Hungary. Zeitschrift fur
Geomorphologie. 47, 145-169.
Jordan, G., Van Rompaey, A., Szilassi, P., Csillag, G., Mannaerts, C., & Woldai T., 2005. Historical land use changes and their impact on sediment fluxes in the Balaton basin. (Hungary) Agriculture, Ecosystems & Environment. 108, 119-133.
Kertesz, A., Richter, G., & Varga, G., 1997. Water Balance and sediment yield in Lake Balaton
Catchment, Hungary. Zeitschrift fur
Geomorphologie. 110, 125-136.
Kovacs, T., 1999. Regional disparities in the privatisation of land In: Hajdu Z. (Eds.) Regional Processes, and Spatial Structures in Hungary in the 1990’s. Centre of Regional Studies, Pecs, Hungary, 100-121.
Krausmann, F, Haberl, H, Schulz, N. B, Erb, K., Darge, E., & Gaube, V., 2003. Land use change and socio-economic metabolism in Austria - Part I. driving forces of land use changes 1950-1990. Land Use Policy 20, 1-20.
Lambin, E.F, Geist, H., 2006. Land-use and Land-cover Change. Local Processes and Global Impacts Springer, Berlin Heidelberg 222.
Lowicki, D., 2008. Land use change in Poland during transformation Case study of Wielkopolska region Landscape and Urban Planning 87, 279-288.
Lipsky, Z., 1995. The changing face of the Czech rural landscape. Landscape and Urban Planning 31, 39-45. Loczy, D., 2000. Issues of landscape change in Hungary:
An evaluation of impacts of land privatisation and reclamation. In: Kertesz A., Schweitzer F. (Eds.) Physico-Geographical Research in Hungary Geographical Research Institute of Hungarian Academy of Sciences Budapest, 161-168.
MTA-TAKI., 1990. (Hungarian Academy of Science Research Institute for Soil Sciences and Agrochemistry) AGROTOPO Map Digital Data Base, S=1:100 000
Marosi, S., Somogyi, S., (Eds.), 1990. Cataster of the Hungarian Small Landscapes. II. Geographical Research Institute of Hungarian Academy of Sciences Budapest, 483-627. (in Hungarian)
Mezosi, G., Barany-Kevei, I., & Geczi, R., 1996. Future ecological value of the Hungarian landscape. Acta Geographica, Universitatis Szegediensis, 25, 21-43. Nemeth, F., (Eds.), 1988. Agricultural statistical datas
collection of Hungary (1895-1984) Land use III. Settlements data. Hungarian Central Statistical Office, CD Rom Budapest, 356.
Perdigao, V., Annoni, A., 1997. Technical and Methodological Guide for Updating CORINE Land Cover Data Base. Joint Research Centre, European Environmental Agency, Luxemburg, 124.
Podmanicky,L., Balazs,K., Belenyesi,M., Centeri, Cs., Kristof, D., & Kohlheb, N., 2009. Modelling soil quality changes in Europe. An impact assessment of land use change on soil quality in Europe. Ecological Indicators. doi:10.1016/j.ecolind.2009.08.002
Szeles, Z., 2005. Hungarian land use change in the last decade. IV. Alps Adria Scientific Workshop Portoroz, Slovenia, 345-348.
Szilassi, P., 2000. Land use changes of the hillslope of the Fekete Hill (Kali basin) between 1958-1993. Acta Geographica, Universitatis Szegediensis, 37, 93-99. Szilassi, P., 2002. Possibilities of country development from
the point of view of tourism – an investigation in the Kali Basin (west Hungary). Geographica Pannonica. 3, 30-32.
Szilassi, P., 2003. Causes and effects of land use transformation: the case of Kali basin, Hungary. In.: Foldrajzi Ertesito 52, 189-214. (in Hungarian with English summary)
Szilassi, P., Jordan, G., Van Rompaey, A., & Csillag, G. 2006. Impacts of historical land use changes on erosion and agricultural soil properties in the Kali Basin at Lake Balaton, Hungary. CATENA, 68, 98-108.
Szilassi, P., 2007. Data base creation in landscape history and its application possibilities in the Balaton catchment area. In: Kertesz A., Dovenyi Z., Kosis K., (Eds.) III. Conference of Hungarian Geographers Geographical Research Institute of Hungarian Academy of Sciences Budapest, CD Rom. (in Hungarian with English summary)
Varallyai, Gy., 2005. Soil Survey, and Soil Monitoring in Hungary. In: Soil Resources of Europe, second edition. Jones, R.J.A B., Houskova, B., Bullock, P., & Montanarella, L., (eds). European Soil Bureau Research Report No.9, EUR 20559 EN, Office for
Official Publications of the European Communities, Luxembourg, 169-179.
Varallyay, Gy., Szucs, L., Zilahy, P., Rajkai, K. & Muranyi, A., 1985. Soil factors determining the agro-ecological potential of Hungary. Agrokemia es Talajtan. 34, 90-94. (in Hungarian)
Van Dessel, W., Van Rompaey, A., Poelmans, L., & Szilassi, P., 2008. Predicting land cover changes and
their impact on the sediment influx in the Lake Balaton catchment. Landscape Ecology 23, 6, 645-656.
Vuorela, N., Alho, P., & Kalliola, R., 2002. Systematic assessment of Maps as Source Information in Landscape-change Research. Landscape Research, l27, 141-166
.
Received at 15. 01. 2010 Revised at 21. 04. 2010
Accepted for publication at: 21. 04. 2010 Published online at: 24. 04. 2010