Hege Marie Gjefsen
Educational behavior in the dynamic
micro-simulation model MOSART
Rapporter
Reports
Hege Marie Gjefsen
Educational behavior in the dynamic
micro-simulation model MOSART
sample surveys, censuses and register-based surveys.
Symbols in tables Symbol
Category not applicable . Data not available .. Data not yet available … Not for publication : Nil -Less than 0.5 of unit employed 0 Less than 0.05 of unit employed 0.0 Provisional or preliminary figure * Break in the homogeneity of a vertical series — Break in the homogeneity of a horizontal series | © Statistics Norway
When using material from this publication, Statistics Norway shall be quoted as the source.
Published April 2013 ISBN 978-82-537-8627-8 (printed) ISBN 978-82-537-8628-5 (electronic) ISSN 0806-2056 Subject: 04.01
Preface
Statistics Norway’s MOSART model is a micro-simulation model based on demographical projections. It is used to analyze public expenditure in the long run, as well as to produce labor supply projections. Education is an important
characteristic in the model, both in itself and because labor market attachment is highly correlated with level and field of education. Due to substantial changes in the educational system since the establishment of MOSART in the early1990’s, an extensive update and re-estimation of educational relations has been necessary. Hege Marie Gjefsen has prepared the data and estimated the transition probabilities used in the model, in addition to writing the report. Dennis Fredriksen has
incorporated the data and transition probabilities in the model, and Nils Martin Stølen has contributed to the presentation of the report.
Statistisk sentralbyrå, 14 February 2013 Hans Henrik Scheel
Abstract
The report provides an overview of the modeling of educational behavior in the MOSART model, and how education is included in the model. The model is used to create projections of labor supply by education and of the population by educational background, and these are presented in the model.
The MOSART model is based on a system called dynamic micro-simulation. The educational characteristics in the MOSART model are determined by the
individual’s path through the educational system, defined by the following choices: whether to start an educational activity, choice of the level and field of education, whether to complete or not and, finally, whether to continue or not. In addition, the model contains a module that enables individuals’ educational attainment to be updated without their being registered as being in education. Transition
probabilities are estimated on the basis of Norwegian register data from 1999-2009. The propensity to start an educational activity depends on educational background. The probability of embarking on a new education increases if the individual has spent the last year in education, both if the education was completed or
discontinued. The probability of starting in tertiary education is high at the ages of 19 and 20, after which it decreases. After the age of 30, the probability of starting in a new educational activity is relatively low.
Choice of the level and field of education is highly dependent on age – between the age of 16 and 18, the most usual choice is upper secondary education, while at 19 there is a higher probability of choosing folk high school, and, at higher ages, tertiary education is the most common choice. Those starting educational activities at master’s level include both persons with a high school education taking a five-year degree and persons with a completed bachelor level education taking a two-year degree.
The choices of completing and continuing are closely related. The probability of completing an ongoing education is at its highest after having spent three years taking general studies at high school and after three years of short tertiary
education for men. The highest probability of completing a long tertiary education is after five years in education. The propensity to continue in education is highest at the start of the education, and it typically peaks at year two of an education. Those who have their educational attainment updated without their being registered as in education have to a large extent been students in the same fields of study as earlier. The probability of having educational attainment updated is relatively high for immigrant men with unknown educational background who have spent time in the Norwegian educational system. Those who have a low level of education have a higher probability of such updating, and their probability of having their
educational attainment updated without being registered also increases with the time previously spent in education.
Based on assumptions about constant transition probabilities, the MOSART model is used to project the labor supply and population by educational background. The educational level of both the population and labor supply is expected to increase as older cohorts with low education are replaced by younger cohorts, who generally have a higher level of education. The number of persons with an educational background in economics and administration, social sciences and humanities at master’s level is expected to increase more than other groups. The same applies to health studies at both master’s and bachelor’s level.
Sammendrag
Rapporten inneholder en oversikt over hvordan utdanningsadferd inngår i MOSART-modellen, og gir et bilde av hvordan man beveger seg gjennom utdanningssystemet i Norge. MOSART-modellen benyttes til fremskrivninger av arbeidstilbud og
befolkning etter utdanningsbakgrunn, og disse fremskrivingene er også presentert i denne rapporten.
MOSART-modellen er basert på et opplegg som kalles dynamisk mikrosimulering. Innenfor et slikt opplegg bestemmes utdanningsbakgrunnen av hvert individs vei gjennom utdanningssystemet definert ved følgende valg: Å starte en utdannings-aktivitet, å velge nivå og fagfelt dersom man starter en utdanning, å velge å fullføre, og til slutt et valg om å fortsette i den samme utdanningsaktiviteten dersom man ikke fullfører. Det er en viss andel som oppnår kompetanse uten å ha vært registrert som studenter, og disse blir fanget opp av en egen modul. De forskjellige overgangssannsynlighetene er estimert fra data mellom 1999-2009. Sannsynligheten for å starte i en utdanning er avhengig av hva slags utdanning man har fra før. Denne sannsynligheten øker dersom en person har vært i utdanning året før, både i det tilfellet man fullførte et studieprogram, og dersom man avbrøt en utdanning. Sannsynligheten for å starte en ny utdanningsaktivitet i høyere utdanning er naturlig nok høy ved 19 og 20 års alder, og reduseres noe når alderen øker. Etter fylte 30 er sannsynligheten for å starte en ny utdanningsaktivitet relativt lav.
Valg av nivå og fagfelt er svært avhengig av alder – mellom 16 og 18 velger man i stor grad videregående opplæring, 19-åringer har en forhøyet sannsynlighet for å starte på folkehøyskole, og ved høyere alder velger man i stor grad høyere ut-danning. De som velger utdanninger på masternivå er både de som kun har videre-gående utdanning og som starter et femårig løp, og de som har en bachelorut-danning bak seg og starter et to-årig løp.
Valgene om å fullføre og fortsette henger tett sammen. Fullføringssannsynligheten stiger når man beveger seg mot normert tid av studiet, som er ensbetydende med at man har valgt å fortsette tidligere. Den er høyest etter tre år for allmennfaglig utdannelse på videregående nivå, og kort høyere utdanning for menn. Dersom man er i lange utdannelser på universitetsnivå er fullføringssannsynligheten høyest etter fem år. Også utover normert tid er det en ikke ubetydelig sannsynlighet for å fullføre utdanningen, som er i tråd med at mange studenter fullfører på overtid. Sannsynligheten for å fortsette i studiet er høyest i starten av forløpet, og typisk høyest ved det andre året.
De som oppnår formell kompetanse uten å ha vært registrert i utdanning de siste årene har i høy grad vært registrert i den samme utdanningen på et tidligere tids-punkt. Sannsynligheten for å få en slik oppdatering av den høyeste fullførte utdanningen er relativt høy blant innvandrede menn med ukjent utdanning som har tilbrakt tid i utdanningssystemet. Sannsynligheten er også høyere for de med lav utdanning i utgangspunktet. For de med ukjent utdanning eller grunnskoleut-danning er det en positiv effekt på sannsynligheten for kompetanseoppdatering av tidligere å ha tilbrakt tid i utdanning opp til fire år.
Ved å anta konstante utdanningstilbøyeligheter kan MOSART-modellen brukes til å simulere arbeidstilbud og befolkning etter utdanningsnivå og fagfelt i fremtiden. Utdanningsnivået i befolkningen forventes å være økende, ettersom eldre kohorter med lavt utdanningsnivå skiftes ut av nye med høyere tilbøyeligheter til å ta utdanning. Det samme gjelder for arbeidsstyrken. Gitt videreføring av dagens utdanningstilbøyeligheter, vil både antall og andel med utdanninger innen økonomi og administrasjon på masternivå øke kraftig frem mot 2030, og det samme er tilfellet med utdanning innen samfunnsfag og humanistiske fag på masternivå. Antall personer med helsefaglig utdanning utenom sykepleie, medisin og tannlege vil også øke, både på bachelor- og masternivå.
Contents
Preface ... 3 Abstract... 4 Sammendrag... 5 1. Introduction ... 7 2. Background ... 82.1. Stylized facts about the Norwegian school system... 8
2.2. School reforms ... 12
3. Educational transitions and data overview... 15
3.1. The MOSART model ... 15
3.2. Data and definitions... 15
3.3. Educational transitions ... 18
3.4. Starting an educational activity... 19
3.5. Choice of level and field ... 19
3.6. Educational attainment without being a student ... 22
3.7. Comparison with official statistics... 23
4. Econometric modeling... 27
4.1. Starting in education... 27
4.2. Choice of level and field ... 33
4.3. Completing and continuing educational activities ... 38
4.4. Educational attainment without being a student ... 42
5. Projections... 48
5.1. Registered students in the future ... 48
5.2. Educational level of the population... 49
5.3. Labor force by education... 50
References ... 53
1. Introduction
Individuals’ educational characteristics are highly correlated with labor market outcomes. This is reflected in the Norwegian micro-simulation model MOSART,1 where education is an important factor in explaining the behavior of individuals in the labor market, and also other outcomes in life. Educational background affects several events over the lifecycle in this model. It is a factor in determining the individual risk of unemployment and disability, as well as life expectancy. The model does not distinguish self-selection mechanisms from causal effects of education on later demographic and labor market outcomes. Only the correlation between educational choices and later outcomes is included in the model. These correlations can be interpreted as combinations of the self-selection mechanisms and causal relationships.
By using the MOSART model, we are able to produce projections of the number of students distributed over different fields and levels. The model also produces projections for level of education, of both the population as a whole and the labor force. Information about the educational background of the population and labor force is important, for example for estimating future public expenditure and uncovering possible labor market imbalances.
The current Norwegian school system is described in section 2.1. Stylized facts are used to explain the main features of educational behavior and the level of schooling of the Norwegian population. The educational system in Norway has been
extensively reformed over the last 20 years, including reforms in primary schooling, secondary schooling and tertiary education. Reforms can change the definitions of education, which can also have an effect on propensities to make educational choices. A successful reform will increase the level of learning in the affected cohorts, and therefore change the educational behavior of individuals. The reforms are not modeled directly, but the transition probabilities will change with new choices made by the population. The main purposes of the reforms, as well as some of their implications, are described in section 2.2.
If the reforms make the population alter their choices compared to what they would have done prior to the reform, they could also have an impact on how the
educational level influences other outcomes, such as labor market attachment. Propensities to make educational choices can change when the school system is reformed. The full effect of all reforms has not yet been observed. The most recent available data are used to estimate transition propensities, so that they are in accordance with behavior under the current educational system.
A consistent definition of educational level and field is an important feature of a micro-simulation model. This enables comparisons of education over time. A substantial part of the work of revising the data has consisted of ensuring that the definitions of educational categories are consistent over time. The definitions of the different levels and fields of education, and how they differ from earlier
definitions, are explained in section 3.1, which also contains an overview of the data material used. There are several paths in and out of education, and educational choices are made at different points in time. The same qualifications can be
attained by choosing different paths. The modeling of educational choices in MOSART is described in section 3.2. The data and definitions are discussed in section 3.3, and a comparison with the official statistics is presented in section 3.4. Section 4 describes the econometric modeling and the resulting estimates for each of the transitions in the model. Section 5 contains projections of the number of students in Norway, as well as of the labor supply and population by educational background.
1
MOSART is a Norwegian acronym for Model for micro-simulation of education, labor supply and social security.
2. Background
2.1. Stylized facts about the Norwegian school system
The Norwegian educational system consists of 10 years of compulsory education, followed by three or four years of high school. Most students complete compulsory schooling at sixteen, but some also start schooling one year earlier than the rest of the cohort, finishing when they are fifteen. In some cases, students complete compulsory schooling at a later point in time, but this is rare in Norway. Upper secondary education is not compulsory, but everyone in Norway has a statutory right to it, and about 95 percent of each cohort continue their education by starting high school directly after completing their compulsory schooling. In Norway, upper secondary education is divided into two areas: vocational education programs and programs in general studies. The main model for vocational
education is based on two years of schooling and two years of vocational training as an apprentice in an enterprise. Students in general programs attend upper secondary education for three years. Students in vocational programs can change course and attain vocational or general proficiency by taking a third year at school instead of working as an apprentice. This limits the type of proficiency obtained, but it is an alternative for students in vocational education who are not able to or interested in finding apprenticeships.
While most youths start upper secondary schooling in the semester after completing their compulsory schooling, all of them do not complete their education. In recent years, about two-thirds of each cohort have completed high school five years after leaving compulsory schooling (Statistics Norway, 2012a). General studies are the largest field of education at this level. Almost 50 percent of high school students complete their education in general studies, while the rest of the students who complete follow a vocational track. While the completion rate varies across vocational fields, it is lower than for general programs. Field of education is an important factor in determining the risk of leaving school without a formal qualification. Vocational programs in the electrical, mechanical and
machine trades have the lowest completion rate, with just over 50 % having completed their education five years after starting it. General programs have the highest completion rate, at more than 80 %, closely followed by programs in economics and administration. Other vocational programs have a completion rate of between 50 and 60 %.
Completing high school is a necessary condition for entering most kinds of tertiary education. However, there are rules that give persons with “informal”
qualifications the possibility of entering tertiary education if they are 25 years or older. Students compete for study places on the basis of their high school grades, and, for a number of study programs, there are more applicants than study places. Tertiary education is divided into two parallel directions. Professional colleges offer professional studies, for example nursing, engineering and teaching. Most of these educational programs have a duration of three years, while teacher training has a duration of four years. After completing an educational program at
professional college, the students have qualifications for specific kinds of work. At universities, students obtain a bachelor’s degree after completing three years of study, and a master’s degree after studying in a master’s program for two years after taking a bachelor’s degree. Some of the programs at universities are
integrated programs. Students starting on one of these programs can start in what is defined as a master’s program once they have finished high school. The degree is completed after five or six years of study, depending on the program. Most people who complete professional studies and university studies have found relevant work within six months of graduation (Arnesen, 2010).
Certain educational programs do not belong to the tertiary education group, even though most of the students attending them have a high school certificate. The reason for this is that the schools are not accredited to offer degrees at tertiary level. These programs are referred to as education at post-secondary, non-tertiary level. This group consists of different vocational courses of varying duration. There are important differences between the courses. Some of them offer pre-degree foundation courses that are necessary for admission to subsequent studies, while other courses are extensions of vocational high school education. Post-secondary, non-tertiary education is thus an important extension of high school education. The students obtain proof of their proficiency, which can be an asset in the labor market, especially for students without a high school certificate. Post-secondary, non-tertiary education is equivalent to level 4 on the ISCED 1997-scale2
(UNESCO 2006).
Some parts of the educational system do not have any prerequisites for admission, and they do not result in any formal qualifications. These tracks are defined as a separate level of education. This level is different from post-secondary, non-tertiary education in the sense that it is not designed to improve labor market possibilities. This level of education includes military officer training, home economics courses, and folk high school.
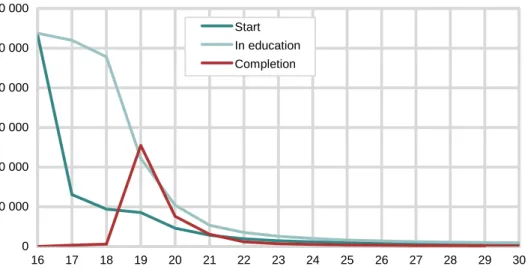
Figure 2.1. Number of people in upper secondary education by age, 1999-20091
0 10 000 20 000 30 000 40 000 50 000 60 000 16 17 18 19 20 21 22 23 24 25 26 27 28 29 30 Age Number of people Start In education Completion 1
The tables and figures are based on the data used to estimate transition probabilities, unless stated otherwise.
A large number of 16-year-olds start in upper secondary education, and the number of persons starting an education decreases sharply after the age of 16. The number of persons by age in upper secondary education is high until the age of 18, which is to be expected since upper secondary education lasts at least three years. The number of persons completing such education is at its peak at the age of 19, which is three years after most youths start their education.
The number of persons starting in post-secondary, non tertiary education is highest at the age of 20, after which it gradually decreases. The number of persons
completing an education at this level peaks between the ages of 20 and 22.
2
Figure 2.2. Number of persons in post-secondary, non-tertiary education, 1999 – 2009 0 100 200 300 400 500 600 700 800 900 1 000 16 17 18 19 20 21 22 23 24 25 26 27 28 29 30 31 32 33 34 35 36 37 38 39 40 Age Number of people Start In education Completion
Figure 2.3. Number of people in short tertiary education by age, 1999 – 2009
0 2 000 4 000 6 000 8 000 10 000 12 000 14 000 16 000 18 000 16 17 18 19 20 21 22 23 24 25 26 27 28 29 30 31 32 33 34 35 36 37 38 39 40 Age Number of people Start In education Completion
Figure 2.4. Number of people in long tertiary education, 1999-2009
0 1 000 2 000 3 000 4 000 5 000 6 000 16 17 18 19 20 21 22 23 24 25 26 27 28 29 30 31 32 33 34 35 36 37 38 39 40 Age Number of people Start In education Completion
The number of people starting in short tertiary education is at its highest at the age of 20, but it remains high also after this age. The number of people in short tertiary education is at its highest at the age of 21, reflecting high enrolment also after the age of 20. The duration of these programs is three years in most cases, and the number of persons completing an education in these fields is highest three years after the highest enrolment, at the age of 23.
A large number of persons start in educational programs leading to proficiency at master’s level at the age of 20. Those starting long tertiary educational programs comprise both people who have completed a short tertiary education and those who want to pursue a five-year integrated program. There are two ages at which the number of persons starting a long tertiary education peaks. The second peak is dominated by those who want to take a two-year degree subsequent to a bachelor’s degree. The number of persons completing master’s level programs is highest at the ages of 25 and 26, which is to be expected. The number of persons enrolled in long tertiary education is high compared to the number of persons starting in it, but this is due to the fact that people stay in this level of education for a long time. Figure 2.5. Time trend in enrolment in tertiary education
0 20 000 40 000 60 000 80 000 100 000 120 000 1980 1982 1984 1986 1988 1990 1992 1994 1996 1998 2000 2002 2004 2006 2008
There was steady growth in the number of persons starting tertiary education from 1980 until around 2002, after which point the student numbers remain at the same level.
Table 2.1 presents the proportion of recent cohorts of 30-year old men and women by highest completed education. Most people have completed their education by the time they turn 30. With constant educational propensity, 30-year-olds may give a representative picture of the expected level of education in Norway for younger cohorts.
Table 2.1. Highest education for recent cohorts at age 30. Percent1
Cohort Ulsory Upper
Comp-known Lower Un-schooling Higher secondary education Tertiary education Tertiary persons 1 000 1974 ... 23 6 39 22 10 71 1975 ... 22 7 37 22 11 68 1976 ... 217 36 24 12 66 1977 ... 20 8 35 26 12 64 1978 ... 19 8 34 27 13 65 1979 ... 19 8 32 27 13 65 1 MOSART data
The proportion of 30-year-olds with only compulsory education declines over time. The proportion of persons from recent cohorts with only a high school education at the age of 30 has also been decreasing in recent years. There has been a significant increase in the proportion of persons with lower tertiary education, and the same is
the case for people with higher tertiary education. The proportion of 30-year-olds with unknown education has been increasing as a result of immigration. As more people have tertiary education, fewer 30-year-olds only have compulsory or upper secondary schooling.
2.2. School reforms
There have been several major reforms of the Norwegian school system since the previous estimation of transition probabilities in 1993. Reform 94 mainly
concerned upper secondary schools, Reform 97 concerned primary and secondary schooling, while the Quality Reform of 2003 affected higher education. A new school reform, the Knowledge Promotion Reform, comprising all primary and secondary education, was introduced in 2006. This means that every part of the educational system in Norway has been reformed during the last twenty years. In the following section, the most important features of each of the reforms and their possible effects on transition probabilities are described.
Reform of upper secondary education
Reform 94 changed the structure of high schools. It was introduced for students starting upper secondary education in 1994. The number of study programs was reduced from approximately 100 to 13, and the first year of upper secondary education became more general. The curriculum for the first year courses in the different study programs had a common part and a more specialized part, which made it easier to change programs after the first year. Specialization took place in the second or third year of education.
As study programs were discontinued, and others were created, the categories of fields of education changed. This made it important to revise the categories in the data and the model to ensure that they are consistent before and after the reform. The structure became more flexible, and with more general programs it became possible to switch study programs without affecting progression. With this reform, high school proficiency in general studies became more available to students taking vocational courses. Students were given a statutory right to spend three years in full-time education during a period of five years before the age of 24, which made it easier to stay in education, especially for younger students.
Prior to the reform, the through-put in vocational education had been slow.
Students moved horizontally from one course to the next on the same level, instead of moving on to a higher level and eventually completing upper secondary
schooling. The reduction in the number of study programs and the increased flexibility made it less complicated to move vertically up the school system even with a change of study program. Moving horizontally through the educational system is the equivalent of taking different courses at the same grade level, and not increasing the level of education. When moving vertically, the students remain in the same fields, but increase their educational level. Together with the introduction of the right to education, this was intended to increase the completion rate for upper secondary education. An increase in the proportion of persons completing high school education has not been observed after the reform, however.
Prior to the reform, educational choices made at the age of sixteen could limit later career choices. After 1994, it became easier to obtain the necessary qualifications for tertiary education, also for those with a vocational qualification. The
opportunities available to high school graduates from vocational tracks thus
increased with this reform. Redistribution of the high school graduates over general and vocational fields could have an effect on the propensity to enroll in further education. Students with vocational proficiency are often well adapted to the labor market, especially those who obtained their qualifications through an
apprenticeship. With good possibilities of finding relevant work, individuals with vocational proficiency are less likely to enroll in higher education. On the other hand, the reform made it easier for the same students to acquire qualifications for
tertiary education. The propensity for students with vocational proficiency to enter tertiary education could therefore be higher after the reform.
Age profiles in both upper secondary and tertiary education may be affected by more people completing higher secondary education at a younger age. Prospective students aiming for higher education could be younger than before the reform, especially for those with vocational proficiency. The reform could thereby affect the probability of completing and continuing an ongoing education.
There was a new reform of upper secondary education in 2006. The 2006 school reform did not have a big impact on the structure of upper secondary education and nor did it have any consequences for the modeling of educational behavior. It was a reform that changed the content and organization of the education, with only small changes to its structure. The exception is the field of economics and administration, where a decrease in the number of students in the second and third school years is observed in the data. The choices made by the students are the same, but the registration of their educational choices has changed. The 2006 reform included all primary and secondary education. The intention of the 2006 school reform was to improve learning, especially in writing, reading and math, throughout students’ education.
Reform of primary and lower secondary education
In 1997, a school reform was introduced for primary and lower secondary education, extending compulsory schooling from nine to ten years. Children start school at the age of six instead of seven following the introduction of this reform. Initially, the additional year in primary school was not intended to be a year of schooling, but compulsory preschool. An important aim of the reform was to improve the language skills of children with weak language development, and thus increase their learning outcomes throughout their school attendance (Drange, Havnes et al. 2011). Improved skills are likely to lead to higher performance in education. As the first cohort affected by this reform throughout their schooling finished compulsory education in 2007, it is still too early to see an impact of the reform on educational choices and labor market possibilities.
The reform did have a substantial effect on the content of primary education. One intention of the reform was to make lower secondary schooling more oriented towards upper secondary education, which would make the transition to higher secondary education easier and thereby increase the propensity to choose to start high school.
Previously, the learning objectives for primary and secondary education had been very general, and schools and municipalities were free to prioritize within the curriculum. Following the 1997 reform, the learning objectives were defined by the Ministry of Education (Ministry of Education and Research, 1996). The same curriculum was to be taught at the same grade level throughout the country, with less freedom for schools to decide their own priorities. Regardless of which school they attended, students should be taught the same curriculum at the same age. This is to make sure that all children have the same skills at every stage of their
education.
Reform of higher education
A large reform of the university sector called the Quality Reform (Kvalitets-reformen) started in 2003. It was a part of the Bologna process, which was a collaborative project between European countries to harmonize the structure of higher education. The aim of this process was to synchronize the structure of academic degrees and make them the same across Europe. In Norway, this meant that the old structure, with three educational levels in tertiary education, was replaced by a system of bachelor’s and master’s degrees. The reform was intended to increase students’ international mobility and increase the throughput of students in higher education. It also aimed to make more students spend more time on their
studies, and to extend the semesters. The grading system was changed by the reform, and the scale now runs from A to F in accordance with the ECTS system.3 The Quality Reform is likely to have a large influence on the propensity to make different educational choices. The synchronization of degrees with the rest of Europe means that a completed education is updated more rarely, and this could potentially lead to a decreased propensity to complete, without any actual changes occurring in behavior. As a result of the 2003 reform, many of the universities’ study programs became more structured, and the path to proficiency became clearer. This could make it more appealing to start a university education, especially for groups with limited insight into the educational system.
Capacity in tertiary education increased significantly from the beginning of the 1980’s to 2000. One of the reasons for this expansion was that unemployment was relatively high in Norway in the early 1990’s. Capacity has remained high since, and it is expected to also stay high in the future. When using the period after this expansion to estimate educational propensities, the effect of high capacity in the educational system is included. This is important in relation to making projections for the future. Observed behavior is based on a combination of preferences and capacity constraints, and the two are not disentangled in the MOSART model. A common feature of all the reforms is their intention to increase the students’ learning outcomes and progression through education. If successful, a reform can alter educational choices, and also the effect of educational background on further choices.
3
3. Educational transitions and data overview
In this section, I will give a brief overview of how educational choices were previously modeled in the MOSART model, and how they are modeled today. I will describe the data and the definitions used to arrive at consistent categories of education throughout the period.3.1. The MOSART model
The MOSART model is a micro-simulation model used to analyze the pension system, public expenditure, and labor supply. Educational background has been an important characteristic in the MOSART model from the start. The probability of starting an education after the age of 30 is drastically lower than for those under 30. Most people do not change their educational attainment as adults, and it can
therefore be regarded as a fixed characteristic. It is highly correlated with later labor market attachment and demographical events, making it a well-suited explanatory variable for later choices in life.
In the MOSART model, every person in the population has a transition probability for each possible choice at every point in time (Fredriksen, 1998). The transition probability is calculated by using the estimates of how different characteristics are associated with the probability of making a transition, together with each person’s characteristics. The individual transition probabilities are found by using logit-expressions. When running the model, the individual transition probabilities are matched by drawing a random number between 0 and 1. The event takes place if the transition probability assigned to a particular person is higher than this random number. Having a high transition probability means that the probability of the random number being below the transition probability is high, but it is still possible that persons with a high risk of making a certain choice will make a different one, as we observed in real life. The drawing of the random numbers is discussed in Fredriksen (1998).
The events are simulated in a given sequence, and earlier simulated events can influence the transition probability of the next event. The transition probabilities are conditional on earlier events. The MOSART model is a dynamic micro-simulation model since the population ages. A dynamic micro-micro-simulation model enables analysis of the life course of individuals. The whole population is included in the simulation.
Information about educational background is important to projections about the future labor supply. The MOSART model is used to produce projections of the labor supply by both educational level and field. The projections can be matched with corresponding projections for demand for labor, and imbalances in the future labor market can be detected. These kinds of analyses have been carried out since 1993 (Bjørnstad et al., 2010). Projections of the possibility of future imbalances in the labor market can also be used when planning the number of students in educational institutions in Norway.
3.2. Data and definitions
Administrative register data from Statistics Norway are used when updating the information on educational background. Movements into education are registered for all students aged 16 and older in Norway, as is the completion of educational activities. There are also data on the highest completed education, which are used together with the completion data to make sure that all educational attainment is registered.
Movements in and out of education have been registered by Statistics Norway since 1974. In this report, these data cover the period from 1974 to 2009. In addition, we have used data from the population censuses. In the censuses, people
are asked about their highest completed education, so that we also have educational data from before 1974. By combining this information with the register data, we obtain a detailed picture of the development in educational background throughout the period. Register data for highest completed education are updated in November every year. A census asking immigrants about their educational background was held in 2011, and this information has been used to provide a complete picture of the educational background of the population during the period.
Information about entrance into and completion of education is supplemented by information from the population censuses, which provides an improved picture of the educational background of the population. There are some problems, however, with the registration of time of completion in the population censuses. The year of completion is filled in with the census year if nothing else is reported. This means that the data show a higher propensity to complete education in years when a population census is held.
By using register data, we are able to create detailed educational classifications. For a more detailed classification of the level of education, a grade level variable was used in the MOSART model before the revision of data. Grade level was a variable that was updated once a year, and it resulted in a more detailed level of education than the NUS2000-code. However, the grade level variable is not consistent before and after the shift in the educational statistics in 1998, when the ISCED scheme was introduced.
Because of the discrepancy in the grade variable, a new approach to educational choices has been necessary in order to model educational behavior in the
MOSART model. We have used the information from the NUS2000 to aggregate educational groups into larger categories for both level and field that are consistent with the international standard classification of education.
The previous grade level variable made the simulation of educational choices and attainments easier, since we had a detailed description of the highest level of completed education. Students taking time off from their studies can be a problem in the new system if they have not completed any studies, and then complete them only a short time after returning. This is a path that is difficult to model
econometrically and it was easier to simulate using grade level. Today, we use time spent in education as a substitute for the grade level variable, together with the NUS2000-variable.
Before 1998, students were accredited for each grade level they completed in both upper secondary and tertiary education. This happened once a year for most studies. The harmonization of international educational standards from 1997 changed this. Students’ highest completed education is only updated after completing a degree, e.g., a high school certificate or bachelor’s or master’s degree. Since 1998, there are fewer registrations of completed education than before, and the aggregation of the educational field and level needs to take this into account to make the definitions of the education level consistent for those who completed their education before and after 1998.
High school students do not achieve any formal proficiency before they have completed the full course of upper secondary education. Those who have
completed part of their upper secondary education, but not in full, are aggregated together with those with no higher secondary education at all.
The ISCED standardization also made a difference to the registration of completed education in tertiary education. Under the new standard, education was only registered as completed if the education lasted for at least two years. For our analyses of educational behavior, the definitions need to be similar before and after 1998. All educational attainment is aggregated in larger groups, divided by both
field and level. Until 1998, only educational programs with a grade level of fourteen or higher are calculated as education on tertiary level, with the exception of some defined educational programs, that have had a varying grade level, such as nursing, engineering and a professional education in business and administration
(Siviløkonom). By aggregating education in this way, the number of students who
complete their education is fairly similar across the period. The number of persons in the educational groups is also similar, with an increasing trend.
When a study program is registered as lasting for three years instead of three times one year, the propensity to continue an educational activity will be higher. This is shown as a change in the education registered even though the behavior remains the same.
There are some difficulties when using registry data to determine people’s educational background and choices. People studying outside Norway are not registered as students unless their studies are part of a Norwegian study program or are financed through the Norwegian State Educational Loan Fund. Only about five percent of Norwegian students take their whole degree outside Norway, but the students are not randomly distributed over fields.
Table 3.1. Full-time students abroad in 2008-2009
Field Total Bachelor Master
Health and social services ... 4 153 1 121 3 032
Economics, law and social sciences ... 3 847 2 567 1 280
Humanities ... 1 929 1 557 372
Natural sciences and technology ... 1 310 963 347
Teaching ... 194 159 35
Others ... 324 310 14
Total ... 11 757 6 677 5 080
(Norwegian State Educational Loan Fund 2011)
Previously, all immigrants coming to Norway were assigned to the category unknown education (Fredriksen 1998). Some are registered in the Norwegian school system after coming to Norway and complete an education. Immigrants can have their education approved and registered upon application. The number of immigrants is expected to rise in the future, and thereby the number of persons with unknown education. A large survey was carried out in 2011 to improve our information about the educational background of immigrants in Norway (Statistics Norway, 2012b).
The register data include the date students enter education, as well as a code for the field and level of education, the NUS2000-code.4 We also have the date the
students complete their education, and what kind of education they complete, which is identified by the same NUS2000-code. The administrative registers also contain data on personal characteristics, such as gender and year of birth. It is possible to merge these data, which means that we have characteristics for each individual making educational choices.
There are about 4 000 000 observations for each year. We have chosen to estimate the regression coefficients using the period from 1999 to 2009. These are the most recent data available, and the same definitions of education have been in use throughout the period.
Even though we only use data from 1999 and onwards, the consistency of
definitions throughout the period remains important. A completed education can be from before 1999, and earlier educational attainment is one of the main explanatory variables in the modeling of educational choices in the MOSART model. A
4
The NUS2000-code is a detailed code defining the level and field of education, where corresponding fields exist for each level of education. It is possible to link the NUS2000-codes to the ISCED-level, defining an ISCED-level for every NUS2000-code.
consistent definition of educational background is important to ensure that the interpretation of educational background is independent of time of completion.
3.3. Educational transitions
In real life, people make different educational choices every semester, and students can change their field of study without difficulty. Paths to the same kind of
proficiency differ, which makes it more difficult to fit educational choices into a model. To carry out an econometrical analysis of their educational choices, we need a modeling framework where the population can make various choices and move in and out of education in a way that corresponds to reality.
This framework is created by looking at four different choices prospective students can make throughout their lives. The first is to enter education or not. Conditional on entering, the students will then choose level and field of their education. The next choice is whether or not to complete their studies in that particular year. If a student does not complete his or her education, he or she can choose whether or not to continue the ongoing education, or quit before completion.
Figure 3.1. Transitions in and out of the education system
People start making educational choices at the time they complete compulsory education, or, in the case of immigrants, at the time they arrive in Norway. The possible levels of education are general studies at upper secondary school, vocational studies at upper secondary school, folk high school,5 lower tertiary education or higher tertiary education. After choosing the level, they choose a field. There are different fields of education at the different levels, but some are similar to each other and some are extensions of the same fields at a lower level.
Individuals in education choose whether or not to complete their education, and, if they do not complete, they can either continue or go back to being outside
education. If they stay in education, the next choice in the model relating to completion and continuing is made in the spring one year after. For those outside education, the choice is made in the fall after their decision to leave education. The model is in discrete time. Thus reality must be adjusted to the model. The cycle then repeats itself until the person passes away. The population can go in and out of education throughout life, but the probability of starting an educational activity is drastically reduced after the age of 30.
5
Some students have their highest completed education updated without being registered as students. When projecting labor supply, it is essential to have a way of assigning the right persons an updated educational background without their being registered as students, since some occupational groups are overrepresented in relation to obtaining proficiency without being a student in advance.
Some of those who complete an education without being registered as students are people who have studied abroad without financial support from the Norwegian State Educational Loan Fund. They are not registered as students, but will have their new highest completed education registered when they complete the education. Another group consists of those who attain vocational proficiency through apprenticeships. One of the paths to vocational proficiency is to work as an apprentice for two years after two years of high school education. They will in many cases not be registered as students, but will have their education registered when they finish their apprenticeship. The third important group consists of immigrants who have their education from their home country registered after arriving in Norway.
3.4. Starting an educational activity
Those who are outside education and do not enter any kind of education will have the possibility each spring of having their educational attainment updated. The majority of those who have their educational attainment updated are people who have been registered as students at an earlier point in time without completing their education. Persons whose educational attainment is updated will have the
possibility to have their educational attainment updated in the field of study they were registered in but did not complete. If their educational attainment is not in that specific field, they are distributed across the other fields.
The proportion of women enrolling in education is higher than for men. This reflects the trend for Norwegian women to have a higher propensity to start in education than men. Traditionally, more men than women have been in education, but from around 1980, the proportion of women starting in education has been higher than for men.
3.5. Choice of level and field
Upper secondary educationSeven fields are specified at upper secondary level in the model, as presented in Table 3.2.2. There is one general program. The remaining six are vocational programs in economics and administration, electrical, mechanical and machine trades, building and construction, other fields of science and trades, healthcare, and other fields at the same level.
Table 3.2. Distribution of students starting upper secondary education by field. Percent
Field Women Men
General studies ... 48 5
Economics and administration ... 7 5
Electrical, mechanical, machine trades ... 2 26
Building and construction ... 1 14
Other fields of science and trades ... 16 11
Healthcare ... 19 3
Other ... 8 7
Men and women make different educational choices at upper secondary level, as seen in Table 3.2. General studies are by far the most common educational choice for both men and women, and the numbers of men and women entering upper secondary schooling are similar. The number of women choosing a general track high school education is higher than for men. More women choose the economics and administration programs, while men tend to choose electrical, mechanical and machine trades, and construction, i.e., the vocational courses, to a greater extent
than women. Few men choose courses in caregiving compared to women. In other fields of sciences and trades, there are more women than men. There seems to be a time trend for more men to enter courses in caregiving, a field traditionally
dominated by women.
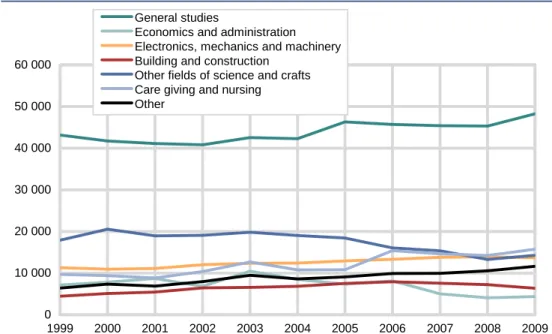
Figure 3.2. Enrollment in upper secondary education
0 10 000 20 000 30 000 40 000 50 000 60 000 1999 2000 2001 2002 2003 2004 2005 2006 2007 2008 2009 General studies
Economics and administration Electronics, mechanics and machinery Building and construction Other fields of science and crafts Care giving and nursing
Other
Figure 3.2 shows enrolment in the different fields of education at upper secondary level. The number of persons enrolling in general studies decreased until 2002, since when there has been a stepwise increase. This is mainly driven by cohort sizes. The number of students enrolling in economics and administration has decreased since 2003. There is a small but steady increase in the number of
students starting in the field of electrical, mechanical and machine trades. The same is the case for building and construction up until 2006, since when there has been a small reduction. The number of students enrolling in other fields of sciences and trades has decreased after 2005. The number of healthcare students saw a significant increase from 2005 to 2006, but was stable from 2006 to 2009. A decrease has been observed since 2009. For other fields of education at upper secondary level, there has also been an increase throughout the period.
Post-secondary, non-tertiary education
Table 3.3. Post secondary, non-tertiary education, total enrolment in different fields, 1999 to 2009. Numbers in 1000
Field Women Men Total
General studies ... 4 12 16
Economics and administration ... 5 2 7
Electrical, mechanical and machine trades... 1 16 17
Building and construction ... 0 7 7
Other fields of science and trades ... 8 8 16
Healthcare ... 5 1 6
Other ... 1 8 9
Total ... 23 53 76
Table 3.3 shows the number of men and women starting in the different fields of post-secondary, non-tertiary schooling. Post-secondary, non-tertiary education leads to qualifications for entering the labor market. There are often no admission requirements, and these educational programs are therefore an important extension of a high school education. The students in these educational programs have different backgrounds, and both people without any high school education and people with a completed high school education start in post-secondary, non-tertiary education.
There are more men than women in this kind of education, which is not surprising since men are overrepresented in vocational education. Post-secondary, non-tertiary education is an education typically taken after vocational training. More men than women have no formal education beyond compulsory education, which would give them an increased propensity to start in post-secondary, non-tertiary education. There are more women than men in programs in both economics and administration and caregiving. This is as expected, as these are fields traditionally dominated by women at upper secondary level.
Tertiary education
Tertiary education is a dual system that consists of university colleges offering professional studies and the universities, which mainly offer more theoretical subjects, but also some professional studies. Since 1998, completion of the second year of a study program has been necessary to have completed education registered at this level. Before 1998, it was only necessary to have completed some education at a level to have it registered. The same requirements are applied to educational attainment from before 1998 in the model in order to ensure a consistent definition of level of education. This level of education corresponds to level 5 on the ISCED scale. There is no distinction in the model between professional studies and more theoretical studies; the only subdivisions are between different fields. However, the fields may contain some information about which category the studies belong to. In some fields, most of the study programs are vocational, for example nursing. In others, they are more theoretical, for example natural science. The possible fields in the model are humanities and arts, education, social sciences, economics and administration, engineering, other fields of science, healthcare, other kinds of health and social services, and other tertiary education.
Table 3.4. Distribution of students starting lower tertiary education over different fields. Percent
Field Women Men
Humanities and arts ... 17 16
Education ... 19 10
Social sciences ... 11 11
Economics and administration ... 19 25
Engineering ... 1 9
Other fields of science ... 6 14
Nursing and caregiving ... 10 2
Other fields of health and social services ... 15 8
Other tertiary education ... 2 4
More women than men start in lower tertiary education. This can partly be explained by the fact that more men then women choose the vocational tracks at high school, and are thus ready to enter the labor market after completion. When they find relevant work, people are less likely to start an educational activity. There are several fields of study at this level that are heavily dominated by women, the most important being teacher training and a nursing education. Other health studies programs are also dominated by women.
Long tertiary education mostly comprises university studies at master’s level. The fields represented in our analyses are humanities and arts, education, social sciences, law, economics and administration, engineering, other fields of sciences, medicine, dental studies, other studies in health and social services, and other tertiary education at higher degree level. Some of the study programs combine lower tertiary and higher tertiary programs. They typically last for five or six years. Students in these study programs need to take them for the specified number of years. These programs have high requirements for continuous education. This is the case for, e. g., medicine, dental studies and most of the programs for graduate engineers. Both programs taken following a bachelor’s degree and programs with a duration of five years leading to a master’s degree are defined as long tertiary education. For the purpose of MOSART, all education at PhD level is excluded, and those who have a PhD level education are represented with the educational level and field they were registered with before their PhD.
Table 3.5. Distribution of students starting higher tertiary education by field. Percent
Field Women Men
Humanities and arts ... 12 9
Education ... 9 3
Social sciences ... 13 10
Law ... 5 11
Economics and administration ... 14 19
Engineering ... 6 21
Other fields of science ... 9 14
Medicine ... 5 4
Dental studies ... 1 1
Other fields of health and social studies ... 13 6
Other ... 2 3
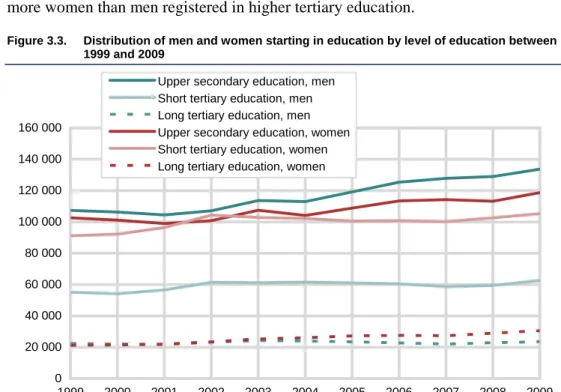
The gender differences in relation to choice of study programs are similar to what is seen in lower tertiary education, with men choosing engineering, science, and economics and administration to a greater extent than women. As we see from Figure 3.3, the increase in the number of women starting at this level of education is greater throughout the period than for men, and in 2009 there were significantly more women than men registered in higher tertiary education.
Figure 3.3. Distribution of men and women starting in education by level of education between 1999 and 2009 0 20 000 40 000 60 000 80 000 100 000 120 000 140 000 160 000 1999 2000 2001 2002 2003 2004 2005 2006 2007 2008 2009
Upper secondary education, men Short tertiary education, men Long tertiary education, men Upper secondary education, women Short tertiary education, women Long tertiary education, women
As discussed earlier, the number of women starting in lower tertiary education is relatively high compared to the number of men. This could reflect the fact that women complete high school to a greater extent than men. Men without high school proficiency will have a higher propensity to start on a high school education several times. The difference seems to be stable over the period. For students starting in higher tertiary education, there are more women than men from about 2002.
3.6. Educational attainment without being a student
Table 3.6 shows the proportion completing an education without being registered as a student. Those who are students complete an education after having been registered as students the year before, while those who are not students have not been registered in any educational activity. It is clear that there are big differences between the different fields of education in terms of how usual it is to attain proficiency without being a student.
Table 3.6. Updated educational attainment without being a student, 1999 to 2009. Percent of completed education in total
Upper secondary schooling
Economics and administration ... 19 Electrical, mechanical and machine trades ... 20 Building and construction ... 34 Other fields of science and trades ... 26 Healthcare ... 35 Other ... 36 General studies ... 8
Tertiary education, lower degree
Humanities, lower degree ... 10 Education, lower degree ... 68 Social sciences, lower degree
Economics and administration, lower degree ... 16 Engineering, lower degree ... 9 Other fields of science, lower degree ... 11 Nursing and caregiving, lower degree ... 6 Other fields of health, lower degree ... 7 Other tertiary education, lower degree ... 26
Tertiary education, higher degree
Humanities ... 16 Education ... 21 Social sciences ... 13 Law, higher degree ... 4 Economics and administration, higher degree ... 24 Graduate engineering ... 7 Other fields of science, higher degree ... 29 Medicine ... 21 Dental studies ... 18 Other fields of health, higher degree ... 20 Other tertiary education, higher degree ... 61
It is possible to obtain proficiency in different trades equivalent to upper secondary education by working for five years and having completed the general high school curriculum. This can explain the high proportion of those who attain vocational proficiency without being registered as a student, in addition to some of those taking a regular apprenticeship not being registered as students. The age of those obtaining proficiency without being registered as students is nine years older than for those completing education as registered students. It is therefore probable that at least some of these students obtain their proficiency by working in a relevant field.
Medicine, dental studies, and economics and administration are the most important courses for students taking their whole degree outside Norway. They are also the programs with the highest proportion of candidates obtaining their degree without being registered as students.
To be admitted to some educational programs, it is necessary to meet proficiency requirements and requirements relating to results from earlier education. There are no such restrictions in the MOSART model. All transitions are possible, even though there are prerequisites for most study programs. When estimating transition probabilities, some transition probabilities will be very low. The probability of making a transition with a certain educational background will be close to zero if very few people with that particular background have made the transition before. In the model, no one will make a transition that has not been made in reality, since the probabilities are calculated on the basis of real transition probabilities.
3.7. Comparison with official statistics
As the definitions of the educational categories differ somewhat from those used in the official statistics, a comparison of where the data differ is of interest. For the last cohorts, the level of educational attainment should be the same, but there are discrepancies for those who have a completed education from before 1998. There could also be differences between the numbers, because the MOSART model counts the population at a different time than the educational registers.
Figure 3.4. Number of students in upper secondary education by age, 2009 0 20 000 40 000 60 000 80 000 100 000 120 000 140 000 160 000 180 000 200 000 16-19 20-24 25-29 30-34 Age Official statistics MOSART model
Figure 3.4 shows the number of students in upper secondary education. The number of students in the MOSART model is very close to the official statistics. The small difference in the 20-24 age group is probably due to the timings of the MOSART model and the educational registers, as those between 20 and 24 are mobile across countries.
Figure 3.5. Number of students in tertiary education by age, 2009
0 5 000 10 000 15 000 20 000 25 000 20 21 22 23 24 25 26 27 28 29 Age Official statistics MOSART numbers
The number of students in tertiary education is presented in Figure 3.5. Also in this figure, the number of students is the same as in the official statistics. The small exceptions are due to differences in the time when the numbers are counted. The official statistics count everyone who is registered as a student when they start their education, whereas it is necessary to be a Norwegian resident to be counted in the MOSART numbers.
In Figure 3.6, the number of persons with compulsory education as their highest completed education is compared across age groups. For the young age groups, there should be no big differences in the numbers. The older age groups, however, may have completed their education before 1998, so a discrepancy is expected for those who are older than 30. Small differences are also expected in the other numbers, since registration of highest completed education is done in October in the official statistics, while the educational level of the population is registered at the end of the year in the MOSART model.
Figure 3.6. Persons with compulsory education, 2009 0 50 000 100 000 150 000 200 000 250 000 16-19 20-24 25-29 30-39 40-49 Age Official statistics MOSART-model
Figure 3.7 confirms that there are no differences in the number of persons with compulsory education as their highest education before the age of 30. In the MOSART data, there are a large number of persons with only compulsory education who have higher education in the official statistics. The MOSART data use more strict definitions for the older cohorts in order to make the definitions of educational levels comparable over time. This means that those who are registered with the kinds of education that were registered as, e.g., upper secondary education before 1998 will not have this as a completed education in the MOSART data. Instead, their former educational background is used, resulting in a higher number of people with compulsory education only.
Figure 3.7. Persons with upper secondary education, 2009
0 50 000 100 000 150 000 200 000 250 000 300 000 350 000 16-19 20-24 25-29 30-39 40-49 Age Official statistics MOSART-model
The number of persons with upper secondary education as their highest completed education is the same in the model and in the statistics for those under 30, as shown in Figure 3.7. For the older age groups, here represented by the age groups 30-39 and 40-49, there are more people in the official statistics than in the MOSART data with this level of education, which is what the choice of definitions is expected to produce.
Figure 3.8. Persons with short tertiary education, 2009 0 50 000 100 000 150 000 200 000 250 000 16-19 20-24 25-29 30-39 40-49 Age Official statistics MOSART-model
In the case of persons with a short tertiary education, there seems to be an even larger difference for the 30-39 and 40-49 age groups between the numbers from the MOSART data and the statistics. The statistics define more people as having a short tertiary education than the data used in the model. Up to the age of 30, the numbers are the same.
Figure 3.9. Persons with long tertiary education, 2009
0 10 000 20 000 30 000 40 000 50 000 60 000 70 000 80 000 90 000 100 000 16-19 20-24 25-29 30-39 40-49 Age Official statistics MOSART-model
For persons with a long tertiary education, the definitions from the MOSART data result in a higher number of people than the statistics. One particular business and administration education (Siviløkonom), which was registered in the registry of education as an education belonging to the short tertiary level before 1998, is defined in the model as belonging to the long tertiary level. After 1998, this education is defined as a long tertiary education, but the content is similar before and after 1998, and the labor market prospects are the same. The difference between the model data and the statistics are thus in the expected direction.
4. Econometric modeling
A number of conditions influence educational choices. Personal taste and interests could well be the most important factors, but they are both difficult to measure. Earlier educational decisions are an indication of personal taste and interests, and they are included in the model as explanatory variables.
In some cases, the explanatory variables could affect the transition probability differently for different subgroups, i.e., there could be interactions between the explanatory variables. In the MOSART case, the age effect could be different depending on educational background. The effect of having no completed
education after compulsory education is different at the age of 16 and the age of 30. The effect of time spent in education is very different for those who have
successful school careers behind them, and those who have not. The effect of time spent in education could also be different depending on the field and level of education.
To solve any problems concerning interaction of the explanatory variables, the estimation has been done separately for subgroups of the population. When estimating the transition probabilities separately, it is not necessary to assume that the explanatory variables affect the subgroups in the same way. Interaction dummies are also included to allow for interactions between the explanatory variables. I will use separate logistic regressions for each of the possible situations the persons can be in, and multinomial logit models when choosing level and fields of education.
Educational behavior differs between men and women, and the effect of age and educational background is not the same for both genders. In Norway, women are overrepresented in tertiary education, and there are substantial differences between the genders in some fields. The traditional female occupations are still dominated by women, and the same applies to the fields traditionally dominated by men. In addition, we believe that the different characteristics we control for have a different effect on men and women. The age profiles could be different as a result of some Norwegian men doing military service at the age of 19, and some of the women having children at about the same age as they make educational choices. Because of the differences in how the control variables affect men and women, the
transition probabilities are estimated separately for the genders. The estimates can then explain how a control variable influences the educational choices of each gender, and they are allowed to differ from each other.
4.1. Starting in education
Econometric modeling
The propensity to start an educational activity is estimated separately for the following subgroups, with no restrictions across estimations:
• Men with unknown education who did not attend any studies in the previous year
• Men with unknown education who attended studies in the previous year
• Women with unknown education who did not attend any studies in the previous year
• Women with unknown education who attended studies in the previous year
• Men who completed compulsory education the previous spring
• Men who attended studies in the previous year without any educational attainment
• Men who have spent time in education after compulsory education, but not in the last year