Guill, Karin; Lüdtke, Oliver; Köller, Olaf
Academic tracking is related to gains in students' intelligence over four years:
Evidence from a propensity score matching study
Learning and instruction 47 (2017) February 2017, S. 43-52
Empfohlene Zitierung/ Suggested Citation:
Guill, Karin; Lüdtke, Oliver; Köller, Olaf: Academic tracking is related to gains in students' intelligence
over four years: Evidence from a propensity score matching study - In: Learning and instruction 47
(2017) February 2017, S. 43-52 - URN: urn:nbn:de:0111-pedocs-126793 - DOI:
10.1016/j.learninstruc.2016.10.001
http://nbn-resolving.org/urn:nbn:de:0111-pedocs-126793 http://dx.doi.org/10.1016/j.learninstruc.2016.10.001
Nutzungsbedingungen Terms of use
Dieses Dokument steht unter folgender Creative Commons-Lizenz: http://creativecommons.org/licenses/by/4.0/deed.de - Sie dürfen das Werk bzw. den Inhalt vervielfältigen, verbreiten und öffentlich zugänglich machen sowie Abwandlungen und Bearbeitungen des Werkes bzw. Inhaltes anfertigen, solange Sie den Namen des Autors/Rechteinhabers in der von ihm festgelegten Weise nennen.
This document is published under following Creative Commons-License: http://creativecommons.org/licenses/by/4.0/deed.en - You may copy, distribute and render this document accessible, make adaptations of this work or its contents accessible to the public as long as you attribute the work in the manner specified by the author or licensor.
Mit der Verwendung dieses Dokuments erkennen Sie die Nutzungsbedingungen an.
By using this particular document, you accept the above-stated conditions of use.
Kontakt / Contact:
pe
DOCS
DIPF | Leibniz-Institut für Bildungsforschung und Bildungsinformation
Informationszentrum (IZ) Bildung
E-Mail: [email protected]
Internet: www.pedocs.de
Academic tracking is related to gains in students' intelligence over
four years: Evidence from a propensity score matching study
Karin Guill
a,*, Oliver Lüdtke
b, Olaf K
€
oller
aaLeibniz Institute for Science and Mathematics Education, Germany
bLeibniz Institute for Science and Mathematics Education, Centre for International Student Assessment, Germany
a r t i c l e i n f o
Article history:
Received 12 November 2015 Received in revised form 24 August 2016 Accepted 5 October 2016 Available online 28 October 2016
Keywords: School quality Tracking Ability grouping Intelligence Cognitive development
a b s t r a c t
Ability grouping or tracking during secondary schooling is widespread. Previous research shows aca-demic track schools are more successful than non-acaaca-demic track schools in teaching mathematics, reading and foreign languages. Reasons include a more favorable student composition and higher instructional quality. However, there is less evidence that between track differences are even large enough to differentially affect the students' cognitive development. We used data from a large Hamburg panel study to test this hypothesis (N¼8628). By employing several propensity score matching algo-rithms we formed parallelized samples of academic track and either non-academic track students or comprehensive school students. After four years of tracking, academic track students showed consid-erably higher intelligence scores than their counterparts at the non-academic tracks and slightly higher scores than students at the comprehensive schools. Our results underline the importance of a cognitively stimulating learning environment in school to support students' cognitive development.
©2016 The Authors. Published by Elsevier Ltd. This is an open access article under the CC BY license (http://creativecommons.org/licenses/by/4.0/).
1. Introduction
Some schools more effectively teach reading, mathematics and sciences than others. School effectiveness research mainly agrees with this statement (Reynolds et al., 2014). However, increasing students' general cognitive abilities is usually not an explicit goal of schooling (Adey, Csapo, Demetriou, Hautam €aki,&Shayer, 2007). Yet, the question arises whether school quality indicators not only result in different subject specific outcomes but also differentially affect students' general cognitive abilities. This question is relevant against the background of broad evidence regarding the meaning of intelligence for numerous factors of life quality such as educational success, employment status, higher income, better health, higher life expectancy, and enduring partnerships (Der, Batty, &Deary, 2009; Gottfredson, 2003; Wrulich et al., 2013). Therefore, and in light of an increasingly complex environment a closely related, albeit not identical construct, that is domain-general problem solving, has received a lot of attention from educational researchers to the point of its inclusion in the PISA 2012 cycle (Programme for
International Student Assessment;Greiff et al., 2014).
Most recently, to address the question of school quality effects on students' intelligence, Becker, Lüdtke, Trautwein, K€oller, and Baumert (2012) took advantage of structural features of the German school system: The explicit between-school tracking dur-ing secondary schooldur-ing in Germany goes along with significant advantages for the academic tracks in terms of teacher qualifi ca-tion, cognitively demanding instruction and student composition (Klusmann, Kunter, Trautwein, Lüdtke, & Baumert, 2008; Retelsdorf, Butler, Streblow,&Schiefele, 2010; Trautwein, Lüdtke, Marsh, K€oller,&Baumert, 2006) and resulted in a clear advance in psychometric intelligence scores for academic track students compared to a matched sample of non-academic track students. Our own study extends thefindings of Becker et al. in several di-rections: First, employing the German adaption of Cattell's Culture Fair Intelligence test (Cattell, 1960; Weiß, 1998), we use a more comprehensive instrument of psychometric intelligence. Second, the sample in our study is eight times larger and considerably more heterogeneous concerning student prior achievement and social background. Third, we not only use students from non-academic tracks but also students from non-tracked comprehensive schools as an additional and more challenging comparison group to the academic track students.
*Corresponding author. Leibniz Institute for Science and Mathematics Education (IPN), Olshausenstr. 62, D-24118 Kiel, Germany.
E-mail addresses: [email protected] (K. Guill), [email protected]
(O. Lüdtke),[email protected](O. K€oller).
Contents lists available atScienceDirect
Learning and Instruction
j o u r n a l h o m e p a g e : w w w . e l s e v i e r . c o m / l o c a t e / l e a r n i n s t r u c
http://dx.doi.org/10.1016/j.learninstruc.2016.10.001
0959-4752/©2016 The Authors. Published by Elsevier Ltd. This is an open access article under the CC BY license (http://creativecommons.org/licenses/by/4.0/).
1.1. Tracking and student achievement
Many school systems integrate some sort of grouping of stu-dents at least during secondary schooling based on the assumption that teaching is easier and more effective in homogenous groups (LeTendre, Hofer,&Shimizu, 2003). Grouping can take place within class, on a course-level (settingorstreaming) or on a school level (tracking). The placement of students often depends on their achievement (ability grouping,Trautwein et al., 2006). Differences between groups or tracks are expected for two main reasons, compositional effects and institutional effects (Maaz, Trautwein, Lüdtke, & Baumert, 2008). Compositional effects refer to the more favorable student composition at academic track schools. On average, students show higher achievement and higher cognitive abilities along with a more favorable social background. This allows for interactions between students which are more cognitively activating. Institutional effects refer to the fact that tracks differ in their pedagogical response to the different groups in terms of curricular foci, teacher qualification and instructional quality (Ireson&Hallam, 2001). Concerning the curriculum, in Germany, for example, academic track students are required to learn a second foreign language (Kultusministerkonferenz, 2006). In their lan-guage lessons they focus more on literature while in the non-academic track the focus is more on basic linguistic skills (Klieme et al., 2008). Academic teachers have greater content knowledge and greater pedagogical content knowledge. This results in cogni-tively more activating instruction, for example by encouraging students to discuss and validate different solution paths of a specific task instead of training one correct solution (Baumert et al., 2010; Klusmann et al., 2008; Retelsdorf et al., 2010).
Research on the effects of tracking has shown, that academic track students indeed reach a higher level of achievement than students on other, more vocationally-oriented tracks, even when controlling for intake differences between tracks. This effect is most pronounced for mathematics achievement (Becker, Lüdtke, Trautwein,&Baumert, 2006; Guill&Grohlich, 2013; Opdenakker€
& Van Damme, 2006), but can also be found for French (Neumann et al., 2007) as a foreign language. Findings for reading achievement are less consistent and if track differences exist, effect sizes are lower (Retelsdorf, Becker, K€oller,&Moller, 2012€ ). 1.2. Tracking and intelligence
Increasing students' general cognitive abilities is neither just another subject in school nor an explicit aim of systematic in-struction (for a criticism, seeAdey et al., 2007; similar for domain-general problem solvingGreiff et al., 2014).
When speaking of students' cognitive abilities or their intelli-gence we think of their„ability to understand complex ideas, to adapt effectively to the environment, to learn from experience, to engage in various forms of reasoning, to overcome obstacles by taking thought”(Neisser et al., 1996, p. 77). In some models, it is differentiated in a crystallized component, that is acquired abilities, and a fluid component, the capacity to analyze and solve novel problems independent of cultural experiences and acquired abili-ties (Cattell, 1963; Horn, 1994). There is also evidence thatfluid intelligence coincides with thegfactor, the common factor result-ing from factor analyses of broad ranges of intellectual tasks (Jensen, 2002). According to Cattell's Investment theory this is because at the beginning of an individual's development her or his fluid intelligence is invested in all kinds of complex learning tasks resulting in high correlations between acquired, crystallized abili-ties (Valentin Kvist&Gustafsson, 2008). From a developmental perspective following a Piagetian tradition,fluid intelligence is also modelled as developing through four reconceptualization cycles.
School-age children are either in the cycle of rule-based reasoning (6e11 years) or principle-based reasoning (11e18 years). Each cycle consists of two phases, the latter implying the full mastery of the thinking possibilities of the new cycle. Growth through these cycles is characterized by change in the nature of representations and their inferential interlinking (Christoforides, Spanoudis, &
Demetriou, 2016).
There is no doubt about substantial influence of the genetic disposition on an individual's intelligence (Plomin, 2003). However, we know from variousfields that a cognitively stimulating envi-ronment also has positive effects on individual cognitive abilities. This could e.g. be shown for challenging work environments (Schooler, Mulatu, & Oates, 1999), memory training programs (Jaeggi, Buschkuehl, Jonides, & Perrig, 2008), music practice (Schellenberg, 2006) and direct or content-based training programs (Adey et al., 2007). Last but not least there is strong evidence regarding the impact of quantity of schooling on students' intelli-gence. AsCeci (1991) documented especially when using natural experiments, every year of schooling brings with it substantial IQ score gains of 2e6 points. However, it remains unclear whether school quality differences are substantial enough to affect the students' general cognitive abilities differentially. In tracked school systems the compositional and institutional effects described above, consistently work across all academic subjects. Concerning compositional effects following Vygotski's concept of mediated learning experiencesthe interaction with peers being slightly ahead in terms of cognitive functioning should stimulate learning pro-cesses (Adey et al., 2007) and these peers are more likely to be found at the academic tracks. Concerning institutional effects across all subjects there is more stimulation of advanced reflection at the academic tracks e.g. when learning to identify the common structure of a drama in different plays or when learning the re-quirements of valid mathematical proofs. It is known from content specific training programs that they transfer to the students'fluid intelligence and can either improve the students' efficiency of reasoning on a given developmental cycle (Papageorgiou, Christou, Spanoudis,&Demetriou, 2016) or accelerate the transition to the following cycle (Christoforides et al., 2016). In sum, because of the more activating environment in academic tracks one might expect a positive influence of academic tracks on their students' intelligence.
Until now, the effect of tracking on students' intelligence development has been investigated several times. Findings from Swedish (e.g.Balke-Aurell, 1982; H€arnqvist, 1968), Israeli (Shavit&
Featherman, 1988) and US American studies (Rosenbaum, 1975) during the last decades show consistently higher intelligence scores for students on academically oriented tracks compared to students on vocationally oriented tracks. Cliffordson and Gustafsson (2008)could demonstrate advantages for different ac-ademic profiles (social sciences vs. technical) on the respective components of an intelligence test. All of these studies found sys-tematic differences in the social and cognitive composition of the students at the onset of tracking. They usually controlled for at least some of these intake differences using standard least-square regression analyses. However, they all have been criticized either for controlling only a few variables and potentially failing to control all the selection bias or for relying on regression analyses without fulfilling its preconditions, e.g. by extrapolating results for subjects without comparable individuals in the control group (Becker et al., 2012; Brody, 1992).
In their study,Becker et al. (2012)made considerable efforts to overcome these disadvantages. In Germany, after primary school students continue on different formal educational tracks, these being either vocational (further: non-academic track) or academic. In the Becker et al. study tracking started after six years of primary
schooling. Previous research has shown that placement into the different tracks is highly predictable by students' prior academic achievement and their social background (e.g.,Maaz et al., 2008; Pietsch & Stubbe, 2007). Becker et al. (2012) used propensity score matching (PSM) as a pre-processing method to address the systematic intake differences. PSM basically consists of matching individuals based on their probability (conditional on the cova-riates) to get the treatment in question (see methods for further details). This way they were able to parallelize the academic and non-academic track students on numerous covariates, including pre-tracking intelligence scores, test achievement scores, grades, and social background indicators. As an indicator for students' psychometric intelligence they used the 25-items Figure Analogies subscale of a slightly adapted German version of Thorndike's Cognitive Abilities Test (KFT 4e13þ;Heller, Gaedike,&Weinl€ader, 1985; Thorndike&Hagen, 1971). The PSM analysis revealed that after four years of tracking academic track students showed significantly higher mean intelligence scores with an average effect size ofd¼0.46. While the methodological approach of Becker et al. overcomes some of the shortcomings of earlier studies their rather limited and homogenous sample has some limitations addressed in the present study.
1.3. This study
The present study adds to the work on effects of academic tracking on students' psychometric intelligence by replicating and also extending their findings in several meaningful directions. WhileBecker et al.'s (2012)findings rely on only one subscale of a test battery; in our study subjects did all four subtests of the German adaption ofCattell’s (1960)Culture Fair Intelligence Test (CFT 20,Weiß, 1998). As the Figure Analogies these subtests load on an inductive reasoning factor and a higher order general factor (Carroll, 1993). The CFT 20 is a more comprehensive instrument of psychometric intelligence but similarly as the Figure Analogies constructed of material not directly covered in school.
LikeBecker et al. (2012)we investigate the effect of academic tracking within the German school system. We analyze the effects of academic tracking after an equal time span of four years allowing a direct comparison of the results.
As tracking started two years earlier in our sample from the federal state of Hamburg, we extendBecker et al.'s (2012)finding to students two years younger at the onset of tracking. This enables us to integrate all students in the compulsory school system in our analyses while Becker et al. lost those students who graduated from the least demanding track (as required) at the end of grade 9. Sit-uated in a metropolitan area and including a large number of stu-dents with an immigrant background our sample is much more heterogeneous than the Becker et al. sample with few immigrants. As the qualitative differences between the tracks apply for our study as well, in line with Becker et al. we expect tofind larger intelligence score gains in the academic track compared to the non-academic track(Hypothesis 1).
A specific feature of the Hamburg school system allows us a further extension. Besides the tracked school system, Hamburg offers comprehensive schools. Here, the career paths of the stu-dents are less pre-determined and stustu-dents are prepared for later vocational or academic orientation in shared classrooms. Only in some subjects like mathematics and English within-school streaming takes place starting not earlier than in grade 7. Comprehensive schools are therefore rather similar to secondary schools in non-tracked school systems. The staff consists of teach-ers qualified for academic-track schools and those qualified for non-academic track schools. Comprehensive schools usually attract more academically orientated students (Beh€orde für Schule und
Berufsbildung, 2011), although substantially less than the purely academic tracks. Given that comprehensive schools still have less favorable institutional and compositional characteristics than aca-demic track schools we expect tofind larger intelligence score gains in the academic tracks than in the comprehensive schools, even if the difference in intelligence score gains between academic track students and comprehensive school students might be smaller than between academic and non-academic track students(Hypothesis 2).
2. Method 2.1. Sample
The data came from the Hamburg school achievement study
“Aspects of learning background and learning development”
(abbreviated LAU for its German name; Beh€orde für Schule und Berufsbildung, 2011). The study started in September 1996 with the complete cohort of grade 5 students (LAU 5) at the onset of secondary schooling, continued in September 1998 with the cohort of grade 7 students (LAU 7) and in September 2000 with the grade 9 students (LAU 9). Intelligence was measured in LAU 5 and in LAU 9. This enabled us to examine the development of intelligence scores over a period of four years for all those students with a normal school carrier (e.g., without retention).
All LAU tests and questionnaires were administered on two respectively four consecutive days (LAU 5/LAU 9) and altogether took two school lessons (a 45 min) each day. They were adminis-tered by trained administrators. Participation in the achievement tests was obligatory while participation in the intelligence tests in grade 9 and in the student und parent questionnaires required parental permission. About 13,000 students participated at each measurement point.
Our analytic sample was limited to those students who took part in the LAU 5 and the LAU 9 assessment. This was true for 9864 of the 13,026 LAU 5 students (75.7%). Furthermore, we excluded those students who changed their track during this time period (between LAU 5 and LAU 9). This resulted in a total drop-out rate of 33.7% and an analytic sample of 8628 students. Drop-out rates differed be-tween the tracks. While the academic track had a nearly-average drop-out rate of 34.9% it was considerably higher in the non-academic tracks (41.5%) and much smaller for the comprehensive school students (24.8%). Besides track changes the drop-out was attributable to grade repetition, premature end of the school career and family relocation out of the Hamburg area. Track changes mainly took place between academic and non-academic tracks. Descents from the academic to the non-academic track were four times more frequent than ascents in the opposite direction. Pre-mature school ending was found more often in the non-academic tracks and grade repetition rates vary systematically between the tracks in favor of comprehensive school students and to a lesser extent of academic track students (Prenzel, Zimmer, Drechsel, Heidemeier,&Draxler, 2005). On average, the drop-out students showed lower test achievement results and a less favorable social background than the longitudinal students (see Table A.1 in the online supplemental material for detailed descriptive analyses).
In the analytic sample 3545 students attended the academic track (41.1%), 2168 the non-academic track (25.1%) and 2915 comprehensive schools (33.8%). The students came from 183 different schools. Girls were with 49.8% slightly underrepresented. 23.1% of the students also spoke a language other than German at home, reflecting the high immigrant proportion in Germany's larger cities.
2.2. Instruments
Dependent variable. The short form of the“Grundintelligenztest Skala 2eCFT 20”(Weiß, 1998) was used as a measure of the stu-dents' intelligence. This is the German adaption ofCattell's (1960)
“Culture Fair Intelligence TesteScale 2”. The CFT 20 is intended as a measure of fluid intelligence. It consists of four subtests, namely series (12 items), classification (14 items), matrices (12 items) and topologies (8 items). Each subtest is highly speeded, taking between 3 and 4 min each. The whole test with instructions takes about 35 min. Each subtest containsfigural stimuli and stu-dents have to choose one offive answer options (multiple-choice format) according to rules derived from the givenfigures. Usually, only the sum score over all subtests is interpreted. The test comes in two versions identical in content and differing only in item sequence within the subtests to hinder students from copying from their neighbor. The same test material was administered at T1 (Grade 5) and T2 (Grade 9). The reliability as measured by Cron-bach's
a
wasa
¼.82 at T1 (Behorde für Schule und Berufsbildung,€ 2011) anda
¼.84 at T2. The four-year retest stability in our sample was satisfactory withr¼.57. The manual of the CFT 20 (Weiß, 1998) reports an internal (split-half) consistency ofrtt¼.90 (short form)and the two-week retest reliability asrtt¼.77 for the complete test.
Control variables. PSM should include those variables predicting the students' assignment to the treatment conditions, that is the different tracks, as well as confounder variables that are associated with the treatment as well as the outcome measure. First, we used all available achievement measures at T1 to control for potential selection biases. The list of measures included the students' reading, language (grammar and vocabulary), orthography and mathematics score from the achievement test battery KS HAM 4/5 in Grade 5 (Mietzel &Willenberg, 1996). Their reliability scores were between
a
¼ .85 anda
¼ .90 (Behorde für Schule und€ Berufsbildung, 2011).Additionally, we used the students' grades at the end of primary schooling as achievement indicators. They covered the subjects German, mathematics, social studies and sciences, music and art. The primary school teachers gave recommendations whether be-sides comprehensive schools academic tracks or non-academic tracks were most appropriate for the individual student. Grades and primary school recommendation are the most important pre-dictors of track choice in Germany, followed by social background indicators (Maaz et al., 2008). Grades ranged from 1 (very good) to 6 (fail) and were reverse coded with higher values representing better grades.
Students' academic self-concept was measured by an 11-item scale, rating statements like “I have no trouble to understand complex relationships at once” on a four point rating scale with higher scores indicating a more positive self-concept (
a
¼.87;Beh€orde für Schule und Berufsbildung, 2011).
Parents reported their highest school leaving certificate and their highest post-secondary school degree. This information was combined to form two dummy variables indicating whether at least one parentfinished the academic track successfully and whether at least one parent has a university degree. We further used parents' reports about cultural belongings such as number of books at home as indicators of cultural capital (Bourdieu, 1977). Migration back-ground was coded if the parents mentioned speaking an additional language to German at home. Additionally, the students' age and gender were used as control variables.
2.3. Treatment of missing values
Due to the obligatory student participation the missing data rate for the LAU 5 achievement and intelligence tests was only 5.8%.
However, for additional information provided by students, parents and teachers in LAU 5 the proportion of missing values was about 23.3%. The missing data rate for the LAU 9 intelligence test was 20.8%.
Multiple imputation is currently considered the preferable approach to deal with missing data to avoid biased parameter es-timates (Schafer&Graham, 2002). All covariates in the propensity score model, the outcome variable and some additional correlated variables (i.e., auxiliary variables) were included in the imputation model. Due to their low proportion of missing values (on average below 7%) we used LAU 7 and LAU 9 achievement test scores (En-glish, reading and mathematics) and grades for imputing missing values of the LAU 9 intelligence test. However, we used no variable affected by the treatment to impute pretreatment variables (Langenski€old&Rubin, 2008). To account for the clustered data structure class means of grade 5 intelligence scores were included in the imputation model.
We used the multiple imputation by chained equations method (van Buuren&Groothuis-Oudshoorn, 2011) which is implemented in the package mice 2.22 in the R environment (R 3.1.3,R Core team, 2015). Trace plots indicated a successful convergence of the algo-rithm for the means and variance of the imputed variables. In total, we imputed 10 data sets which were further analyzed separately. All parameter estimates and standard errors were combined by
Rubin's (1987)rules.
2.4. Propensity score matching
Propensity score matching was used as a pre-processing strat-egy to control for systematic differences between the tracks on a large set of covariates (Ho, Imai, King,&Stuart, 2007). In afirst step, the probability of attending an academic track was estimated (i.e., propensity score) for each student by using logistic regression an-alyses. In the next step we matched students which were similar on their propensity scores from different tracks to create samples of students which were balanced on all covariates. For the matching procedures we used the software package MatchIt 2.4e21 byHo, Imai, King, and Stuart (2011).
Following the recommendation to use different matching techniques to test stability and robustness of thefindings (Morgan
&Winship, 2015) we used four matching algorithms: (a) nearest-neighbor matching without replacement and a ratio of 1:1 (i.e., each academic track student is matched to exactly one student from the comparison group). Matched pairs did not have to be identical on their propensity score but we allowed for small dif-ferences, the so called caliper, of c ¼ 0.1; (b) nearest-neighbor matching without replacement,1a caliper of c¼0.1 and a ratio of 1:5 (i.e., allowing up to 5 available students from the comparison groups to be matched to one academic track student); (c) nearest-neighbor matching without replacement, a caliper of c¼0.1 and a ratio of 5:1 (i.e., allowing up to 5 available students from the aca-demic track to be matched to 1 student from the comparison group); and (d) full matching discarding students outside the area of common support (ACS) which is the region of overlap between the propensity score distributions of treatment and control in-dividuals. Here, all students within the ACS were included. We restricted the minimum ratio of students from the comparison groups to academic track students to be permitted within a matched set to 0.025 to prevent an extremely high weighting of a
1 1:k-matching with replacement is the more common technique but in our case resulted in extremely high weightings (sometimes up to 400 times of some in-dividuals) and an insufficient reduction of selection bias and was therefore not further used.
small number of cases (Stuart&Green, 2008).
Matching was performed twice, once for the academic track students compared to the non-academic track students and once for the academic track students compared to the comprehensive school students.
We screened all matched samples for balance on simple covar-iate comparisons, quadratic and interaction terms. We report standardized mean differences and variance ratios as indicators of remaining differences in the matched samples which are inde-pendent on the sample size (Stuart, 2010). Concerning the analysis of the treatment effect we chose regression analyses to control for all covariates of the propensity score model as a double-robust check (Ho et al., 2007). The type ¼ complex analysis option of Mplus 7.3 (Muthen&Muthen, 2008e2014) was used to account for the nested structure of the data.
3. Results
We present our results in three steps. First, we describe the areas of common support between the academic track sample and both comparison groups. Second, we describe to which extent the matching algorithms succeeded in removing differences in the covariates' distributions. Third, we present the effect of academic tracking on students' intelligence scores.
3.1. Area of common support
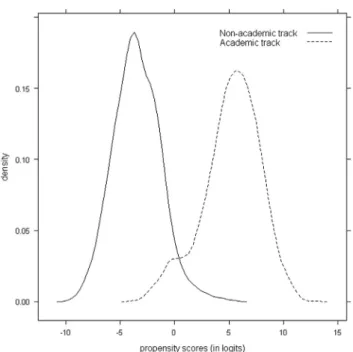
Figs. 1 and 2illustrate the distributions of the propensity scores of attending the academic track for academic track, non-academic track and comprehensive school students. The propensity scores were transformed to logits to normalize the skewed distributions in both groups. As expected, the academic track students showed a higher propensity of attending an academic track (given the cova-riates of the estimation model) than either the non-academic track students (Fig. 1) or the comprehensive school students (Fig. 2). However, for both comparisons there was a substantial overlap of the distributions. Of the academic-track students 49.4% (N¼1754) had a potential matching partner and 77.7% of the non-academic
track students (N¼1684) could serve as their matching partners. The area of common support was even larger for academic track students compared to comprehensive school students (seeFig. 2). With 95.2% nearly all academic track students (N¼3377) had a potential matching partner and 84.1% (N¼2452) of the compre-hensive school students could serve as their potential match. 3.2. Sample differences before and after propensity score matching
Table 1illustrates sample differences before matching. The ac-ademic track students were a positively selected group. They had higher pre-treatment intelligence scores, higher test achievement scores, better grades, more primary school recommendations for the academic track and a more favorable social background than the other groups. Differences between academic track students and either comprehensive school students or non-academic track stu-dents showed the same pattern on nearly all covariates. The ab-solute values of the differences were smaller between academic track and comprehensive school students than between academic track and non-academic track students.
In Table 2 we present sample differences after 1:1 nearest-neighbor matching of academic track and non-academic track students as an example of the effects of matching on group dif-ferences. No mean difference reached statistical significance. Standardized mean differences were in all cases belowd¼0.1 with only a minimal positive tendency in favor of academic track stu-dents remaining. The pattern was the same after 1:5- and 5:1-nearest neighbor matching. After full matching, the remaining group differences were a little larger, but with the exception of one case (Number of books at home,d¼0.27) still below the criterion of d¼0.25 for acceptable group differences after matching (Stuart, 2010). The balance diagnostics of the academic track-to-comprehensive school matching yielded to similar results. We present detailed balance statistics for all simple covariates for each group comparison and each matching algorithm in the online supplemental material (seeTables A.4 to A.10). A screening of the quadratic and interaction terms supported the overall impression of good balance between the groups (see Table A.11for details).
Fig. 1.Propensity score plot for academic track and non-academic track students (in logits; combined over imputations).
Fig. 2.Propensity score plot for academic track and comprehensive school students (in logits; combined over imputations).
Table 3demonstrates the differential efficiency described for the various matching algorithms (Stuart, 2010). Sample sizes were smallest for 1:1-nearest neighbor matching, increased for the ratio-matchings and were largest for full matching.
3.3. Effects of academic tracking
After four years of tracking academic track students' intelligence score was significantly higher than the mean intelligence score of the matched group of non-academic track students. Using the standard deviation of the academic track sample before matching,
Table 1
Univariatefindings before matching for covariates at the beginning of grade 5 (N¼8628).
Construct AT (N¼3545) Non-AT (N¼2168) CS (N¼2915) M SE SD M SE SD d M SE SD d Propensity Score 0.94 0.01 0.18 0.11 0.01 0.19 4.63 0.19 0.01 0.26 3.06 CFT 20 (intelligence) 0.47 0.02 0.82 0.39 0.03 0.96 1.04 0.31 0.04 0.99 0.94 Mathematics achievement 0.61 0.03 0.81 0.52 0.04 0.85 1.38 0.42 0.04 0.89 1.26 Reading achievement 0.63 0.02 0.63 0.58 0.04 0.92 1.91 0.37 0.05 0.98 1.58 German language achievement 0.65 0.03 0.74 0.65 0.04 0.82 1.76 0.38 0.06 0.91 1.40 Orthography achievement 0.62 0.03 1.01 0.52 0.02 0.64 1.13 0.44 0.03 0.75 1.05 Mathematics grade 0.70 0.01 0.64 0.63 0.03 0.89 2.08 0.38 0.02 0.90 1.69 German grade 0.69 0.02 0.54 0.62 0.02 0.64 2.42 0.35 0.02 0.68 1.91 Social studies and Science grade 0.59 0.02 0.56 0.53 0.03 0.70 1.99 0.28 0.03 0.73 1.54 Art grade 0.40 0.02 0.90 0.38 0.03 0.96 0.87 0.18 0.03 0.98 0.64 Music grade 0.51 0.03 0.83 0.47 0.03 0.95 1.17 0.26 0.02 0.95 0.93 Primary school recommendation (AT¼1/Non-AT¼0) 0.88 0.01 0.33 0.02 0.00 0.14 2.62 0.12 0.01 0.32 2.32
Age 0.29 0.02 0.77 0.31 0.03 1.11 0.77 0.12 0.03 1.06 0.52
Sex (1¼male/0¼female) 0.47 0.01 0.50 0.52 0.01 0.50 0.10 0.53 0.01 0.50 0.11 Academic self-concept 0.25 0.02 0.93 0.21 0.03 0.98 0.50 0.22 0.04 1.03 0.51 At least one parent qualified for university (1¼yes/0¼no) 0.60 0.02 0.49 0.11 0.01 0.31 1.00 0.23 0.02 0.42 0.77 At least one parent holds a university degree (1¼yes/0¼no) 0.50 0.02 0.50 0.06 0.01 0.23 0.87 0.15 0.01 0.36 0.69 Non-German language at home (1¼yes/0¼no) 0.18 0.01 0.38 0.34 0.02 0.47 0.42 0.28 0.02 0.45 0.28 Number of books at home 0.47 0.03 0.80 0.69 0.04 0.90 1.46 0.34 0.06 0.98 1.02 Child owns books (1¼yes/0¼no) 0.98 0.00 0.13 0.88 0.01 0.33 0.80 0.92 0.01 0.27 0.46 Child owns a dictionary (1¼yes/0¼no) 0.94 0.01 0.25 0.69 0.02 0.46 1.00 0.78 0.02 0.42 0.65 Child owns a desk (1¼yes/0¼no) 0.95 0.00 0.21 0.78 0.01 0.41 0.82 0.81 0.02 0.39 0.66
Note. Grades reverse coded, from 1¼failto 6¼very good.AT¼academic track. Non-AT¼non-academic track. CS¼comprehensive school. Continuous variables werez
standardized. Cohen'sdis computed relative to the AT and with theSDof the academic track sample before matching.
Table 2
Univariatefindings after 1:1 matching of academic track and non-academic track students for covariates at the beginning of grade 5 (N¼638).
Construct AT (N¼319) Non-AT (N¼319) d t p VR M SE SD M SE SD Propensity Score 0.47 0.02 0.29 0.46 0.02 0.29 0.05 0.33 .74 1.02 CFT 20 (intelligence) 0.11 0.06 0.85 0.09 0.06 0.85 0.03 0.25 .80 0.99 Mathematics achievement 0.10 0.06 0.84 0.07 0.06 0.81 0.04 0.37 .71 1.07 Reading achievement 0.15 0.06 0.83 0.12 0.06 0.79 0.06 0.45 .65 1.11 German language achievement 0.04 0.07 0.87 0.01 0.06 0.79 0.04 0.36 .72 1.21 Orthography achievement 0.02 0.06 0.80 0.06 0.05 0.77 0.04 0.54 .59 1.08 Mathematics grade 0.10 0.06 0.70 0.07 0.06 0.74 0.04 0.34 .73 0.90 German grade 0.03 0.04 0.52 0.01 0.04 0.55 0.08 0.86 .39 0.89 Social studies and Science grade 0.04 0.04 0.56 0.03 0.05 0.57 0.03 0.28 .78 0.97
Art grade 0.01 0.06 0.99 0.00 0.07 0.89 0.01 0.07 .94 1.25
Music grade 0.03 0.07 0.88 0.04 0.07 0.85 0.01 0.05 .96 1.08 Primary school recommendation (AT¼1/Non-AT¼0) 0.17 0.03 0.37 0.15 0.02 0.35 0.06 0.49 .62 1.10
Age 0.10 0.06 0.91 0.09 0.06 0.87 0.00 0.02 .98 1.09
Sex (1¼male/0¼female) 0.48 0.03 0.50 0.47 0.03 0.50 0.02 0.27 .79 1.00 Academic self-concept 0.02 0.06 0.97 0.04 0.06 0.95 0.02 0.23 .82 1.06 At least one parent qualified for university (1¼yes/0¼no) 0.34 0.03 0.47 0.30 0.03 0.46 0.08 0.83 .41 1.06 At least one parent holds a university degree (1¼yes/0¼no) 0.23 0.03 0.42 0.19 0.03 0.39 0.09 1.03 .30 1.16 Non-German language at home (1¼yes/0¼no) 0.27 0.03 0.44 0.28 0.04 0.45 0.02 0.16 .88 0.98 Number of books at home 0.07 0.07 0.93 0.12 0.07 0.92 0.06 0.48 .63 1.04 Child owns books (1¼yes/0¼no) 0.97 0.01 0.18 0.97 0.01 0.18 0.01 0.06 .95 1.03 Child owns a dictionary (1¼yes/0¼no) 0.86 0.03 0.34 0.86 0.02 0.35 0.03 0.19 .85 0.96 Child owns a desk (1¼yes/0¼no) 0.90 0.02 0.30 0.90 0.02 0.30 0.00 0.00 1.00 1.00
Note. Grades reverse coded, from 1¼failto 6¼very good.AT¼academic track. Non-AT¼non-academic track. Continuous variables werezstandardized. Cohen'sdis computed relative toSDof the academic track sample before matching. VR¼variance ratio, Var(Non-AT)/Var(AT).
Table 3
Sample sizes after matching with different algorithms (averaged over imputations, sample sizes for every data set see online supplemental material,Tables A.2 and A.3).
AT vs. Non-AT AT vs. CS
N(AT) N(Non-AT) N(AT) N(CS) Before Matching 3545 2168 3545 2915 After 1:1 Nearest-neighbor matching 319 319 706 706 After 1:5 Nearest-neighbor matching 319 721 704 1388 After 5:1 Nearest-neighbor matching 600 319 1857 705 After Full matching 1754 1684 3377 2452
Note. AT¼academic track. Non-AT¼non-academic track. CS¼comprehensive school.
the effect size wasd¼0.40. The effect size was remarkable constant over all four matching algorithms (seeTable 4). Academic track students also reached significantly higher intelligence test scores than their matched counterparts in the comprehensive schools. However, the effect was smaller and varied betweend¼0.28 for the variations of nearest-neighbor matching andd¼0.17 for full matching.
The interpretation of the effect size estimates from PSM ana-lyses relies on the assumption that there are no unmeasured confounder variables. Therefore, we conducted sensitivity analyses to test the robustness of our effects (VanderWeele&Arah, 2011). Concerning the effect of academic tracks compared to non-academic tracks of about 0.4 SD, a possible unobserved confounder with a moderate (small/large) effect size of 0.3 (0.1/0.5) would have to differ about 1.3SD(3.9/0.8) between treatment and control group (after controlling for all observed covariates) to eliminate the effect of academic tracking on students' intelligence (0.4/0.3 ¼ 1.3). Concerning the effect of academic tracking compared to comprehensive schools of 0.17e0.28 (depending on the matching algorithm), a possible unobserved confounder with a moderate (small/large) effect size would have to differ about 0.6e0.9 SD(1.7e2.8/0.3 to 0.6) between treatment and control group (after controlling for all observed covariates) to eliminate the effect of academic tracking on students' intelligence.
4. Discussion
The results of our analyses are in line with our hypotheses: Students on academic tracks show greater intelligence score gains than students on other tracks. On a descriptive level, this effect was most pronounced compared to non-academic track students but also present compared to comprehensive school students.
While the direction of the effect supports thefindings ofBecker et al. (2012)and underlines the reliability of the effect of academic tracking on students' intelligence (seeSimons, 2014, for the value of direct replication), the effect sizes we found were lower. Becker et al. reported an average effect size of d ¼0.46, while it was d ¼ 0.40 for academic track students compared to the non-academic track students in our study. When using the standard deviation of the control group as a reference like Becker et al. did, it even reduced tod¼0.31. A possible reason for this difference might be the younger age of our sample at the onset of tracking (grade 5 vs. grade 7 students in Becker et al.’s sample). In the German school system grade 5 and 6 are conceptualized as an observation stage (Kultusministerkonferenz, 2006). Changes between the tracks are to be simplified. This might reduce those curricular and instruc-tional differences which contribute to the differential development of students' intelligence. For example, academic track students do not start to learn a second foreign language before 7th grade.
The smaller differences between academic track students and comprehensive school students compared to non-academic track
students are descriptive and in line with the more favorable insti-tutional and compositional characteristics of comprehensive schools compared to non-academic track schools. Therefore, a direct comparison of comprehensive school students and non-academic track students in the full range of their area of common support would be an interesting topic for future research. 4.1. Strengths and limitations
Our study has several strengths: The results are based on a large and heterogeneous sample of one of Germany's metropolitan areas. Using the CFT 20 (Cattell, 1960; Weiß, 1998) we employed a rather broad measure of intelligence. Employing PSM as a pre-processing method we made a substantial effort to eliminate potential con-founders of the tracking effect. These measures contribute to the validity of ourfindings.
There are some limitations of our study, too: Our results apply only to those students with a normal school career without grade repetition or track changes. It would be interesting to investigate in future research whether students who descend from an academic track to the cognitively less activating environment of a non-academic track hold or lose their advantage in terms of intelli-gence scoreseand vice versa if students ascending to the academic track can catch up with their peers who were in the academic track from the onset of tracking. However, such a research question would require an additional assessment of intelligence at the moment when students change their track.
Given the CFT 20 is not constructed to differ between devel-opmental cycles it remains open to future research whether the students at the academic track acquired new thinking possibilities or whether they became more efficient in dealing with problems on their developmental level (Christoforides et al., 2016). Given the age span of our sample from about 10 to 15 years both seems possible.
Furthermore, our results are limited to those students in the area of common support. Effects of academic tracking are not testable for the non-academic track students at the lower end or the academic track students at the upper end of the propensity score distribution. There are no students to compare these students to. This limitation is less pronounced for the academic track/ comprehensive school comparison where the overlap of the dis-tributions is much broader.
Propensity score matching relies both on the assumption that there are no unmeasured confounders of the treatment effect and that the covariates are measured without error. With regard to measurement error, if the grade 5 intelligence is not perfectly measured, for example, we would overestimate the effect of aca-demic tracking because unreliable intelligence scores result in an underadjustment for preexisting differences in the mean between non-academic track (or comprehensive school) and academic track students (for an illustration seeMaxwell&Delaney, 2004, p. 427).
Table 4
Regression of students' intelligence scores (CFT 20) at the beginning of Grade 9 on academic tracking in different matched samples controlling for all covariates at the beginning of Grade 5.
Algorithm AT compared to Non-AT AT compared to CS
b(AT) SE d p b(AT) SE d p
1:1 Nearest-neighbor matching 1.91 0.45 0.40 <.01 1.33 0.33 0.28 <.01 1:5 Nearest-neighbor matching 1.88 0.41 0.39 <.01 1.31 0.33 0.27 <.01 5:1 Nearest-neighbor matching 1.83 0.44 0.38 <.01 1.32 0.33 0.27 <.01
Full matching 1.96 0.76 0.40 <.05 0.82 0.41 0.17 <.05
Note. AT¼academic track. Non-AT¼non-academic track. CS¼comprehensive school. Cohen'sdis computed relative toSDof the academic track sample before matching.
This biasing impact of fallible covariates on the estimated treat-ment effect is also known as regression to the mean effect in the literature (Althauser&Rubin, 1971). Following a formula proposed byAlthauser and Rubin (1971)and assuming a reliability of .80, we estimated that up to 36% of the effect of academic tracks compared to comprehensive schools and 26% of the effect of academic tracks compared to non-academic tracks might be due to measurement error of the grade 5 intelligence scores.2However, we would also like to point out that in our study the intelligence at grade 5 was measured using four subtests which allows for a more compre-hensive and reliable assessment than in previous studies (e.g.,
Becker et al., 2012). In addition, recent methodological research using simulation studies suggests that the inclusion of many covariates may help to mitigate the harming influence of mea-surement error (Steiner, Cook,&Shadish, 2011).
Concerning unmeasured confounders one might for example think of fundamental processes like working memory and pro-cessing speed limiting the future cognitive potential of the stu-dents. To investigate the robustness of our results, we conducted a sensitivity analysis which revealed that any unmeasured confounder would have to have quite a strong impact either on the students' intelligence or on the track assignment to fully eliminate the effect of academic tracking on students' intelligence. Given the list of covariates that were taken into account in the matching process we believe that the existence of such an unobserved confounder does not seem very likely. However, the effect of aca-demic tracking compared to non-acaaca-demic tracking is more robust against unmeasured confounders than its effect compared to comprehensive schools. Future studies might integrate additional measures of cognitive functioning into the matching procedure to further reduce the risk of unmeasured confounders.
4.2. Conclusion and implications for future research
Our study further supports the position that not only subject specific competencies but also general cognitive abilities can be improved by a cognitively stimulating learning environment in school (Adey et al., 2007). The learning environment in academic tracks can be characterized by compositional and institutional ef-fects and their interaction (Maaz et al., 2008). All of these are relevant for subject-specific achievement (Guill&Grohlich, 2013;€ Opdenakker&Van Damme, 2006). Future research should try to disentangle these effects to gain more insight in their relative importance to support the optimal development of students' gen-eral cognitive abilities.
Thinking again of the importance of intelligence regarding many aspects of success and life-satisfaction one would wish to offer the cognitive advantages of an academic track to more or even all students. However, it is not possible to enroll all students at aca-demic track schools without changing these schools themselves (at least their student composition). On a system level an increasing number of German federal states, including Hamburg since 2010, chose to combine all kinds of non-academic tracks to one new track where in shared classrooms students are prepared either for later vocational or later academic orientation, similarly to the Hamburg comprehensive schools described here. The result is a two-pillar-system of academic tracks and comprehensive tracks. The federal
state of Berlin even requires the same teacher education program for both types of tracks which should increase the general level of teacher competencies in the comprehensive track.
Given that changes on the education system level are draining and not per se effective (Hattie, 2009) one would wish that stu-dents could fully develop their cognitive potential while at any existing track. Increasing the level of cognitive activating instruc-tion for all students in the normal classroom, within-class ability grouping with more-demanding tasks for the more able students and enrichment courses on an academic-track-level at the non-academic track and comprehensive schools might be measures to help students at these schools further develop their cognitive po-tential. Additionally, all tracks might consider integrating direct intervention programs to foster cognitive abilities in their curricula as these have been shown to have effect sizes going beyond the tracking effects (Adey et al., 2007). These training programs can be content-specific (e.g.Papageorgiou et al., 2016) or address more general competences like deductive reasoning (Christoforides et al., 2016) as both improve the students' cognitive abilities.
Acknowledgements
This paper uses data from the longitudinal studies LAU and/or KESS. Both data sets were generated by the Free and Hanseatic City of Hamburg through the Ministry of Schools and Vocational Training between 1995 and 2012 and have been provided to the MILES scientific consortium (Methodological Issues in Longitudinal Educational Studies) for a limited period with the aim of con-ducting in-depth examinations of scientific questions. MILES is coordinated by the Leibniz Institute for Science and Mathematics Education (IPN).
The authors would like to thank Cornelia A. Gerigk for editorial assistance with this article.
Appendix A. Supplementary data
Supplementary data related to this article can be found athttp:// dx.doi.org/10.1016/j.learninstruc.2016.10.001.
References
Adey, P., Csapo, B., Demetriou, A., Hautam€aki, J., & Shayer, M. (2007). Can we be intelligent about intelligence?: Why education needs the concept of plastic general ability.Educational Research Review, 2(2), 75e97.http://dx.doi.org/ 10.1016/j.edurev.2007.05.001.
Althauser, R. P., & Rubin, D. (1971). Measurement error and regression to the mean in matched samples.Social Forces, 50(2), 206e214.
Balke-Aurell, G. (1982).G€oteborg Studies in educational Sciences: Vol. 40. Chances in ability as related to educational and occupational experience. G€oteborg, Sweden: Acta Universitatis Gothoburgensis.
Baumert, J., Kunter, M., Blum, W., Brunner, M., Voss, T., Jordan, A.,…Tsai, Y.-M. (2010). Teachers' mathematical knowledge, cognitive activation in the class-room, and student progress. American Educational Research Journal, 47(1), 133e180.http://dx.doi.org/10.3102/0002831209345157.
Becker, M., Lüdtke, O., Trautwein, U., & Baumert, J. (2006). Leistungszuwachs in Mathematik: Evidenz für einen Schereneffekt im mehrgliedrigen Schulsystem?, (Achievement gains in mathematics: Evidence for differential achievement trajectories in a tracked school system?),Zeitschrift für Padagogische Psychologie,€ 20(4), 233e242.
Becker, M., Lüdtke, O., Trautwein, U., K€oller, O., & Baumert, J. (2012). The differential effects of school tracking on psychometric intelligence: Do academic-track schools make students smarter?Journal of Educational Psychology, 104(3), 682e699.http://dx.doi.org/10.1037/a0027608.
Beh€orde für Schule und Berufsbildung (Ed). (2011).LAUeAspekte der Lernaus-gangslage und Lernentwicklung. Klassenstufen 5, 7 und 9, (LAU e Aspects of learning background and learning development. Grades 5, 7 and 9). Münster, Germany: Waxmann.
Bourdieu, P. (1977).Outline of a theory of practice(Vol. 16). Cambridge, United Kingdom: University Press.http://dx.doi.org/10.1017/CBO9780511812507.
Brody, N. (1992).Intelligence. New York, NY: Wiley.
van Buuren, S., & Groothuis-Oudshoorn, K. (2011). Mice: Multivariate imputation by chained equations in R.Journal of Statistical Software, 45(3).
2 Althauser and Rubin (1971)propose to estimate the bias in the treatment effect that is due to measurement error in a covariate as follows: Bias¼b,ðmX1mX2Þ,
s2
e=s2x
½1þs2
e=s2xwherebis the regression coefficient of the intelligence score at T2 on the intelligence score at T1 (assumed the same in both tracks), and
mX1andmX2are the mean values of the intelligence scores at T1 in the academic
track, and the non-academic track (or comprehensive school) sample. Assuming a reliability of .80, the variancess2
Carroll, J. B. (1993).Human cognitive abilities: A survey of factor-analytic studies. New York, NY: Cambridge University Press. http://dx.doi.org/10.1017/ CBO9780511571312.
Cattell, R. B. (1960).Culture Fair intelligence test, scale 2(3rd ed.). Champaign, Ill: IPAT.
Cattell, R. B. (1963). Theory offluid and crystallized intelligence: A critical experi-ment.Journal of Educational Psychology, 54(1), 1e22.http://dx.doi.org/10.1037/ h0046743.
Ceci, S. J. (1991). How much does schooling influence general intelligence and its cognitive components? A reassessment of the evidence.Developmental Psy-chology, 27(5), 703e722.http://dx.doi.org/10.1037/0012-1649.27.5.703. Christoforides, M., Spanoudis, G., & Demetriou, A. (2016). Coping with logical
fal-lacies: A developmental training program for learning to reason.Child Devel-opment.http://dx.doi.org/10.1111/cdev.12557.
Cliffordson, C., & Gustafsson, J.-E. (2008). Effects of age and schooling on intellectual performance: Estimates obtained from analysis of continuous variation in age and length of schooling.Intelligence, 36(2), 143e152.http://dx.doi.org/10.1016/ j.intell.2007.03.006.
Der, G., Batty, G. D., & Deary, I. J. (2009). The association between IQ in adolescence and a range of health outcomes at 40 in the 1979 US National longitudinal study of youth.Intelligence, 37(6), 573e580.
Gottfredson, L. S. (2003). g, jobs and life. In: H. Nyborg (Ed.),The scientific study of general intelligence: Tribute to Arthur R. Jensen(pp. 293e342). Amsterdam, the Netherlands: Pergamon Press.
Greiff, S., Wüstenberg, S., Csapo, B., Demetriou, A., Hautam€aki, J., Graesser, A. C., et al. (2014). Domain-general problem solving skills and education in the 21st century. Educational Research Review, 13, 74e83. http://dx.doi.org/10.1016./ j.edurev.2014.10.002.
Guill, K., & Gr€ohlich, C. (2013). Individuelle Lernentwicklung im gegliederten Schulsystem der Bundesrepublik Deutschland, (Individual learning develop-ment in Germany's tracked school system), In: K. Schwippert, M. Bonsen, & N. Berkemeyer (Eds.),Schul-und Bildungsforschung: Diskussionen, Befunde und Perspektiven(pp. 51e69). Münster, Germany: Waxmann.
H€arnqvist, K. (1968). Relative changes in intelligence from 13 to 18: II. Results.
Scandinavian Journal of Psychology, 9(1), 65e82. http://dx.doi.org/10.1111/ j.1467-9450.1968.tb00519.x.
Hattie, J. A. C. (2009).Visible learning. A synthesis over 800 meta-analyses relating to achievement. Oxon: Routledge.
Heller, K., Gaedike, A.-K., & Weinl€ader, H. (1985).Kognitiver F€ahigkeits-test: KFT 4e13þ, (Cognitive abilities test: KFT 4-13þ), (2nd ed.). Weinheim, Germany: Beltz.
Ho, D. E., Imai, K., King, G., & Stuart, E. A. (2007). Matching as nonparametric pre-processing for reducing model dependence in parametric causal inference.
Political Analysis, 15(3), 199e236.http://dx.doi.org/10.1093/pan/mpl013.
Ho, D. E., Imai, K., King, G., & Stuart, E. A. (2011). MatchIt: Nonparametric pre-processing for parametric causal inference.Journal of Statistical Software, 42(8), 1e28.
Horn, J. L. (1994). Theory offluid and crystallized intelligence. In R. J. Sternberg (Ed.),
Encyclopedia of human intelligence (Vol. 1, pp. 443e451). New York, NY: Macmillan.
Ireson, J., & Hallam, S. (2001). Ability grouping in education. London, United Kingdom: SAGE.http://dx.doi.org/10.4135/9781446221020.
Jaeggi, S. M., Buschkuehl, M., Jonides, J., & Perrig, W. J. (2008). Improvingfluid in-telligence with training on working memory. Proceedings of the National Academy of Sciences, USA, 105, 6829e6833. http://dx.doi.org/10.1073/ pnas.0801268105.
Jensen, A. R. (2002). Psychometric g: Definition and substantiation. In: R. J. Sternberg, & E. L. Grigorenko (Eds.),The general factor of intelligence: How general is it?(pp. 39e53). Mahwah, NJ: Erlbaum.
Klieme, E., Jude, N., Rauch, D., Ehlers, H., Helmke, A., Eichler, W.,…Willenberg, H. (2008). Alltagspraxis, Qualit€at und Wirksamkeit des Deutschunterrichts, (Everyday practices, quality, and efficacy of instruction in German). In Unter-richt und Kompetenzerwerb in Deutsch und Englisch: Ergebnisse der DESI-Studie
(pp. 139e344). Weinheim, Germany: Beltz.
Klusmann, U., Kunter, M., Trautwein, U., Lüdtke, O., & Baumert, J. (2008). Teachers' occupational well-being and quality of instruction: The important role of self-regulatory patterns.Journal of Educational Psychology, 100(3), 702e715.http:// dx.doi.org/10.1037/0022-0663.100.3.702.
Kultusministerkonferenz. (2006). Vereinbarung über die Schularten und Bil-dungsg€ange im Sekundarbereich I: Beschluss der Kultusministerkonferenz vom 03.12.1993 i. d. F. vom 02.06.2006, (Agreement on school types and tracks at lower secondary level: KMK resolution of 03/12/1993, version of 02/06/2006). Retrieved from http://www.kmk.org/fileadmin/veroeffentlichungen_beschluesse/1993/ 1993_12_03-Vereinbarung-Schularten-Sek1_01.pdf. on April, 20th, 2015.
Langenski€old, S., & Rubin, D. B. (2008). Outcome-free design of observational studies: Peer influence on smoking.Annales d'Economie et de Statistique, 91/92 , 107e125.
LeTendre, G. K., Hofer, B. K., & Shimizu, H. (2003). What is tracking? Cultural ex-pectations in the United States, Germany, and Japan.American Educational Research Journal, 40(1), 43e89.http://dx.doi.org/10.3102/00028312040001043.
Maaz, K., Trautwein, U., Lüdtke, O., & Baumert, J. (2008). Educational transitions and differential environments: How explicit between-school tracking contributes to social inequality in educational outcomes.Child Development Perspectives, 2(2), 99e106.
Maxwell, S. E., & Delaney, H. D. (2004).Designing experiments and analyzing data: A
model comparison perspective. Mahwah, NJ: Erlbaum.
Mietzel, G., & Willenberg, H. (1996).Hamburger Kombinierter Schulleistungstest für vierte und fünfte Klassen (KS HAM 4/5), (Hamburg's combined school performance test for Grades 4 and 5 (KS HAM 4/5)). Unpublished test procedure, Gottingen,€ Germany.
Morgan, S. L., & Winship, C. (2015).Counterfactuals and causal inference: Methods and principles in social research(2nded.). Cambridge, United Kingdom:
Uni-versity Press.
Muthen, B. O., & Muthen, L. K. (2008-2014).Mplus (version 7.3) computer software. Los Angeles, CA: Muthen&Muthen .
Neisser, U., Boodoo, G., Bouchard, T. J., Jr., Boykin, A. W., Brody, N., Ceci, S. J.,…Urbina, S. (1996). Intelligence: Knowns and unknowns.American Psychologist, 51(2), 77e101.http://dx.doi.org/10.1037/0003-066X.51.2.77.
Neumann, M., Schnyder, I., Trautwein, U., Niggli, A., Lüdtke, O., & Cathomas, R. (2007). Schulformen als differenzielle Lernmilieus: Institutionelle und kom-positionelle Effekte auf die Leistungsentwicklung im Fach Franz€osisch, (School types as differential learning environments: Institutional and compositional effects on learning gains in French).Zeitschrift für Erziehungswissenschaft, 10(3), 399e420.
Opdenakker, M. C., & Van Damme, J. (2006). Differences between secondary schools: A study about school context, group composition, school practice, and school effects with special attention to public and catholic schools and types of schools. School Effectiveness and School Improvement, 17(1), 87e117.http:// dx.doi.org/10.1080/09243450500264457.
Papageorgiou, E., Christou, C., Spanoudis, G., & Demetriou, A. (2016). Augmenting intelligence: Developmental limits to learning based cognitive change. Intelli-gence, 56, 16e27.http://dx.doi.org/10.1016/j.intell.2016.02.005.
Pietsch, M., & Stubbe, T. C. (2007). Inequality in the transition from primary to secondary school: School choices and educational disparities in Germany. Eu-ropean Educational Research Journal, 6(4), 424e445.http://dx.doi.org/10.2304/ eerj.2007.6.4.424.
Plomin, R. (2003). General cognitive ability. In: R. Plomin, J. C. DeFries, I. W. Craig, & P. McGuffin (Eds.),Behavioral genetics in the postgenomic era(pp. 183e201). Washington, DC: American Psychological Association. http://dx.doi.org/ 10.1037/10480-011.
Prenzel, M., Zimmer, K., Drechsel, B., Heidemeier, H., & Draxler, C. (2005). Der Blick in die L€ander, (Looking into the Laender), In: PISA-Konsortium Deutschland (Ed.),PISA 2003. Der zweite Vergleich der L€ander in Deutschland - Was wissen und k€onnen Jugendliche?(pp. 169e233). Münster, Germany: Waxmann.
R Core Team. (2015).R: A language and environment for statistical computing. Vienna, Austria: R Foundation for Statistical Computing. URLhttp://www.R-project.org/. Retelsdorf, J., Becker, M., K€oller, O., & M€oller, J. (2012). Reading development in a tracked school system: A longitudinal study over 3 years using propensity score matching. British Journal of Educational Psychology, 82(4), 647e671. http:// dx.doi.org/10.1111/j.2044-8279.2011.02051.x.
Retelsdorf, J., Butler, R., Streblow, L., & Schiefele, U. (2010). Teachers' goal orienta-tions for teaching: Associaorienta-tions with instructional practices, interest in teach-ing, and burnout. Learning and Instruction, 20(1), 30e46. http://dx.doi.org/ 10.1016/j.learninstruc.2009.01.001.
Reynolds, D., Sammons, P., De Fraine, B., Van Damme, J., Townsend, T., Teddlie, C., et al. (2014). Educational effectiveness research (EER): A state-of-the-art review.
School Effectiveness and School Improvement, 25(2), 197e230.
Rosenbaum, J. E. (1975). The stratification of socialization processes.American So-ciological Review, 40(1), 48e54.http://dx.doi.org/10.2307/2094446.
Rubin, D. B. (1987).Multiple imputation for non-response in surveys. New York, NY: Wiley.http://dx.doi.org/10.1002/9780470316696.
Schafer, J. L., & Graham, J. W. (2002). Missing data: Our view of the state of the art.
Psychological methods, 7(2), 147e177.
Schellenberg, E. G. (2006). Long-term positive associations between music lessons and IQ. Journal of Educational Psychology, 98(2), 457e468. http://dx.doi.org/ 10.1037/0022-0663.98.2.457.
Schooler, C., Mulatu, M. S., & Oates, G. (1999). The continuing effects of substanti-vely complex work on the intellectual functioning of older workers.Psychology and Aging, 14(3), 483e506.http://dx.doi.org/10.1037/0882-7974.14.3.483. Shavit, Y., & Featherman, D. L. (1988). Schooling, tracking, and teenage intelligence.
Sociology of Education, 61(1), 42e51.http://dx.doi.org/10.2307/2112308. Simons, D. J. (2014). The value of direct replication.Perspectives on Psychological
Science, 9(1), 76e80.http://dx.doi.org/10.1177/1745691613514755.
Steiner, P. M., Cook, T. D., & Shadish, W. R. (2011). On the importance of reliable covariate measurement in selection bias adjustments using propensity scores.
Journal of Educational and Behavioral Statistics, 36(2), 213e236.
Stuart, E. A. (2010). Matching methods for causal inference: A review and a look forward.Statistical science: a Review Journal of The Institute of Mathematical Statistics, 25(1), 1e21.http://dx.doi.org/10.1214/09-STS313.
Stuart, E. A., & Green, K. M. (2008). Using full matching to estimate causal effects in non-experimental studies: Examining the relationship between adolescent marijuana use and adult outcomes.Developmental Psychology, 44(2), 395e406.
http://dx.doi.org/10.1037/0012-1649.44.2.395.
Thorndike, R. L., & Hagen, E. (1971).Cognitive abilities test. Boston, MA: Houghton Mifflin.
Trautwein, U., Lüdtke, O., Marsh, H. W., K€oller, O., & Baumert, J. (2006). Tracking, grading, and student motivation: Using group composition and status to predict self-concept and interest in ninth-grade mathematics.Journal of Educational Psychology, 98(4), 788e806.http://dx.doi.org/10.1037/0022-0663.98.4.788. Valentin Kvist, A., & Gustafsson, J.-E. (2008). The relation betweenfluid intelligence
and the general factor as a function of cultural background: A test of Cattell's investment theory. Intelligence, 36, 422e436. http://dx.doi.org/10.1016/ j.intell.2007.08.004.
VanderWeele, T. J., & Arah, O. A. (2011). Bias formulas for sensitivity analysis of unmeasured confounding for general outcomes, treatments, and confounders.
Epidemiology, 22(1), 42e52.
Weiß, R. H. (1998).Grundintelligenztest Skala 2eCFT 20, (Basic intelligence test scale 2) (4th revised edition). G€ottingen, Germany: Hogrefe.
Wrulich, M., Brunner, M., Stadler, G., Schalke, D., Keller, U., Chmiel, M., et al. (2013). Childhood intelligence and adult health: The mediating role of education and socio-economic status. Intelligence, 41, 490e500. http://dx.doi.org/10.1016/ j.intell.2013.06.015.