International Diversification
with Large- and Small-Cap Stocks
Cheol S. Eun, Wei Huang, and Sandy Lai*
________________________
* Eun,
cheol.eun@mgt.gatech.edu
, College of Management, Georgia Institute of
Technology, Atlanta, GA 30332-0520; Huang,
weih@hawaii.edu
, Shidler College of
Business, University of Hawaii at Manoa, Honolulu, HI 96822; Lai,
sandylai@smu.edu.sg
, Lee Kong Chian School of Business, Singapore Management
University, Singapore 259756. We thank Stephen Brown (the editor) and an anonymous
referee for providing many helpful comments that significantly improved the paper. We
also benefited from useful comments from participants of the 2003 BSI Gamma
Foundation Conference, 2004 Western Finance Association Meeting, and 2006 China
International Conference in Finance. Lastly, we thank for research assistance from Shun
Cao, Jack de Jong, and Liang Zhang.
International Diversification with Large- and Small-Cap Stocks
Abstract
To the extent that investors diversify internationally, large-cap stocks receive the dominant share of fund allocation. Increasingly, however, returns to large-cap stocks or stock market indices tend to co-move, mitigating the benefits from international diversification. In contrast, stocks of locally oriented, small companies do not exhibit the same tendency. In this paper, we assess the potential of small-cap stocks as a vehicle for international portfolio diversification during the period 1980-1999. We show that the extra gains from the augmented diversification with small-cap funds are statistically significant for both in-sample and out-of-sample periods and remain robust to the consideration of market frictions.
I. Introduction
Since the classic studies of Grubel (1968), Levy and Sarnat (1970), and Solnik (1974), numerous papers have documented the gains from international portfolio diversification. They show that the gains from international diversification stem mostly from the relatively low correlation among international securities when compared to domestic securities. Further, previous studies, e.g., Heston and Rouwenhorst (1994) and Griffin and Karolyi (1998), have shown that industrial structure explains relatively little of the cross-country difference in stock market volatility, and that the low international correlation is mostly due to country-specific sources of return variation. Also, they show that the dominance of country factors in international returns is robust to differing definitions of industry classifications. Relatively low international correlations, together with the gradual liberalization of capital markets, are indeed responsible for the rising volume of cross-border investments and the proliferation of international mutual funds in the U.S. and abroad.
As international capital markets become more integrated, however, stock market correlations have risen, diminishing the potential gains from international diversification. Longin and Solnik (1995), for example, document that international correlations among stock market indices have indeed increased over the 30-year period 1960-1990. Goetzmann, Li, and Rouwenhorst (2005) also show that international correlations tend to be higher during the periods of higher economic and financial integration. Higher international correlations observed in recent years clearly cast doubt on the strength and validity of the case for international diversification argued by the classic studies. 1
To the extent that investors diversify internationally, large-cap stocks have received the dominant share of overseas investments. This ‘large-cap bias’ is understandable as investors naturally gravitate
1 A few recent studies, e.g., Cavaglia, Brightman, and Aked (2000) and Baca, Garbe, and Weiss (2000), suggest that the rising international correlations may be associated with the declining importance of country factors relative to industry factors. This view, however, is not unanimously held. Brooks and Del Negro (2004), for instance, argue that the rising importance of industry factors relative to country factors does not reflect the ongoing financial integration, but rather a temporary phenomenon associated with the recent stock market fluctuations. Although the relative importance of country vs. industry factors is an important, unsettled issue, we do not address this issue in our paper. Rather, we focus on the merit of considering small-cap stocks in international diversification.
toward well-known, large foreign companies that are highly visible and often multinational.2 The large-cap bias is also reinforced by the fact that the majority of cross-listed stocks, a popular vehicle for international investment, are large-cap stocks.3 As discussed by Foerster and Karolyi (1999) and others, companies often use the cross-listings of shares to enhance the level of investor recognition and expand the shareholder base. The large-cap bias is also broadly consistent with Huberman’s (2001) proposition that familiarity breeds investment. In addition, those investors, especially institutional investors, who track national stock market indices, may also contribute to the large-cap bias as the (value-weighted) market indices are dominated by large-cap stocks.4 Similarly, in documenting the gains from international diversification, academic studies tend to use large-cap stocks or national stock market indices dominated by the former. The potential role of small-cap stocks in international diversification has received little attention in these studies.
As we show in this paper, the return-generating mechanisms for large- and small-cap stocks are quite different. Specifically, returns on large-cap stocks are substantially driven by common global factors. In contrast, returns on small-cap stocks are primarily driven by local and idiosyncratic factors. This difference in return-generating mechanism is understandable considering that many large-cap stocks tend to be those of multinational companies with a substantial foreign customer and investor base, whereas small-cap companies are likely to be more locally oriented with a limited international exposure. As a result, the gains from international diversification with large-cap stocks can be modest as their returns are
2 In their study of foreigners’ equity holdings in Japan, Kang and Stulz (1997) show that foreign investors prefer large, export-oriented, liquid, and U.S. cross-listed firms. Ferreira and Matos (2006) also report that institutional investors strongly prefer large and liquid stocks with good governance practices. In addition, institutional investors prefer those stocks that are cross-listed in the U.S. market and members of the MSCI all-country world index.
3 At the end of 2003, for example, 40 of the French companies in our sample are traded as ADRs in the U.S. Of these, 35 are from the top 20% largest companies in terms of market capitalization and none are from the bottom 20%. Similarly, out of the 42 German companies with ADRs in our sample, 35 are from the top 20% group and only one is from the bottom 20% group in terms of market capitalization. In the case of Japan, 141 companies in our sample have ADRs, and 127 of them are from the top 20% and none are from the bottom 20%.
4 In the case of MSCI market indices representing our ten sample markets, large- (small-) cap stocks from the top (bottom) 20% of the market capitalization account for 92.2% (0.2%) of the market value of MSCI indices, on average, with mid-cap stocks accounting for the remaining 7.6%. As a result, popular stock market indices, such as MSCI indices, tend to be dominated by large-cap stocks.
substantially driven by common global factors.5 However, the same skepticism may not be applicable to small-cap stocks as their returns are substantially generated by local and idiosyncratic factors. Thus, small-cap stocks can potentially be an effective vehicle for international diversification.
It is against this backdrop that investment companies in recent years have introduced small-cap oriented international mutual funds, allowing investors to diversify into foreign small-cap stocks without incurring excessive transaction costs. Many investment companies such as Fidelity, ING, Lazard, Merrill Lynch, Morgan Stanley, Oppenheimer, and Templeton currently offer small-cap oriented international mutual funds in the U.S. The recent advent of international small-cap funds is thus highly instructive and also suggests the unique role that small-cap stocks can play in global risk diversification.6 Although there are currently about 70 small-cap oriented international mutual funds in the U.S., little is known about the potential of small-cap stocks as a vehicle for international diversification.7 The current paper purports to fill this gap in the literature.
Specifically, the purpose of this paper is to assess the potential benefits from international diversification with small-cap as well as large-cap stocks. We examine the issue from the perspective of a U.S. (or dollar-based) investor who has diversified internationally with MSCI country indices or large-cap stocks but desires to augment her investment with small-cap funds from major foreign countries. Our paper thus addresses the following question: Are there ‘additional gains’ from international diversification with small-cap stocks? In this study, we consider ten developed countries with relatively open capital markets – Australia, Canada, France, Germany, Hong Kong, Italy, Japan, the Netherlands, the United Kingdom, and the United States. Our sample comprises two countries from North America, three from
5 A recent study by Brooks and Del Negro (2006) also shows that an increase in the international component of a firm’s sales will increase (decrease) the exposure of the firm to global (country-specific) shocks. This implies that multinational firms will be more susceptible to global shocks than locally oriented firms.
6 In terms of geographical coverage, some funds are global and international while others are regional and national. Examples of the existing small-cap oriented international mutual funds include Templeton Global Smaller Companies Fund, Merrill Lynch Global Small Cap Fund, Fidelity International Small Cap Fund, Morgan Stanley International Small Cap Fund, AIM Europe Small Company Fund, FTI European Smaller Companies Fund, Fidelity Japan Smaller Companies Fund, DFA Japanese Small Company Fund, DFA United Kingdom Small Company Fund, etc.
7 According to Morningstar, there are about 70 small-cap oriented international mutual funds in the U.S. as of 2006.
Asia/Pacific, and five from Europe. It is noted that international investors do not face formal barriers to investing in stocks of these countries. For the sake of analytical tractability and consistency with industry practices, we form three market capitalization-based funds, i.e., large-cap, mid-cap, and small-cap funds, from each of our sample countries and use the risk-return characteristics of cap-based funds computed over the 20-year period 1980-1999. Our analysis in this paper comprises two parts. First, we examine the different return-generating mechanisms for cap-based funds, the correlation structure of cap-based funds, and their implications for international diversification. Second, we conduct the mean-variance analysis of international portfolio investment with cap-based funds.
The key findings of our paper can be summarized as follows. First, our mean-variance spanning tests show that international small-cap funds cannot be ‘spanned’ by country stock market indices. Small-cap fund returns are driven primarily by local and idiosyncratic factors. As a result, small-cap funds have relatively low correlations not only with large-cap funds but also with each other. In contrast, large-cap
funds tend to have relatively high correlations with each other, reflecting their common exposure to global factors. During our sample period, for instance, the correlation between the U.S. and Netherlands large-cap funds is 0.61, whereas the correlation between small-cap funds from the two countries is only 0.17. Further, the correlation between the U.S. large-cap and Netherlands small-cap funds is 0.21. This correlation structure suggests that large-cap funds are relatively similar, but small-cap funds are distinct from each other. Our simulations indeed show that a fully diversified international ‘large-cap’ stock portfolio is about 9.2% as risky (measured by the portfolio variance) as a typical individual stock, but a fully diversified international ‘large- and small-cap’ stock portfolio can further reduce the risk by about two-thirds. This result suggests that small-cap stocks can play an effective and unique role in global risk diversification.
Second, to assess the potential mean-variance efficiency gains from diversification with small-cap stocks, we solve for the optimal international portfolio using the historical risk-return characteristics of cap-based funds during the period 1980-1999. We consider the ten MSCI country indices (proxies for large-cap funds), small-cap funds, and mid-cap funds for portfolio holdings. Without short sales for
foreign stocks, a realistic restriction during much of our sample period, the optimal (tangency) portfolio consists of (i) the U.S. market index and (ii) international small-cap funds. It is noteworthy that neither foreign market indices nor mid-cap funds receive a positive weight in the optimal international portfolio during our sample period; neither does the U.S. small-cap fund. The optimal international portfolio augmented with small-cap funds has a Sharpe performance measure that is statistically significantly greater than that of the U.S. market index as well as that of the optimal portfolio only comprising MSCI country indices. Our findings remain robust to a realistic range of additional costs for investing in small-cap funds. Also, our findings remain robust so long as the accessibility of small-small-cap stocks is not severely constrained. By contrast, the optimal international portfolio only comprising MSCI country indices has a Sharpe measure that is insignificantly different from that of the U.S. market index during our sample period. Our key findings hold for in-sample as well as out-of-sample periods, regardless of whether we consider conditioning information or not.
The rest of the paper is organized as follows. Section II describes the data, fund design, and the risk-return characteristics of cap-based funds. Section III (i) tests if small-cap funds can be spanned by country market indices or large-cap funds, (ii) investigates the return-generating mechanism for market cap-based funds, and (iii) assesses via simulations the capacity of small-cap stocks for global risk diversification. Section IV discusses optimal international allocation strategies with small-cap funds and evaluates the gains from employing such strategies. Section V provides robustness checks of our key findings. Lastly, Section VI offers concluding remarks.
II. Data, Fund Design, and Preliminary Analysis
Our data set includes monthly stock prices and returns, the number of shares outstanding for exchange-listed companies, and MSCI stock market indices from the ten major countries during the period January 1980-December 1999. There is a consensus among researchers that investors would not have faced major barriers to international investments during this period in the ten developed countries we study. We obtain the firm level data from CRSP for U.S. firms and from Datastream for international firms. We obtain MSCI stock market indices from Datastream. In addition, we obtain the U.S. T-bill rate
from CRSP and use it as a proxy for the risk-free interest rate. Our sample includes all U.S. firms listed on the New York Stock Exchange, American Stock Exchange and Nasdaq and all foreign firms from each of the ten countries for which Datastream provides the necessary data during our sample period.
We exclude non-common stocks, such as preferred stocks, REITs, and closed-end funds, from our sample. In addition, we exclude those firms that are incorporated outside their home countries and those that are indicated by Datastream as duplicates. To filter out the recording errors embedded in Datastream, we treat the monthly holding period returns greater than 400% as missing values. Datastream maintains the historical data of delisted stocks in a separate inactive file. We consolidate both active and inactive stock files to avoid a survivorship bias in our data. In view of the practice that Datastream sets the return to a constant after a stock ceased trading, we accordingly change the constant value to a missing value in the inactive file. 8
For the sake of both analytical tractability and consistency with industry practices, we form three market cap-based funds (CBFs), i.e., large-cap, mid-cap, and small-cap funds, from each of our sample countries. To form the CBFs, we rank all our sample firms in each country based on their market capitalization at the end of each year. We then form a ‘large-cap fund’ with the top 20% of the largest-cap stocks, a ‘small-cap fund’ with the bottom 20% of the smallest-cap stocks, and a ‘mid-cap fund’ with the rest of stocks in each country. Further, we use the relative market value for each stock to determine its weight in the fund. We thus form three cap-based, value-weighted ‘index’ funds from each country. We then calculate the monthly (value-weighted) returns for each fund in terms of U.S. dollars. Because there are three funds from each of the ten countries, we generate 30 separate time series of monthly fund
8 Ince and Porter (2006) also find data problems in the Datastream U.S. dataset similar to what we find in our Datastream international dataset. Specifically, they compare the individual U.S. equity return data obtained from Datastream with those obtained from CRSP. They find that Datastream often mixes non-common stocks with common stocks, and firms incorporated inside the U.S. with those outside the U.S. Furthermore, Datastream maintains a constant return index value for delisted U.S. stocks even after they cease trading. Also, there are instances of data errors. They propose to drop delisted stocks from the sample following their delisting and screen out the non-common stocks and firms incorporated outside the U.S. when studying U.S. common equity returns. In addition, they suggest using 300% as the threshold for monthly return data and set any return above the threshold that is reversed within one month to missing. However, they caution that the threshold they selected is somewhat arbitrary and can be higher or lower in other markets. In general, our data screening process is in spirit similar to what Ince and Porter propose in their paper.
returns, in terms of U.S. dollars, over the 20-year period 1980-1999. CBFs are updated once a year based on the market capitalization of individual stocks at the end of the previous year. 9
Insert Table 1 about here
Table 1 provides summary statistics for each of our sample CBFs. Specifically, Panel A of Table 1 provides the average number of stocks (No) comprising the fund, annualized mean ( R ) and standard deviation (σ) of returns, Sharpe ratio (SHP) for each CBF, and the fund’s correlation with the (MSCI) U.S. market index (ρUS). As can be seen from the panel, the large- (small-) cap fund includes, on average, 211 (200) stocks, whereas the mid-cap fund includes 629 stocks on average. The number of stocks included in individual funds varies greatly, however, reflecting the different size of stock markets across our sample countries. As can be expected, the U.S. funds include the most stocks and the Italian and Dutch funds the least. 10
A few things are noteworthy from Panel A of Table 1. First, in the majority of countries, the small-cap fund has a higher mean return than large-cap fund, suggesting that the size premium exists in these countries. The “small-cap premium” is most pronounced in Canada and Australia. The U.S. and the Netherlands are the two exceptions to this; the mean return is a bit higher for the large-cap fund than for the small-cap fund in these countries.11 In the majority of countries, the mid-cap fund has a lower mean return than its large-cap counterpart. This “mid-cap discount” is most pronounced in Germany, Hong Kong, and Italy. In Hong Kong (Italy), for example, the mean return is 22.1% (20.0%) for the large-cap fund and 16.0% (15.7%) for the mid-cap fund. In Germany, the mean return is 14.4% for large-cap, 11% for mid-cap, and 14.6% for small-cap funds. Large- and small-cap funds thus have practically the same
9 We also attempted to form CBFs by first ranking all the sample firms globally based on their market capitalizations and then forming CBFs for each country. This approach, however, turns out to be impractical for a few reasons. First, only two countries, i.e., the U.S. and Japan, have large-cap funds based on the global ranking. Second, Griffin (2002) finds that country factors provide a more effective description of stock returns than global factors, suggesting that a country pooling approach, rather than a global pooling approach, would be appropriate for constructing CBFs.
10 To examine how the compositions of CBFs have evolved over time, we also report the number of constituent stocks for each CBF for several selected years in Appendix B. As can be expected, the number of constituent stocks for each sample fund has increased substantially over time.
11 Fama and French (1992) also found that the size premium in the U.S. has become weaker in recent years. In fact, they document a negative and insignificant size premium during the period 1981-1990.
mean returns in Germany, but the mid-cap fund has a significantly lower mean return. As shown in the last row of the panel, the cross-country average of mean returns is 16.6% for large-cap funds, 14.8% for mid-cap funds, and 21.1% for small-cap funds.
Second, with the exception of two countries, Germany and Italy, the small-cap fund has a greater return volatility than the large-cap fund. Among large-cap funds, the U.S. fund has the lowest volatility. This is a familiar result often attributed to the fact that the U.S. has the largest stock market and the returns are computed in U.S. dollar terms. Among mid-cap funds, however, each of the three foreign funds, i.e., Canada, Germany, and the Netherlands, has a lower volatility than the U.S. fund. Among small-cap funds, both German and Dutch funds have lower volatilities than the U.S. fund.
Third, in every country, the large-cap fund has the highest correlation with the U.S. and the small-cap fund the lowest, with the mid-small-cap fund falling in between. Using Canada, for example, the correlation with the (MSCI) U.S. market index is 0.71 for the large-cap fund, 0.58 for the mid-cap fund, and 0.45 for the small-cap fund.
Lastly, the Sharpe performance measures (SHP) indicate that in the majority of countries, the small-cap fund outperforms both the mid- and large-cap funds. The cross-country average Sharpe ratio is 0.46 for large-cap funds, 0.38 for mid-cap funds, and 0.57 for small-cap funds. The U.S. fund has the best performance among all large-cap funds, but it is the second worst performing fund among all small-cap funds. In contrast, the Canadian fund is the second worst performing fund among all large-cap funds, but it is the best performing fund among all small-cap funds. The national fund performance ranking varies greatly across market-cap classes.
Panel B of Table 1 reports the ‘average’ inter- and intra-category correlations among sample CBFs computed from the full correlation matrix over the 20-year period 1980-1999. If small-cap stocks are thinly traded, the correlations computed with monthly returns may result in an understatement of the true magnitude of correlations for small-cap funds. To alleviate this concern, we compute and present the
average correlations using monthly, quarterly, and annual returns in Panel B.12,13 Domestic (international) correlations are provided in the upper (lower) triangle. For brevity, we provide the full correlation matrix in Appendix A.
Overall, Panel B of Table 1 suggests that correlations among stocks are strongly influenced by both the country and market-cap classifications. When monthly returns are used, the average ‘international’ correlation is 0.44 among large-cap funds, 0.39 among mid-cap funds, and 0.27 among small-cap funds. The intra-category correlation decreases as the market-cap decreases.14 Further, the average ‘international’ correlation of small-cap funds is 0.30 with large-cap funds and 0.31 with mid-cap funds. When quarterly (annual) returns are used, the average ‘international’ correlation is 0.47 (0.54) among large-cap funds, 0.40 (0.45) among mid-cap funds, and 0.28 (0.34) among small-cap funds. On the other hand, the average ‘international’ correlation of small-cap funds is 0.32 (0.40) with large-cap funds and 0.33 (0.38) with mid-cap funds. When quarterly or annual returns are used, the average correlations tend to go up to a certain extent, but the relative correlations among market cap-based funds remain qualitatively unchanged. Considering that the correlations among CBFs computed at the quarterly or annual frequency exhibit a pattern that is qualitatively similar to those computed at the monthly frequency,
12 Appendix C provides the first-order autocorrelation for each CBF at the monthly, quarterly, and annual frequency. At the monthly frequency, none of the large-cap funds show a significant autocorrelation, but half of the mid-cap and all but one small-cap funds exhibit a significant first-order autocorrelation. The positive autocorrelations of small-cap stocks could be due to infrequent trading and momentum trading. At the quarterly frequency, however, small-cap funds do not show significant autocorrelations, with the exceptions of the Australian and Dutch funds. None of the mid-cap funds show a significant autocorrelation at the quarterly frequency, but one large-cap fund, that of Hong Kong, shows a significant, negative autocorrelation. At the annual frequency, only one small-cap, one mid-cap, and two large-cap funds exhibit a significant autocorrelation.
13 To gauge the effect of the infrequent-trading problem on the correlation structure, we also examine the autocorrelations among cap-based funds at the monthly, quarterly, and annual frequencies. The results for the cross-autocorrelations show that the average within- (inter-) country cross-cross-autocorrelations between small-cap fund returns and lagged large-cap fund returns are 0.17 (0.10), 0.13 (0.07), and 0.02 (-0.03), respectively, at the monthly, quarterly, and annual frequency. Across the ten countries, 70% (41%), 20% (9%), and 10% (3%) of the within- (inter-) country cross-autocorrelations between small-cap fund returns and lagged large-cap fund returns are significantly positive at the monthly, quarterly, and annual frequency, respectively. Hence, the cross-autocorrelations also suggest that the infrequent trading problem is more obvious at the monthly frequency, but much less so at the quarterly and annual frequency.
14 To further examine this correlation structure, we construct the cumulative distribution function of correlation for each fund category. The resulting distribution functions show that the probability of observing a particular correlation or lower is always higher for small-cap funds than for either mid- or large-cap funds. In fact, there is a first-order stochastic dominance of the distribution of small-cap fund correlation over those of mid- and large-cap fund correlations. The Davidson-Duclos (2000) test indicates that the reported stochastic dominance is statistically significant.
one can be reasonably confident that the possibility of infrequent trading of small-cap stocks may not be the main driver for the pattern of correlations among CBFs. In the following sections, we use monthly return data to conduct our analysis.
The correlation structure presented in Panel B of Table 1 clearly shows that small-cap funds have relatively low correlations not only with large- and mid-cap funds but also with each other. This correlation structure suggests that in terms of reducing the portfolio risk, international diversification is likely to be more effective with a combination of small- and large-cap stocks than with large-cap stocks alone.
Panel B of Table 1 also shows that when monthly returns are used, the average ‘domestic’ (i.e., same country) correlation is 0.87 between the large- and mid-cap funds, 0.66 between the large- and small-cap funds, and 0.83 between the mid- and small-cap funds. In comparison, the average ‘international’ correlation is 0.39 between the large- and mid-cap funds, 0.30 between the large- and small-cap funds, and 0.31 between the mid- and small-cap funds. The marked difference in domestic vs. international correlations among CBFs, observed regardless of return frequency, implies that domestic cross-cap diversification would be less effective than international cross-cap diversification in reducing the portfolio risk.15
III. Mean-Variance Spanning Tests: Are Small-Caps Different?
In this section, we (i) formally check if small-cap funds can be spanned by the MSCI country indices, (ii) examine the return-generating mechanism for market cap-based funds (CBFs) and their risk-return characteristics, and (iii) perform simulations to assess the capacity of small-caps for risk diversification. Although small-cap funds have relatively low pair-wise correlations with large-cap funds
15 In light of the potential deficiency in the Datastream data, especially concerning small-cap stocks, we cross-check our results with the alternative equity data sources. We obtain the data for three foreign countries that are publicly available: Japan and Hong Kong from the PACAP database and Australia from the Share Price and Price Relatives dataset (SPPR) that is maintained by the Centre for Research in Finance, Australian Graduate School of Management. We match the individual stocks in Datastream with those in PACAP and SPPR, and use the alternative datasets to form cap-based funds and compute the value-weighted fund returns. We find that the monthly returns on small-cap funds calculated from Datastream and the alternative datasets are highly correlated and their mean returns and standard deviations are close to each other. In short, our findings in this paper are unlikely to be significantly altered by the use of alternative data sources.
or country indices, the former may still be spanned collectively by the latter. If so, small-cap funds are redundant in the portfolio context and thus the ‘additional gains’ from international diversification with small-caps will be insignificant. If the spanning is rejected, on the other hand, small-cap funds can potentially play an important role in enhancing the gains from international diversification.
A. Are Small-Cap Funds Spanned by MSCI Country Indices?
Following Huberman and Kandel (1987), we check if small-cap funds can be spanned by MSCI country indices by regressing the ‘new asset’ (each CBF) on the ‘benchmark assets’ (ten MSCI country indices) as follows:
(1) AU AU US US
i i i i i
R = α + β MSCI +... + β MSCI + ε ,
where Ri is the return on small-cap fund from the i-th country, MSCIAU (MSCIUS) denotes the return on the MSCI Australia (U.S.) country index, αi is the estimated regression intercept for the small-cap fund, and AU
i
β ( US i
β ) is the estimated regression coefficient associated with MSCIAU (MSCIUS) for the fund. The null hypothesis of spanning is equivalent to the joint hypothesis that α is equal to zero and the sum of βs is equal to one:
αi = 0, and Σi βi = 1.
When there is only one new asset, as is the case with our analysis, the exact distribution of the likelihood ratio test under the null hypothesis is given by:
(2) HK = 1 -1 T-K-1
V 2
⎛ ⎞⎛ ⎞
⎜ ⎟⎜ ⎟
⎝ ⎠⎝ ⎠ ,
where V denotes the ratio of the determinant of the maximum likelihood estimator of the error covariance matrix for the unrestricted model (no spanning) to that of the restricted model (spanning), T is the number of observations, and K is the number of benchmark assets. The test statistic follows an F distribution with (2, T-K-1) degree of freedom.16
16 For the derivation of Equation (2), readers are referred to Kan and Zhou (2001), where the authors also offer an extensive discussion of the exact distribution and the power analysis of regression-based mean-variance spanning
Insert Table 2 about here
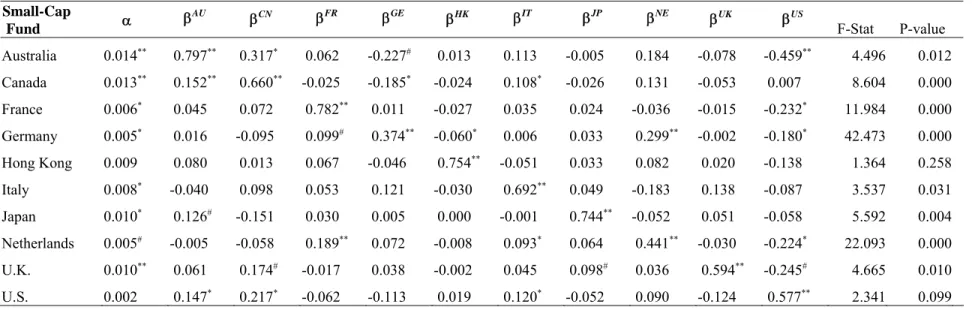
Table 2 reports the Huberman-Kandel mean-variance spanning test results for small-cap funds from each of the ten countries. As can be seen from the table, the spanning hypothesis is rejected for Canada, France, Germany, Japan, the Netherlands and the U.K. at the 1% level of significance, and for Australia and Italy at the 5% level. For the U.S. the spanning hypothesis is rejected at the 10% level. For Hong Kong, spanning cannot be rejected at the usual significance levels.17 The spanning test results confirm that small-cap funds are indeed unique and investors may benefit from adding small-cap funds to their portfolio of country indices18.
Also noteworthy from Table 2 is the fact that all of the small-cap funds have a significant and positive beta coefficient with respect to their own home country market index but rarely with respect to foreign market indices. It is also interesting to note that with the sole exception of Canada, each foreign small-cap fund has a negative beta against the U.S. country index. Table 2 further shows that the
estimated alphas are all significantly different from zero, with the exception of Hong Kong and the U.S. B. Return-Generating Mechanism for CBFs
To better understand the return behavior of market-cap sorted stocks, we estimate the extent to which returns on cap-based funds (CBFs) are driven by global and country factors. To this end, we employ a simple two-factor model to estimate the global and country betas for each CBF. Specifically, we estimate the global and country betas as follows:
(3) Rij =αij+βWij RW +βijCRCi +εij ,
where Rij is the return on the j-th fund from the i-th country, RW is the return on the MSCI world index, a proxy for the return on the global market portfolio, C
i
R is the portion of country i's national stock market index return that is uncorrelated to the return on the global market portfolio; it is the residual from
and intersection tests for the case of normally distributed returns. In addition, they discuss the robustness of these tests to non-normality assumptions.
17 When we form the Hong Kong small-cap fund from the smallest 10% of companies, the spanning hypothesis is rejected at the 10% level.
18 As a robustness check, we replicate the spanning test using quarterly data. The qualitative results remain unchanged.
regressing the MSCI stock market index return for country i on the MSCI world market index return. The coefficients βijWand βCij in Equation (3) denote the global beta and orthogonalized country beta for the j-th CBF from j-the i-j-th country, respectively. They measure j-the sensitivities of returns on CBFs to j-the global and country-specific factors.
Once the global and country betas are estimated, we can decompose a CBF’s return variance into the following three components: (i) the proportion of the variance attributable to the global factor, (ii) the proportion attributable to the country factor, and (iii) the idiosyncratic risk of the fund, unrelated to either the global or country factor. Stated algebraically, we decompose Var(Rij) as follows:
(4) W 2 W C 2 C
ij ij ij i ij
Var(R ) = (β ) Var(R ) + (β ) Var(R ) + Var(ε ) .
We then calculate (i), (ii), and (iii) as follows:
(i) global factor proportion = W 2 W ij
(β ) Var(R ) /Var(R )ij
(ii) local factor proportion = C 2 C
ij i
(β ) Var(R ) /Var(R ) ij
(iii) idiosyncratic factor proportion = Var(εij) /Var(R ) ij
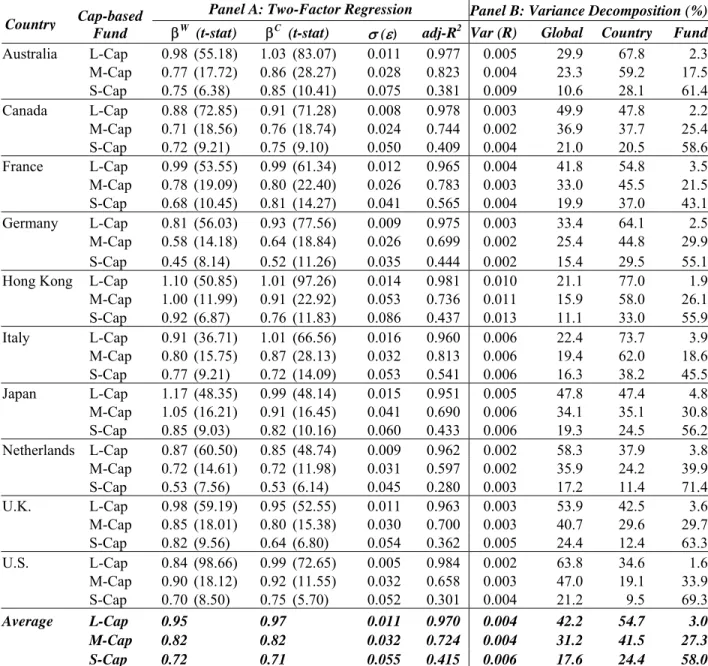
Table 3 presents the estimates of the global and country betas and the idiosyncratic risk measures in Panel A and the variance decompositions in Panel B. Several things are noteworthy. First, regardless of the originating country and market-cap categories, each CBF in our sample has statistically significant global and country beta measures, attesting to the pervasive influences of global and country factors. However, in every country, the large-cap fund has higher global and country betas than the small-cap fund, with the mid-cap fund generally falling in between. In the case of the Netherlands, for example, the global (country) beta is 0.87 (0.85) for the large-cap fund, 0.72 (0.72) for the mid-cap fund, and 0.53 (0.53) for the small-cap fund. For the United States, the global (country) beta is 0.84 (0.99) for the large-cap fund, 0.90 (0.92) for the mid-large-cap fund, and 0.70 (0.75) for the small-large-cap fund.
As can be seen from the last rows of Panel A, the sample average global (country) beta is 0.95 (0.97) for the large-cap funds, 0.82 (0.82) for the mid-cap funds, and 0.72 (0.71) for the small-cap funds.
In contrast, the sample average idiosyncratic risk measure, σ(ε), is 0.011 for the large-cap funds, 0.032 for the mid-cap funds, and 0.055 for the small-cap funds. Compared with the large- and mid-cap funds, the small-cap funds are clearly driven much less by the world and country factors and much more by their own idiosyncratic factors. Consistent with this pattern, the adjusted R-square declines sharply as the market-cap of the fund declines. On average, the adjusted R-square is 0.970 for the large-cap funds, 0.724 for the mid-cap funds, and 0.415 for the small-cap funds.
Insert Table 3 about here
The variance decompositions presented in Panel B of Table 3 show, among other things, that idiosyncratic factors often account for more than 50% of the small-cap fund variance but less than 5% of the large-cap fund variance. Again, using the Netherlands for example, the global (country) factor accounts for 58.3% (37.9%) of the total variance of the large-cap fund, 35.9% (24.2%) for the mid-cap fund, and 17.2% (11.4%) for the small-cap fund. This means that the idiosyncratic factor accounts for 71.4% of the variance of the small-cap fund, 39.9% of the mid-cap fund, and only 3.8% of the large-cap fund. Similarly for the United States, the idiosyncratic factor accounts for 69.3% of the variance of the small-cap fund, 33.9% of the mid-cap fund, and only 1.6% of the large-cap fund. As can be seen from the last three rows of Panel B, the idiosyncratic risk accounts, on average, for 3% of the variance of the cap funds, 27.3% of the mid-cap funds, and 58% of the small-cap funds. Clearly, compared with large-cap funds, small-large-cap funds are driven more by idiosyncratic factors than global factors.
C. Risk Diversification with Small-Cap Stocks
The preceding analyses strongly suggest that small-cap stocks can be an effective vehicle for global risk diversification. To assess this potential, we perform an experiment that is similar to Solnik (1974). Specifically, we examine how the portfolio variance is reduced as we add more stocks to the portfolio during the simulation period January 1995-December 1999. Due to the limited number of eligible sample stocks, we perform the simulation for the sub-period 1995-1999. We consider three diversification strategies: diversification across (i) U.S. large-cap stocks, (ii) international large-cap stocks, and (iii) international large- and small-cap stocks.
For our simulation, we only consider those stocks whose size membership does not change and for which there are no missing data for the entire simulation period. For U.S. large-cap diversification, we randomly pick 300 stocks from a pool of eligible U.S. large-cap stocks satisfying our criteria. We then randomly and repeatedly draw stocks with replacement from these 300 stocks to form equal-weighted portfolios with different numbers of stocks. The average portfolio variance is computed from 500 replications. Similar methods are applied to international diversification strategies to compute the average portfolio variance with different numbers of stocks. For the international large-cap diversification strategy, we consider the 300 U.S. cap stocks (used for U.S. diversification) plus 600 foreign large-cap stocks. The latter comprises 50 Australian, 50 Canadian, 65 French, 65 German, 50 Hong Kong, 37 Italian, 155 Japanese, 28 Dutch, and 100 U.K. stocks. The number of stocks chosen for each country roughly reflects its relative value share in the world market portfolio during the simulation period. Lastly, for international large- and small-cap diversification, we use 900 large-cap stocks, i.e., 300 U.S. and 600 foreign stocks, plus the entire universe of eligible small-cap stocks, which includes 31 Australian, 124 Canadian, 55 French, 86 German, 27 Hong Kong, 32 Italian, 134 Japanese, 17 Dutch, 53 U.K., and 268 U.S. stocks. The total number of eligible small-cap stocks is 827.
Insert Figure 1 about here
Figure 1 plots the portfolio variance, expressed as a percentage of the variance of a typical (or average) individual stock, as a function of the number of stocks included in the portfolio. We plot the portfolio variances computed using monthly (quarterly) returns in Panel A (Panel B). As can be seen from Panel A, where monthly returns are used, the variance of a fully diversified U.S. large-cap stock portfolio is 17.9% of the individual stock variance. On the other hand, the variance of a fully diversified international large-cap portfolio is 9.2% of the individual stock variance. This proportion is roughly comparable to the 11.7% for international diversification reported by Solnik (1974). Lastly, the variance of a fully diversified international ‘large- and small-cap’ stock portfolio is only about 3.4% of the individual stock variance. Panel B, constructed with quarterly returns, essentially shows the same pattern as Panel A, except that the systematic risk is a bit higher for each of the three diversification strategies.
Clearly, our findings here confirm the previous finding that international diversification reduces the portfolio risk beyond what is possible with domestic stocks. Furthermore, our findings show that augmented international diversification with large- and small-cap stocks will be substantially more effective in reducing the portfolio risk than diversification with large-cap stocks alone.
IV. International Diversification with Cap-Based Funds
Our findings in the previous section strongly suggest that there will be additional gains in terms of further risk reduction when investors diversify with small-cap as well as large-cap stocks. In this section, we extend our analysis to examine if small-cap funds can enhance the mean-variance efficiency of international portfolios. First we briefly describe the mean-variance intersection test for the portfolio efficiency gains and conduct an analysis of the benchmark case, i.e., international diversification with MSCI country indices, against which the augmented diversification strategies will be compared. We then solve for the compositions of optimal international portfolios considering CBFs as well as MSCI country indices, and estimate the ‘additional’ mean-variance gains from international diversification with CBFs. A. The Mean-Variance Intersection Test
To determine if the additional gains, in terms of mean-variance efficiency, from international diversification with CBFs are indeed significant, we must formally test the significance of the difference between the maximum Sharpe ratio attainable without CBFs and that attainable with CBFs. To do so, we employ the Sharpe ratio test proposed by Glen and Jorion (1993). We consider both the cases in which short sales constraints are imposed and those in which they are not. One of the advantages of the Glen-Jorion test is its ability to allow for a large number of ‘new’ and ‘benchmark’ assets. 19
Following Glen and Jorion (1993), we test the significance of the diversification benefit from adding new assets as follows:
19 Unlike the mean-variance spanning tests checking if the mean-variance frontier of the augmented assets (i.e., benchmark assets plus the new assets) coincides with the frontier of the benchmark assets only, the intersection tests performed here check if the two frontiers have one point in common, i.e., an intersection. For a given risk-free rate, the intersection hypothesis tests if the efficient frontier spanned by the augmented assets intersects with that spanned by the benchmark assets at the tangency point. For detailed discussions of this point, refer to de Roon and Nijman (2001).
(5) 2 2 2 1 2 1 ˆ ˆ θ θ T (K N) F ˆ N 1 θ − − + = + ,
where T is the number of observations, K is the number of benchmark assets, N is the number of new assets, and
θ
ˆ
1 andθ
ˆ
2 are the maximum Sharpe ratios attainable by the benchmark assets and augmented assets (benchmark assets plus new assets), respectively. When short sales are allowed, the test statistic follows an F distribution with (T-K-N, N) degree of freedom. When short-sale constraints are imposed, however, the test statistic follows an unknown distribution and should be approximated by simulation. We employ the same simulation methodology used by Glen and Jorion (1993).20 It is noted that the Sharpe ratio test is, in fact, a mean-variance intersection test. Testing whether the maximum Sharpe ratio attainable by benchmark assets is equal to that attainable by augmented assets is equivalent to testing whether the mean-variance frontier spanned by the benchmark assets intersects that spanned by the augmented assets at the tangency point, for the given level of risk-free interest rate.B. Diversification with Country Market Indices: The Benchmark Case
Because we are interested in assessing the ‘additional gains’ from augmented international diversification with small-cap funds, it would be useful to first examine the benchmark case of diversification with country market indices. To that end, we provide basic parameter values for MSCI country stock market indices computed over our 20-year sample period and the composition of optimal international portfolios in Table 4. As can be seen from Table 4, pair-wise stock market correlation ranges from 0.23 to 0.72, with an average of 0.44 during our sample period. The U.S. market has relatively low correlations with Japan (0.26) and Italy (0.27), and relatively high correlations with the U.K. (0.56), the Netherlands (0.60), and Canada (0.72). Neighboring markets tend to have relatively high correlations. For instance, the correlation is 0.67 for France-Germany, 0.69 for the Netherlands-U.K, and 0.72 for
20 Specifically, we derive the expected return, variance, and covariance of both benchmark and new assets from historical data. Then, the expected returns of the new assets are so modified that the new assets are spanned by the benchmark assets. In particular, we modify the expected returns of the new assets to be proportional to their betas to the optimal risky portfolio of benchmark assets. Then, at each simulation experiment, we draw T random samples of joint returns from a multivariate normal distribution with those parameters. From these simulated returns we solve the optimization problem and calculate the test statistic as before. The process is repeated 2,000 times and the 1, 5, and 10%critical values are documented.
U.S. But there are many exceptions to this. Despite a substantial geographical distance, Canada and Australia have a relatively high correlation, 0.60, perhaps reflecting the similar resource-based economies. Despite the geographical proximity, Japan and Hong Kong have a relatively low correlation, 0.24. Similarly, the correlation is relatively low, 0.37, for Italy-U.K. Overall, Japan has the lowest average correlation, 0.29, with other markets and the Netherlands the highest, 0.54. This reflects the relatively insular nature of the Japanese economy and highly multinational nature of the Dutch economy, respectively.
Insert Table 4 about here
During our 20-year sample period, the mean monthly return ranges from 1.01% for Canada to 1.81% for Hong Kong. The standard deviation of returns ranges from 4.29% for the U.S. to 9.74% for Hong Kong. Clearly, Hong Kong is a high-risk and high-return market. The world systematic risk (beta), on the other hand, ranges from 0.83 for the U.S. to 1.22 for Japan. The Sharpe performance measures indicate that the U.S. is the best performing market, closely followed by the Netherlands. Other markets lag substantially behind the two best performing markets in terms of the risk-adjusted performance measure. Canada and Australia register the worst performances in terms of Sharpe measure.
The last two columns of Table 4 provide the compositions of optimal (tangency) international portfolios comprising the MSCI indices. When short-sales are not allowed, the optimal portfolio is dominated by the U.S. and Dutch markets. Specifically, the optimal portfolio consists of investing 53.2% in the U.S., 34.5% in the Netherlands, 7.7% in Italy, 3.1% in Hong Kong, and 1.5% in Japan. We report the Sharpe ratio of the portfolio in the bottom panel of the table. In addition, we report the F-statistic and p-value for testing whether the Sharpe ratio of the optimal portfolio comprising MSCI indices is significantly different from that of MSCI U.S. index. The result shows that the Sharpe performance measure for the optimal international portfolio is 0.243, which is compared with 0.217 for the U.S. market index. As indicated by the F-statistic (p-value) provided in the last row of Table 4, this difference in the Sharpe ratios is found to be statistically insignificant. This means that during our sample period, U.S. investors could not have gained significantly from international diversification with country indices.
When short-sales are allowed, the Canadian, French, and German markets receive negative weights in the optimal portfolio. The Sharpe ratio is a bit higher with short-sales, 0.290. But again, it is statistically insignificantly different from that of the U.S. market index. This result is in contrast to the previous literature that tends to find significant gains from international diversification.21
C. The Optimal Global Asset Allocation
Given that significant gains might be achieved by diversification across international CBFs, we examine the optimal global asset allocation with MSCI country indices and CBFs in a Markowitz framework. In particular, we solve for the optimal international portfolio by maximizing the mean excess return per standard deviation of returns. As a proxy for the risk-free interest rate, we use the average one-month U.S. T-bill rate, 0.554%, over our sample period. The optimal portfolio is thus the one with the highest Sharpe ratio among all feasible portfolios.
Insert Table 5 about here
We first solve for the optimal international portfolio with MSCI country indices and small-cap funds. The results are presented in Panel A of Table 5. When short-sales are not allowed, a realistic constraint in international investment, the optimal portfolio consists of investing 26% in the U.S. MSCI country index and 74% in eight foreign small-cap funds from Australia (1.2%), Canada (22.3%), Germany (10.8%), Hong Kong (4.5%), Italy (9%), Japan (12.5%), the Netherlands (2%), and the U.K (11.7%). Only France and U.S. small-cap funds are excluded from the optimal portfolio.22 Remarkably, no foreign MSCI ‘country index’ receives any positive weight in the optimal portfolio. This particular composition of optimal international portfolio implies that it is more desirable to combine foreign small-cap funds, rather than foreign market indices, with the U.S. market index to enhance the portfolio
21 The same result is found to hold for each sub-period, 1980-1989 and 1990-1999, as well. In other words, the Sharpe ratio of optimal benchmark portfolio (comprising MSCI country indices) is not statistically significantly different from that of the U.S. market index in both sub-periods.
22It was difficult to take a short position in foreign stocks during much of our sample period. In Hong Kong, for instance, investors were allowed to short a small number of large-cap stocks, but not small-cap stocks. In Japan, investors were required, until recently, to receive permission from the Ministry of Finance to short stocks. Even if short-selling is allowed, it can be costly, especially for foreign investors. Refer to Bris, Goetzmann, and Zhu (2006) for a survey of short-sales constraints around the world.
efficiency. The fact that eight out of ten small-cap funds are included in the optimal portfolio reflects the relatively low correlations among these funds. The U.S. small-cap fund is excluded from the optimal portfolio due to a relatively high correlation with the U.S. market index as well as a modest return. France’s small-cap fund is excluded from the optimal portfolio due to its relatively high correlations with other European small-cap funds, especially German and Dutch funds. When short-sales are allowed, on the other hand, all ‘foreign’ small-cap stocks as well as three MSCI country indices, i.e., Hong Kong, the Netherlands, and the U.S., receive positive weights in the optimal portfolio, whereas the U.S. small-cap fund and the remaining MSCI country indices receive negative weights.
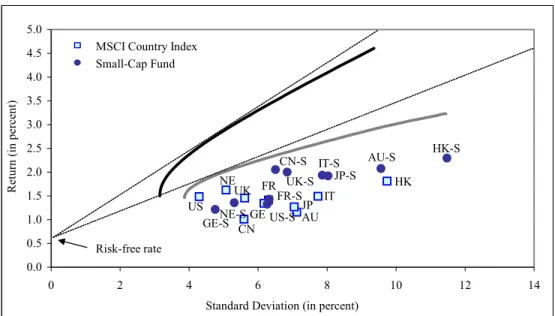
At the bottom of Panel A, we report the mean, standard deviation, and the Sharpe ratio for the optimal international portfolio. The last two rows report the F-statistic and p-value for the null hypothesis that the maximum Sharpe ratio attainable with augmented assets is the same as that attainable with the benchmark assets of ten MSCI country indices. The optimal international portfolio without (with) short-sales has a Sharpe ratio of 0.322 (0.464), which is statistically significantly greater than the Sharpe ratio for the optimal international portfolio comprising only MSCI country indices, 0.243 (0.290), with p-value equal to 0.012 (0.044). Both an increased return and reduced risk contribute to the higher Sharpe ratio for the augmented international optimal portfolio. This means that the gains from the augmented international diversification with small-cap funds are significant. Figure 2 illustrates the preceding analysis. Note from the lower panel of Figure 2 that several small-cap funds are located above the efficient frontier spanned by MSCI country indices.
Insert Figure 2 about here
Panel B of Table 5 reports the composition of the optimal international portfolio for the case in which investors diversify across MSCI country indices and mid-cap funds. When short-sales are not allowed, the U.S. country index receives a dominant weight (52.2%). In addition, country indices of the Netherlands, Hong Kong, and Italy receive positive weights. In contrast to the case of diversification with small-cap funds, only four mid-cap funds are included in the optimal portfolio, with a combined weight of 17.8%. The associated Sharpe ratio is 0.245, which is less than that attainable with small-cap funds and
statistically insignificantly different from that attainable with MSCI country indices only. A similar situation prevails when short sales are allowed. Overall, the extra gains from the augmented international diversification with mid-cap funds are insignificant.
Next, we evaluate the additional gains from international diversification considering both small- and mid-cap funds simultaneously, in addition to MSCI country indices. Panel C of Table 5 provides detailed statistical results. Several interesting findings emerge from this exercise. First, when short sales are not allowed, mid-cap funds receive zero weights in the optimal portfolio, suggesting that mid-cap funds are ‘redundant’ once investors hold country indices and small-cap funds. Second, the U.S. index is again the only country index receiving a positive weight in the optimal portfolio. Eight of the ten small-cap funds receive positive weights; the U.S. and France are the exceptions. Third, because mid-small-cap funds are redundant, the maximum attainable Sharpe ratio by MSCI country indices, mid-, and small-cap funds is the same as that attainable by just MSCI country indices and small-cap funds. Fourth, when short sales are allowed, investors can significantly benefit from short-selling mid-cap funds and thereby increasing investments in small-cap funds and country indices. In the optimal portfolio, mid-cap funds receive a combined weight of -447%, small-cap funds 408%, and MSCI country indices 139%. These rather extreme investment weights stem from the assumption of unrestricted short sales. The optimal portfolio has a Sharpe ratio of 0.624, which is significantly higher than that for any other portfolio that we have considered so far. During our sample period, mid-cap funds only play a significant role in international investment as a shorting opportunity.
In Panel D, we conduct a similar experiment to that of Panel C, except that we replace the MSCI country indices with large-cap funds. Consistent with our prior results that MSCI indices comprise mostly large-cap stocks, we find that the results in Panel D are qualitatively similar to those in Panel C. For example, the Sharpe ratios for the optimal portfolios reported in Panels C and D are, respectively, 0.624 and 0.643. In addition, both Panels C and D show that when short sales are allowed, mid-cap funds as a whole receive a substantially negative weight, while many small-cap funds and large-cap/MSCI country indices receive positive weights. When short sales are not allowed, on the other hand, only small-cap
funds and the U.S. market index are included in the optimal portfolio, while mid-cap funds and the rest of the countries’ indices do not receive any positive weights. 23
Insert Table 6 about here
Table 6 provides a summary of the Sharpe ratio test results for eight sets of benchmark assets and new assets. Column 1 reports the benchmark assets and new assets considered in the test, with the former stated in the first row and the latter in the second row. Columns 2 and 3 report the maximum attainable Sharpe ratios for the benchmark and augmented assets, respectively, with short sales allowed. The test statistic (F-stat) is reported in column 4, with the p-value in the parenthesis. Columns 5, 6, and 7 report the same set of statistics, but with no short sales restrictions imposed. The simulated 1%, 5%, and 10% critical values are reported in the last three columns.
The test results reported in Table 6 can be summarized as follows. First, investors who hold the U.S. market index do not benefit significantly by adding foreign country indices, regardless of whether short sales constraints are imposed. Second, investors who hold the U.S. country index benefit significantly if they add foreign small-cap funds to their portfolio. The p-value derived from the simulated F-statistics shows that this result is robust to short-sales constraints. Third, investors who hold a well-diversified portfolio of international country indices benefit significantly by adding small-cap funds to their portfolio. This result is again robust to short sale constraints. Fourth, investors who hold a well-diversified portfolio of country indices and small-cap funds benefit significantly from adding mid-cap funds to their portfolio only when short sales are allowed. Otherwise, there are no significant gains from adding mid-cap funds.
V. Robustness Check and Discussion
23 We conduct a few more robustness tests on our results. We replicate the analysis of Table 5 for the 1980s and 1990s separately. We find that the gains from augmented diversification with small-cap funds are significant at the 5% level in both sub-periods. Furthermore, we conduct the same test for each 10-year rolling window over our 20-year sample period, with the window moving forward by one month at a time. In total, we have 121 sub-periods. We find that when short sales are (not) allowed, the gains from augmented diversification with small-cap funds are significant at the 10% level or better for 70 (115) of the 121 sub-periods. These results further confirm the robustness of the key findings of our study.
In the preceding sections, we show that investors can significantly benefit from augmented international diversification with small-cap stocks. In this section, we check the robustness of this finding and also discuss a few related issues. In particular, we (i) assess the gains from augmented diversification with conditioning information in both in-sample and out-of-sample periods, and (ii) examine how our results are sensitive to a range of ‘additional costs’ and ‘portfolio constraints’ for small-cap stock investment.
A. Test of Mean-Variance Intersection with Conditioning Information
Thus far, our tests of the mean-variance intersection are ex post in nature. Hansen and Richard
(1987) point out the importance of the mean variance efficiency test with conditioning information. While discussing the impact of omitting conditioning information, they prove that any return on the unconditional mean-variance frontier must also be on the conditional frontier, but the converse is not true. Similarly, MacKinlay (1995) and Hansen and Jagannathan (1991) also discuss how the conditioning information is important in testing the mean-variance efficiency.
As has been shown in the literature, e.g., Harvey (1991), several factors can be useful in predicting stock returns. The most commonly proposed factors are dividend yield, default premium, and term premium. In addition to the above factors, we also include Fama-French factors and the momentum factor. We now incorporate information available from these factors to check the robustness of our results in both in-sample and out-of-sample periods.
De Roon and Nijman (2001) and de Roon, Nijman, and Werker (2003) derive an algorithm which can be applied to check the robustness of our results with conditioning information. In particular, they show that with the assumption of the existence of a risk-free rate, their unconditional test is equivalent to the Sharpe ratio test described by Glen and Jorion (1993). More importantly, they show that conditional tests can yield quite different results from unconditional tests. We thus examine the robustness of our results with a set of instrumental variables. We use the seven factors mentioned above and conduct an
experiment that is similar to the one described in de Roon et al. (2003).24 They show that the unconditional test can be performed by regressing the excess return of each of the new assets on the excess returns of all benchmark assets and test whether the regression intercepts are jointly zero.
In the conditional test, the optimal portfolio weights of the benchmark assets and new assets depend not only on the historical mean return and variance-covariance matrix but also on the information available from the instruments. The conditional test involves regressing the excess return of each of the new assets (i.e., small-cap funds in our case) and their cross-products with the instruments on the excess returns of all benchmark assets (i.e., MSCI indices in our case) as well as their cross-product with the instruments. The rejection of the hypothesis that the regression intercepts are jointly zero would indicate a rejection of the null hypothesis that the mean-variance frontier spanned by the benchmark assets intersects that spanned by the augmented assets at the tangency point, for the given level of risk-free interest rate.
In addition to in-sample tests, we also conduct out-of-sample tests. We use a five-year rolling window to generate a return series for both the unconditional and conditional optimal portfolios, considering only the benchmark assets. The optimal portfolio weights are determined using the past five-year data. The portfolio is then held for one month. This procedure is repeated each month on a five-five-year rolling basis, generating out-of-sample holding period returns for the optimal portfolio for months 61 through 240. The out-of-sample unconditional tests are carried out by first regressing the excess return of each of the new assets on the excess return of the unconditional optimal portfolio comprising benchmark
24 In each country, we use MSCI country index return to proxy for the market return. In addition, to form SMB, HML, and momentum factors, we construct small, big, value, and growth portfolios based on individual stocks’ market capitalization value and book-to-market ratio in December of the previous year, and form winner and loser portfolios based on individual stocks’ cumulative return in the past 2-12 months. The small (large)-cap portfolio represents the 30% of stocks with the smallest (largest) market capitalization in the country. We calculate the SMB factor by subtracting the return of the large-cap portfolio from that of the small-cap portfolio. HML and momentum factors are constructed analogously except that the SMB and HML factors are updated once a year, while the momentum factor is updated every month. The dividend yield is obtained from Datastream, which represents the dividend yield on the Datastream country index. The term premium is the interest rate spread between the long-term and short-term government bonds for each country, except for Hong Kong. Since the data on the long-term government bond is not available for Hong Kong for our sample period, we proxy its term premium by the U.S. term premium, which is the difference between the Treasury bond yield composite over 10 years and the three month T-bill auction average. In addition, since the default premium is generally not available in countries outside the U.S., we use the U.S. default premium - the difference between the yield on Moody’s Baa-rated bonds and the yield on Moody’s Aaa-rated bonds - for all the sample countries in our analysis.
assets and testing the hypothesis that the intercepts are jointly zero. The conditional test, on the other hand, requires regressing not only the excess return of each of the new assets but also the cross-products of the former with the chosen instruments on the excess return of the conditional optimal portfolio.
Insert Table 7 about here
Table 7 reports the Wald statistics for unconditional and conditional tests in Panels A and B, respectively. The Wald statistic is calculated as ˆ'Var( )ˆ' 1ˆ'
T×λ λ − λ , where T is the number of
observations, ˆλ is the estimated vector of regression intercept, and Var( ˆλ) is the variance-covariance matrix of the intercept estimates. The test statistic follows asymptotically x2distribution, with the degree of freedom equal to the number of test assets plus the number of instruments if there is any. Panel A shows that unconditionally, mean-variance investors benefit significantly from diversification with small-cap stocks. The Wald statistic is significant at the 1% level for both in-sample and out-of-sample tests. In Panel B, we describe the instrument(s) used in the test in the first and fourth columns and report the Wald statistics for the in-sample (out-of-sample) tests in the second and fifth (third and sixth) columns. Superscripts a, b, and c denote the 1%, 5%, and 10% significance levels, respectively. In the conditional test, since the number of equations for estimation increases by a factor of 10 as we increase the number of instruments, we conduct the test using at most two instruments at a time. The results show that the gains from augmented diversification with small-cap funds are robust to the incorporation of conditioning information. When only one instrumental variable is used, the result is significant at the 1% level in all cases, with the sole exception of the out-of-sample test with the momentum factor. But when additional information is used together with the momentum factor, the results are significant at least at the 10% level. Again, the results are all significant at the 1% level when other pairs of instrumental variables are used.25 B. Effects of Additional Costs and Portfolio Constraints for Small-cap Stocks
25 Table 7 shows that among all instruments used, the mean-variance intersection test yields the smallest Wald-statistic for the momentum factor in both in-sample and out-of-sample tests. Since we use the same instrument for the benchmark assets (i.e., MSCI country indices) and for the new assets (i.e., small-cap funds), this result seems to suggest that the momentum factor is a relatively more effective instrument for country indices than for small-cap funds. Although this result stands out, its root cause remains unclear to us.
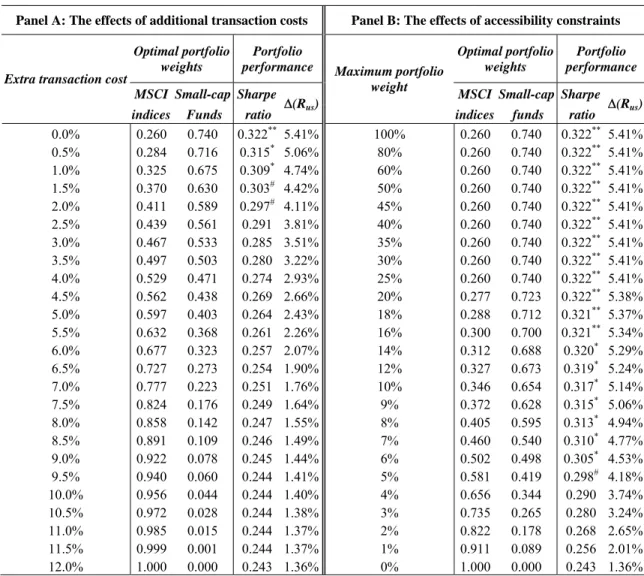
So far, we have assumed that investors do not face any extra costs or constraints when they invest in small-cap funds. In reality, however, investors may face higher transaction costs or constrained access to small-cap funds. It is thus important to examine how these constraining factors may affect the gains from international diversification with small-cap stocks.
B.1. Effect of Additional Costs
If investors incur excessive transaction costs, the extra gains from international diversification with small-cap stocks can be illusory. To examine this issue, we compare the actual trading costs of small- vs. large-cap stocks. In an extensive study of trading costs in 37 countries, Chiyachantana et al. (2004) document that the difference in one-way trading costs between small-cap and large-cap stocks averages 0.55% to 0.64% based on the 2001 institutional transaction data, considering both explicit commission costs and implicit price impact costs. In addition, they show that trading costs have been steadily declining over time. Their finding suggests that for 100% annual turnover, for instance, the ‘additional’ trading costs for small-caps can be as high as 1.10%-1.28%. For passively managed index-style funds with lower turnover ratios, the additional trading costs will be less than the range.26 The additional costs will be even lower for investors who pursue ‘buy and hold’ strategies.
For individual investors who use mutual funds for diversification, expense ratios are an important component of investment costs. It would thus be instructive to examine the expense ratios of existing mutual funds. To that end, we examine the CRSP mutual fund database that covers all U.S.-based mutual funds and is free from survivorship bias. We find that during the period 1992-1999, the average expense ratio is 1.94% for small-cap oriented international funds (as classified by Strategic Insight) and 1.84% for
the rest of international funds. Thus, expense ratios can be higher for small-cap funds than for large-cap funds but the difference does not appear to be significant.
To assess the effect of additional costs for investing in small-cap stocks, we impose what amounts to a proportional tax on small-cap funds at the end of each year. In our empirical experiment, we reduce
26 Examination of the turnover ratios for existing mutual funds shows that the turnover is likely to be less than 100%. For instance, according to Fidelity Mutual Fund Guide2003, the turnover for Fidelity fund family is 85% for