Evaluation of Finite-Rate Gas/Surface Interaction
Models for a Carbon Based Ablator
Yih-Kanq Chen*
NASA Ames Research Center, Moffett Field, CA 94035-1000 and
Tahir Gökçen†
ERC, Inc., NASA Ames Research Center, Moffett Field, CA 94035-1000
Two sets of finite-rate gas/surface interaction model between air and the carbon surface are studied. The first set is an engineering model with one-way chemical reactions, and the second set is a more detailed model with two-way chemical reactions. Each of these two proposed models intend to cover the carbon surface ablation conditions including the low temperature rate-controlled oxidation, the mid-temperature diffusion-controlled oxidation, and the high temperature sublimation. The prediction of carbon surface recession is achieved by coupling a material thermal response code and a Navier-Stokes flow code. The material thermal response code used in this study is the Two-dimensional Implicit Thermal-response and Ablation Program, which predicts charring material thermal response and shape change on hypersonic space vehicles. The flow code solves the reacting full Navier-Stokes equations using Data Parallel Line Relaxation method. Recession analyses of stagnation tests conducted in NASA Ames Research Center arc-jet facilities with heat fluxes ranging from 45 to 1100 w/cm2 are performed and compared with data for model validation. The ablating material used in these arc-jet tests is Phenolic Impregnated Carbon Ablator. Computational predictions of surface recession and shape change are in good agreement with measurement for arc-jet conditions.
* Aerospace Engineer, Thermal Protection Materials Branch, MS 234-1, Senior Member AIAA. †Senior Research Scientist, ERC, Inc., Associate Fellow AIAA.
Nomenclature
B’ = normalized ablation rate
C = mass fraction
D = diffusion coefficient, m2/s = enthalpy, J/kg
kf = forward reaction rate, (units vary)
kt = thermal conductivity of translational temperature, W/m-K
kv = thermal conductivity of vibrational temperature, W/m-K
M = molecular weight, kg/kmol = mass flux, kg/m2-s
p = pressure, Pa
= in-depth conductive heat flux at surface, W/m2 = convective heat flux at surface, W/m2
= radiative heat flux at surface, W/m2 rc = corner radius of the model, cm rn = nose radius of the model, cm
= universal gas constant, 8.3143 J/mol-K
= temperature, K
Δ
= maximum allowed change on surface temperature, K= translational temperature, K = vibrational temperature, K = environment temperature, K = mass injection velocity, m/s
= thermal velocity, m/s
= source term of gas-surface interactions, kmol/m2-s h m cond q conv q rw q
R
T maxT
tT
vT
T
vv
wˆ= absorptance = emissivity
= total density, kg/m3
= active site density at the surface, mol/m2 = Stefan-Boltzmann constant, W/(m2-K4) subscripts = char = pyrolysis gas = gas species = wall
I. Introduction
The function of an atmospheric entry vehicle’s Thermal Protection System (TPS) is to protect underlying materials from the intense aerothermal heating associated with hypersonic entry. Typical ablating TPS materials pyrolyze and ablate at high temperature for mass-efficient rejection of the aerothermal heat load. For design and sizing of ablating TPS materials, it is imperative to have reliable numerical procedures which can accurately compute the vehicle aerothermal environment, the material surface ablation, and the material internal thermal response. It has been demonstrated that accurate prediction of ablative heat flux requires a fluid-solid shape change coupling simulation.[1,2] In our early fluid-solid shape change coupling computations, the ablative carbon surface was assumed to be at chemical equilibrium. Chemical equilibrium is a good assumption for many space entry applications, but it may not be valid for all conditions. Furthermore, the aerothermal environments computed by Data Parallel Line Relaxation method (DPLR)[3] were for a fully catalytic non-ablating surface. Thus, an engineering correlation with a blowing reduction parameter had to be introduced in the Two-dimensional Implicit Thermal-response and AblatioN program (TITAN)[4] simulation to take into account the effect of mass injection on reduction of convective heat flux. A mass transfer coefficient also had to be defined based on the heat transfer coefficient under the assumption of a relatively thin boundary layer for the computation of char recession rate. In our recent studies, integrated fluid-material response analyses with finite-rate gas-surface interactions were performed. The coupling procedure, considering surface thermal chemistry and shape change, was achieved by using either explicit or implicit scheme [5,6]. However,
s
c g i wfor explicit coupling simulations with surface thermal chemistry included, numerical oscillation of predicted surface temperature was observed at conditions with relatively high surface heat fluxes. The time step size for updating the interface boundary conditions had to be reduced to minimize the numerical oscillation. Consequently, the total computational time required to complete a simulation increased significantly. Additionally, for some explicit coupling simulations, the numerical oscillation of surface temperature became so severe that a converged solution was not obtained. An implicit approach was proved to be more efficient for performing fluid-solid surface thermal chemistry coupling for the high surface heating arc-jet environments and the trajectory-based simulations, such as that of Stardust Earth Reentry Capsule.
The air-carbon surface interactions studied in our previous work were mostly in the so called diffusion-controlled oxidation or low sublimation regime. For surface temperatures below the diffusion-controlled regime, the net carbon oxidation rates have to be determined by both the forward and backward reaction rates. This is the so called rate-(or kinetic) controlled carbon oxidation. The engineering model developed by Park’s[7] one-way surface chemical reaction may be inadequate to precisely predict the carbon recession if the backward surface reaction rates are significant. The two-way surface reaction model developed by Zhluktov and Abe[8] were shown to be far under-predicting both the carbon recession rate and surface heat flux even if the surface temperature is in the diffusion controlled regime.[5]
The primary objective of this work is to enhance the existing finite-rate carbon/air surface chemistry models to improve the prediction accuracy of surface recession and surface heat flux for carbon based ablators. These revised gas/surface interaction (GSI) models will be applicable to carbon oxidation at both rate and diffusion controlled conditions as well as carbon sublimation at a much elevated surface temperature. The DPLR/TITAN coupled simulation system is used in the present work to predict the ablator surface recession and shape change. The boundary conditions with general non-equilibrium finite-rate chemistry for gas/surface interactions implemented in the DPLR code by MacLean[9] is adopted to predict char mass injection rate. The surface species mass balance is thus performed in DPLR, and the surface energy balance is performed in TITAN. The hot-wall ablating convective heat flux is directly computed in DPLR based on the surface temperature and pyrolysis gas injection rate computed in TITAN. Coupled fluid-material response analyses of stagnation tests conducted in NASA Ames Research Center arc-jet facilities with heat fluxes ranging from 45 to 1100 w/cm2 are performed using the GSI models and their rates proposed in this work. The ablating material used in these arc-jet tests is a Phenolic Impregnated Carbon Ablator (PICA).[10] Computational
predictions of surface recession, and shape change for arc-jet test conditions of Small Probe ReentryInvestigation for TPS Engineering (SPRITE)[12] test article are also performed and compared with the measurement.
II. Gas/Surface Interactions
Two sets of non-equilibrium finite-rate gas-surface interaction models between air and carbon surface are proposed in this work. One-way surface chemical reactions are considered in the first model. The rates of backward reactions are assumed to be negligible. This one-way reaction model is obtained by modifying the carbon surface ablation model developed by Park[7]. In the original Park’s model, there were not enough surface reactions to account for surface catalysis and thus the surface heating was under-predicted. Additionally, its nitridation reaction does not appear to agree with available data. In our previous work, the nitrogen recombination reaction was proposed, and the rate of carbon sublimation was adjusted to be consistent with measurements from the arc-jet tests. The carbon surface is assumed to be fully catalytic for nitrogen recombination reaction.
The second model is more complex compared with the first one. It contains two-way surface reactions. This model is derived from the approach developed by Zhluktov and Abe.[8] Zhluktov’s model includes surface catalysis, oxidation, and sublimation at the carbon surface. The reactions considered in the original model by Zhluktov and Abe were found to be inadequate to predict both surface heating and surface recession because some key reactions were not considered. Two additional reactions are included in this work: one is for the oxidation reaction between molecular oxygen and the carbon surface, and the other is the recombination of nitrogen atoms. The forward and backward reaction rates computed in our study use the general formulation developed by Marschall,[13] in which the forward reaction rates (Kf) were written in 5 different forms. They are Eley-Rideal, Sublimation, Adsorption, Arrhenius, and Langmuir-Hinschelwood. The proposed gas/surface reactions and their forward reaction rate constants are listed in Tables 1 and 2:
GSI Model I:
𝐾𝑓 Reaction Type Source
1 O + C(b) → CO
0
.
1
4
v
O Eley-Rideal Park(99)[7]2 O2 + 2C(b) → 2CO
5
.
0
4
2
v
O Eley-Rideal Park(99)[7] 3 2N → N20
.
1
4
v
N Eley-Rideal CG(13)[5] 4 3C(b) → C3
C Te
RT
v
4 3 10 0841 . 9 14)
10
27
.
8
(
4
Sublimation CG(13)[5] 5 C3 → 3C(b)25
.
0
4
3
v
C Eley-Rideal Park(99)[7] GSI Model II:𝐾𝑓 Reaction Type Source
1 O + E(s) ↔ O(s)
0
.
1
4
s Ov
Adsorption ZA(99)[8] 2 2O(s) ↔ O2 + 2E(s)
Te
T
4 10 079 . 3 1010
3.583
Arrhenius ZA(99)[8] 3 O2 + E(s) ↔ O + O(s)
T s Oe
v
4 2 10 419 . 14
Eley-Rideal ZA(99)[8] 4 O2 + E(s) + C(b) ↔ CO + O(s)
T s Oe
v
3 2 10 443 . 15
.
0
4
Eley-Rideal * 5 O(s) + C(b) ↔ CO + E(s)
Te
T
4 10 999 . 3 1110
080
.
2
Arrhenius ZA(99)[8]6 O + O(s) + C(b) ↔ CO2 + E(s)
T s Oe
v
3 10 0 . 24
Eley-Rideal ZA(99)[8]7 2O(s) + C(b) ↔ CO2 + 2E(s)
Te
T
4 10 9998 . 3 1510
583
.
3
Arrhenius ZA(99)[8] 8 C + E(s) ↔ E(s) + C(b)0
.
1
4
s Cv
Eley-Rideal ZA(99)[8] 9 C2 + 2E(s) ↔ 2E(s) + 2C(b)0
.
1
4
2 2
s Cv
Eley-Rideal ZA(99)[8] 10 C3 + 3E(s) ↔ 3E(s) + 3C(b)25
.
0
4
3 3
s Cv
Eley-Rideal ZA(99)[8] 11 N + E(s) ↔ N(s)0
.
1
4
s Nv
Adsorption ZA(99)[8] 12 N2 + E(s) ↔ N + N(s)
T s Ne
v
4 2 10 6597 . 74
Eley-Rideal ZA(99)[8] 13 N(s) + N(s) ↔ N2 + 2E(s)
s Nv
2310
0221
.
6
4
2
Langmuir-Hinschelwood *In the above proposed reactions, C(b) represents the solid carbon species, E(s) is the numbers of empty surface sites, and O(s) and N(s) are sites occupied by oxygen and nitrogen, respectively. In computing the forward reaction rate constants, is the active site density, and is equal to . Backward reaction rate constant can be calculated from chemical equilibrium constant and forward reaction rate constant for each two-way reaction.
The DPLR code was enhanced by MacLean based on Marschall’s formulation to solve the surface species mass balance equation for the finite-rate gas surface reactions. The detail of MacLean’s implementation can be found in Ref. 9. All flow simulations presented in this work are performed using this version of DPLR code (DPLR/4.03.1).
There are twenty two gas phase chemical species used in this study for the simulation of PICA and air-Argon interactions. None of the ion species are considered. The chemical species are CO2, CO, N2, O2, NO, C2, C3, CN, H2, HCN, C, N, O, H, CH, CH2, C2H, C2H2, C4, C3H, C4H, and Ar. The gas phase chemical reactions and their rates adopted in the DPLR simulations are listed in Table 3.
s
𝐾𝑓 = 𝐴𝑇𝑛𝑒−𝑇𝑎⁄𝑇 A, cc/mol/s n Tn,K Source 1.* CO2 + M ↔ CO + O + M 6.9×10²¹ -1.5 63275 PH(94)[14] M = C, N, O 1.4×10²² -1.5 63275 PH(94)[14] 2.* CO + M ↔ C + O + M 2.3×10²⁰ -1.0 129000 PH(94)[14] M = C, N, O 3.4×10²⁰ -1.0 129000 PH(94)[14] 3.* N2 + M ↔ N + N + M 7.0×10²¹ -1.6 113200 PH(94)[14] M = C, N, O 3.0×10²² -1.6 113200 PH(94)[14] 4.* O2 + M ↔ O + O + M 2.0×10²¹ -1.5 59750 PH(94)[14] M = C, N, O 1.0×10²² -1.5 59750 PH(94)[14] 5.* NO + M ↔ N + O + M 5.0×10¹⁵ 0 75500 PH(94)[14] M = C, N, O 1.1×10¹⁷ 0 75500 PH(94)[14] 6.* C2 + M ↔ C + C + M 3.7×10¹⁴ 0 69000 PH(94)[14] 7. C3 + M ↔ C2 + C + M 6.3×10¹⁶ -0.5 101200 BL(92)[15] 8. CN + M ↔ C + N + M 2.5×10¹⁴ 0 71000 PH(94)[14] 9. H2 + M ↔ H + H + M 2.2×10¹⁴ 0 48300 SB(93)[16] 10. NO + O ↔ O2 + N 8.4×10¹² 0 19450 PH(94)[14] 11. N2 + O ↔ NO + N 6.4×10¹⁷ -1.0 38370 PH(94)[14] 12. CO + O ↔ O2 + C 3.9×10¹³ -0.18 69200 PH(94)[14] 13. CO2 + O ↔ O2 + CO 2.1×10¹³ 0 27800 PH(94)[14] 14. CO + C ↔ C2 + O 2.0×10¹⁷ -1.0 58000 PH(94)[14] 15. CO + N ↔ CN + O 1.0×10¹⁴ 0 38600 PH(94)[14] 16. N2 + C ↔ CN + N 1.1×10¹⁴ -0.11 23200 PH(94)[14] 17. CN + O ↔ NO + C 1.6×10¹³ 0.10 14600 PH(94)[14] 18. CN + C ↔ C2 + N 5.0×10¹³ 0 13000 PH(94)[14] 19. HCN + H ↔ CN + H2 8.0×10¹¹ 0.0167 85537 He(67)[17] 20. CH + M ↔ C + H + M 1.9×10¹⁴ 0 33700 DH(92)[18] 21. CH2 + M ↔ C + H2 + M 1.3×10¹⁴ 0 29700 DH(92)[18] 22. CH2 + M ↔ CH + H + M 4.0×10¹⁵ 0 41800 DH(92)[18] 23. C2H + M ↔ C2 + H + M 1.74×1035 -5.16 57400 KR(97)[19] 24. C2H2 + M ↔ C2H + H + M 6.96×1039 -6.06 67130 KR(97)[19] 25. C2 + C2 ↔ C3 + C 3.2×10¹⁴ 0 0 KR(97)[19] 26. C2 + H2 ↔ C2H + H 6.6×10¹³ 0 4030 KR(97)[19] 27. CH2 + C ↔ CH + CH 1.62×10¹² 0 23600 M(67)-NIST[20] 28. CH2 + CH2 ↔ C2H2 + H2 1.58×10¹⁵ 0 6010 Ba(95)-NIST[20] 29. CH2 + C ↔ C2H + H 5.0×10¹³ 0 0 DH(92)[18] 30. CH2 + C2H ↔ CH + C2H2 1.81×10¹³ 0 0 TH(86)[21] 31. CH + CH ↔ C2H + H 1.5×10¹⁴ 0 0 DH(92)[18] 32. CH + C2H ↔ C2H2 + C 1.0×10¹⁴ 0 0 DH(92)[18] 33. CH2 + CH2 ↔ C2H2 + H + H 2.0×10¹⁴ 0 5530 Ba(95)-NIST[20] 34. C2 + C2 + M ↔ C4 + M 1.0×1027 -3.0 0 KS(92)[22] 35. C + CH ↔ C2 + H 5.0×10¹⁴ 0 0 KR(97)[19] 36. C + C2H ↔ C3 + H 7.0×10¹⁴ 0 0 KR(97)[19] 37. C2 + CH ↔ C3 + H 2.0×10¹⁴ 0 0 KR(97)[19] 38. C2 + C2H ↔ C4 + H 1.2×10¹⁴ 0 0 KR(97)[19] 39. CH + H ↔ C + H2 1.1×10¹⁴ 0 0 KK(93)[23] 40. CH2 + H ↔ CH + H2 1.1×10¹⁴ 0 0 KK(93)[23] 41. C2H + C2H ↔ C2H2 + C2 1.0×10¹³ 0 0 KS(92)[22] 42. C + C2H2 ↔ C3H + H 4.0×10¹⁴ 0 6000 KK(93)[23] 43. C2 + C2H2 ↔ C4H + H 1.0×10¹⁴ 0 0 KS(92)[22] 44. C2 + C4H ↔ C2H + C4 1.2×10¹⁴ 0 0 KS(92)[22]
45. C2H + C2H ↔ C4H + H 1.0×10¹⁴ 0 0 KS(92)[22] 46. C3H + H ↔ C3 + H2 1.0×10¹⁴ 0 0 KK(93)[23] 47. C4H + H ↔ C4 + H2 2.0×10¹³ 0 0 KS(92)[22] 48. H + C4 + M ↔ C4H + M 1.74×1037 -5.5 0 KS(92)[22] 49. CH + CH ↔ C2 + H + H 1.0×10¹⁴ 0 0 KK(93)[23] 50. C2H + H2 ↔ C2H2 + H 7.4×10¹⁴ 0 3350 KR(97)[19]
III. Surface Thermal Chemistry Coupling Simulation
The finite-rate gas-surface interaction models proposed in this work are implemented by means of the surface thermal chemistry coupling between DPLR and TITAN. The interface between a TPS material and its surrounding flow field can be defined by solving species mass conservation and energy balance equations. Species mass conservation at the surface of TPS material is written as:[24]
(1)
The first term on the left-hand side is mass transfer through diffusion, and the second term is mass transfer due to convection. On the right-hand side are the source terms due to gas-surface interaction and pyrolysis gas injection. Based on global mass balance at the surface, the following equation for the total mass blowing rate is expressed as:
(2)
The total convective heat flux to the surface for the flow field that includes a two-temperature model is given as:
. (3)
Energy conservation equation at the surface is written as
𝑞𝑐𝑜𝑛𝑣+ 𝑚̇ (ℎ𝑐 𝑐− ℎ𝑤) + 𝑚𝑔̇ (ℎ𝑔− ℎ𝑤) + 𝛼𝑤𝑞𝑟𝑤− 𝜎𝜀𝑤(𝑇𝑤4− 𝑇∞4) − 𝑞𝑐𝑜𝑛𝑑= 0 (4)
The first term in Equation (4) is the total convective heat flux, the second and third terms represent the heat of ablation, the fourth and fifth terms are radiation absorption and emission, respectively, and the final term is the rate of heat conduction into the TPS material.
To obtain the solutions for Equations (1) to (4) requires computations of thermal and species diffusion rates in the flow field at the surface as well as thermal diffusion and pyrolysis gas injection rates of TPS material at the surface.
g i g i i i w i i C C M w m C D ˆ ,
g c wm m
i i i v v t t conv k T k T h D C q
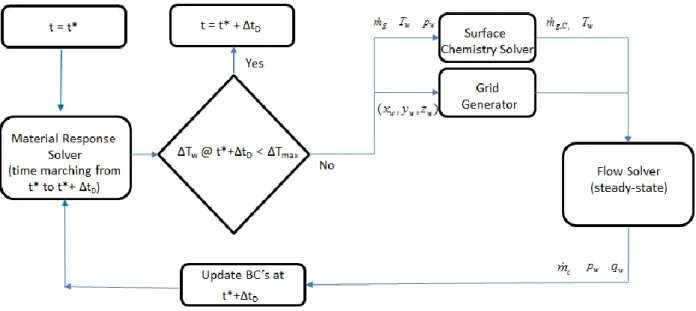
In our DPLR/TITAN coupled simulation, the governing equations for fluid and solid are solved separately, and Equations (1) to (4) have to be solved either in the flow code or in the material response code. Thus, communication between two codes needs to be established for exchanging information on surface thermal chemistry and shape change. For a general finite-rate surface boundary condition, the species mass conservation equation is solved with flow-field governing equations and the total energy balance equation is solved with solid material governing equations. The detail implementation of surface species mass conservation equation (Eq. 1) solved with DPLR was discussed in the work of MacLean. Surface thermal chemistry and shape change have to be shared between the flow solver (DPLR) and the material solver (TITAN) using either explicit or implicit approach. The schematic diagram in Figure 1 depicts how this coupled simulation is performed. The pyrolysis gas is assumed to be at chemical equilibrium before being injected into the adjacent air. This assumption was proved to be reasonable for conditions studied in this paper.[25] The computational grids for both flow field and TPS material are reconstructed based on the shape change predicted by the material response code, and the free stream conditions are also updated according to the flight trajectory. For arc-jet simulations, the free stream conditions remain unchanged during the exposure time.
IV. Results
The ablator simulations presented in this section include two parts. In the first part, we discuss the computation of stagnation models. One group of stagnation models is with relatively low arc stream total enthalpy, between 5 and 12 MJ/Kg, for which tests were conducted in the Aerodynamic Heating Facility at NASA Ames Research Center [26]. The other group of stagnation models with relatively high stream total enthalpy from 15 to 30 MJ/kg, for which tests were conducted in the Interactive Heating Facility at NASA Ames Research Center[27]. In the second part, the simulations of SPRITE test model, which is a 55-deg half -angle spherical cone with stream total enthalpy ranging from 5 to 26 MJ/kg, are presented. The computations in the first part focus on the prediction of total stagnation recession, and those performed in the second part focus on the analysis of both surface recession and shape change. The GSI models discussed early in this paper are examined and the recession predictions are compared with the measurement to understand the accuracy of these proposed GSI models. The coupled DPLR/TITAN simulation system developed in our previous work is used to perform all the computations presented in this section.
Part 1:
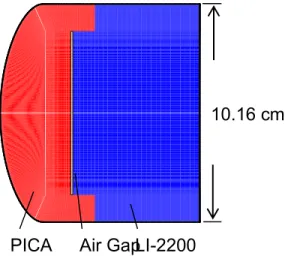
The purpose of performing stagnation model simulation is to examine the proposed carbon/air interaction models, which include a one-way reaction model (Model I) and a two-way reaction model (Model II). The arc-jet tests selected for computations in Part 1 have stagnation heat fluxes from 45.2 to 1100 w/cm2, which is sufficient to cover the rate controlled and diffusion controlled carbon surface oxidation, as well as carbon sublimation. Five of the test conditions, with relatively low total enthalpy (below 12 MJ/kg), selected from the Mars Science Laboratory (MSL) test series have stagnation heat fluxes of 45.2, 72.8, 114, 133, and 236 W/cm2. The other seven high enthalpy test conditions (above 15 MJ/kg ) with heat fluxes of 107, 169, 246, 395, 552, 694, and 1102 W/cm2 are obtained from the Orion Thermal Protection Systems Advanced Development Project (TPS ADP) test series. The arc-jet test stream conditions of these selected cases are listed in Tables 1 and 2 for the low enthalpy MSL and the high enthalpy TPS ADP, respectively. Thus, the oxygen molecules may not be fully dissociated in the low enthalpy MSL arc-jet stream, and are fully dissociated in the high enthalpy TPS ADP cases. Figure 2 shows the shape of stagnation model used in this part of simulation. The nose radius equals to the model diameter, and the sides are cylindrical. This is the so called “iso-q” geometry (rn = 5.08 cm, and rc/rn = 1/16). The test material is PICA, and the model holder is made of LI-2200. There is an air gap with the size of 1.5 mm in-between the back face of PICA and the front side of LI-2200.
Two-block grid system is used for both DPLR (99 × 159 and 23 × 159) and TITAN (120 × 60 and 40 × 80) simulations. The grid adaption option is turned on to perform grid alignment with the bow shock wave. The boundary condition index used in DPLR allows the user to specify surface species mass injection rate, temperature, and finite-rate surface reactions.The implicit coupling approach between DPLR and TITAN is used to predict PICA surface recession.[6]
Table 1: Low enthalpy MSL arc-jet cases selected for analysis. Case number Stagnation point heat flux,
W/cm2
(cold wall)
Stagnation point pressure, kPa Exposure time, s Total enthalpy MJ/kg 1 45.2 4.88 240 5.5 2 72.8 8.85 120 6.4 3 114 20.9 80 5.9 4 133 31.6 80 6.1 5 236 25.0 35 11.1
Table 2: High enthalpy Orion TPS ADP arc-jet cases selected for analysis. Case number Stagnation point heat flux,
W/cm2
(cold wall)
Stagnation point pressure, kPa Exposure time, s Total enthalpy MJ/kg 1 107 2.3 55 15.2 2 169 5.0 60 17.0 3 246 8.5 42 19.3 4 395 17.2 34 21.4 5 552 27.3 30 23.3 6 694 31.0 27 29.2 7 1102 84.4 10 25.6
Figure 2. Geometry and material map of model used in the arc-jet tests.
PICA
Air Gap
LI-2200
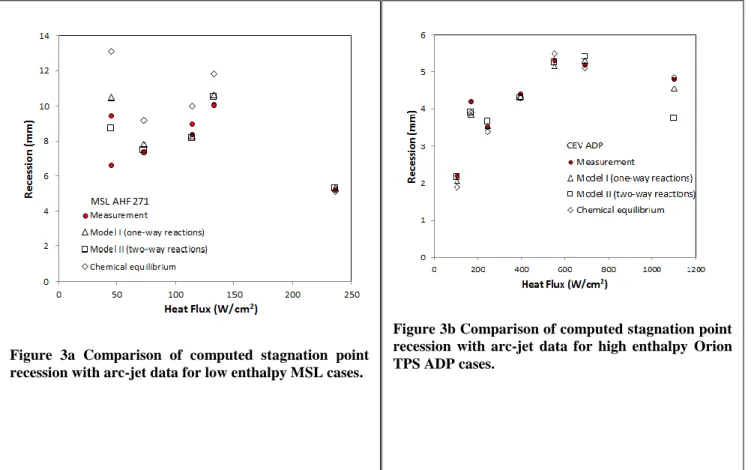
The comparison of predicted stagnation point recession with arc-jet data for the low enthalpy (MSL) group is shown in Fig. 3a. The circles in red represent the post arc-jet test measurement. Three different models of surface chemistry are used for recession predictions. The first one is the chemical equilibrium surface model (diamonds) [27], the second one is Model I with one-way rate GSI (triangles), and the third one is Model II with two-way finite-rate GSI (squares). The chemical equilibrium surface model is established based on the pre-genefinite-rated B’ tables for PICA exposed to air/Argon mixture. The chemical equilibrium model over-predicts the recession by about 35% for the heat flux condition of 45 W/cm2, and by about 25% for the heat flux condition of 73 W/cm2. This result is expected because carbon surface oxidation for such low surface heating conditions is not likely to be in chemical equilibrium and needs to be determined by the finite-rate computation. For the heat flux conditions of 114 and 133 W/cm2, the recession predictions using chemical equilibrium model are about 20% higher than the arc-jet data, and for the 236 W/cm2 case, chemical equilibrium recession prediction is about 5% higher than the data. Generally speaking, the recession predictions using Model I are slightly higher than those using Model II. Model II appears to agree the best with arc-jet data among three different surface chemistry models, especially at the lowest heat flux condition, 45.2 W/cm2. Chemical equilibrium surface model is commonly used for the recession prediction of many arc-jet test simulations because it is the simplest and least expensive approach, but also it produces reasonable recession predictions for most cases. In the lowest heat flux condition, where the backward reaction rates can no longer be ignored, a two-way reaction model thus has to be considered. In Fig. 4a, predicted temperature and pressure distributions along stagnation streamline for condition with heat flux of 45.2 W/cm2 are presented. The stagnation pressure is near 5 KPa. The maximum translational temperature is around 4500 K, and that of vibrational temperature is 4000 K. Figure 4b shows the distributions of selected species mass fraction (N2, O2, NO, CO, and O) along stagnation streamline. The black lines are the predictions using the gas/surface interaction Model II. The red lines are those predictions using a chemical equilibrium surface assumption, which is achieved by increasing the reaction rates six orders of magnitude. The surface recession computed using this approach is the same as that computed using the B’ tables[27]. The near surface CO concentration for chemical equilibrium model is higher than that for finite-rate model. Consequently, the near surface O2 concentration for chemical equilibrium model is lower than that for finite-rate model. All of the atomic oxygen is consumed at the carbon surface.
Similar comparison of computed stagnation point recession with arc-jet data for the high enthalpy group (CEV ADP) is presented in Fig. 3b. The chemical equilibrium model has been presented in the work of Milos[27], and it was shown that the predictions using chemical equilibrium model agreed reasonably well with the data for these selected test conditions. In the first six conditions, the carbon surface oxidation is controlled by the oxygen diffusion rates, and in the seventh condition, the carbon recession is dominated by the process of sublimation. For the diffusion controlled conditions, both Model I (triangles) and Model II (squares) give almost identical predictions, and agree with arc-jet data (circles). For the condition with the highest heat flux, 1100 W/cm2, Model I prediction is around 5% below data, and Model II prediction is 20% lower than the data. In model II, the backward reaction rates of carbon sublimation are computed from chemical equilibrium constants and forward reaction rates. Even if we tune up the forward rate constants of sublimation reactions, the predicted net total recession still remains about the same because the net computed reaction rates are limited by chemical equilibrium constants. The reason for Model II under-predicting the sublimation rate by about 20% needs to be investigated further. There is no oxygen involved in the
Figure 3a Comparison of computed stagnation point recession with arc-jet data for low enthalpy MSL cases.
Figure 3b Comparison of computed stagnation point recession with arc-jet data for high enthalpy Orion TPS ADP cases.
sublimation process. The sublimation rate also depends on the concentrations of gas phase C3, C2, and C at the surface. Thus, the accuracy of predicting carbon sublimation rate is directly tied to the accuracy of both gas phase and gas-surface chemical reaction models. The central focus of current study is not the gas-gas chemical reactions. In our future work, the study of gas phase chemical reaction models will be addressed to further understand and improve the prediction accuracy of sublimation rate described in Model II.
Part 2:
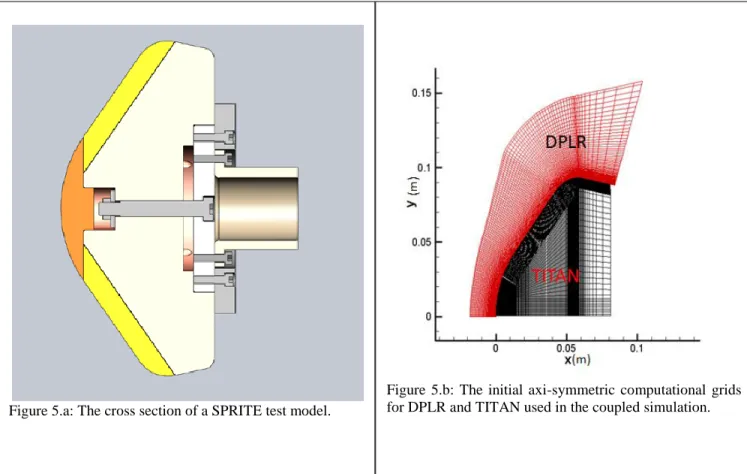
The SPRITE arc-jet test model studied in this part was used for the investigation of a conformable ablative TPS technology targeting missions requiring peak heat-flux around 250 W/cm2. The model is a 20.32-cm (8-inch) diameter, 55-deg half-angle sphere-cone with a 5.08-cm (2-inch) spherical nose radius. The heat shield consists of 3 segments of conformable PICA and 1 segment of standard MSL PICA. All segments have a thickness of 1.27-cm (0.5-inch).
Figure 4.a: Pressure and temperature distributions along stagnation streamline for stagnation heat flux of 45.2 W/cm2.
Figure 4.b: Comparison of mass concentration distributions along stagnation stream for stagnation heat flux of 42.5 W/cm2.
The back shell is entirely LI-2200. This work focuses on the segment with MSL PICA material, because its material properties are well studied and thus is a good candidate material for GSI model validation.
The cross section of SPRITE test article is shown in Fig. 5.a. Simulation is performed by assuming that the test model remains as an axi-symmetric system during the entire exposure time. The nose cap (in orange) is made of PICA, and the segment (in yellow) is also made of rigid PICA. There is a gap between these two elements. The rest of region is made of LI-2200. The back face of PICA segments and the gaps between segments were filled with RTV. However, RTV is not considered in this simulation for simplicity. The initial axi-symmetric computational grids used for simulation are presented in Fig. 5.b. A one-block grid system is used for DPLR (133 × 99) and a two-block grid system is used for TITAN (102 × 153 and 31 × 123). Both grids are moving with time to reflect the surface recession.
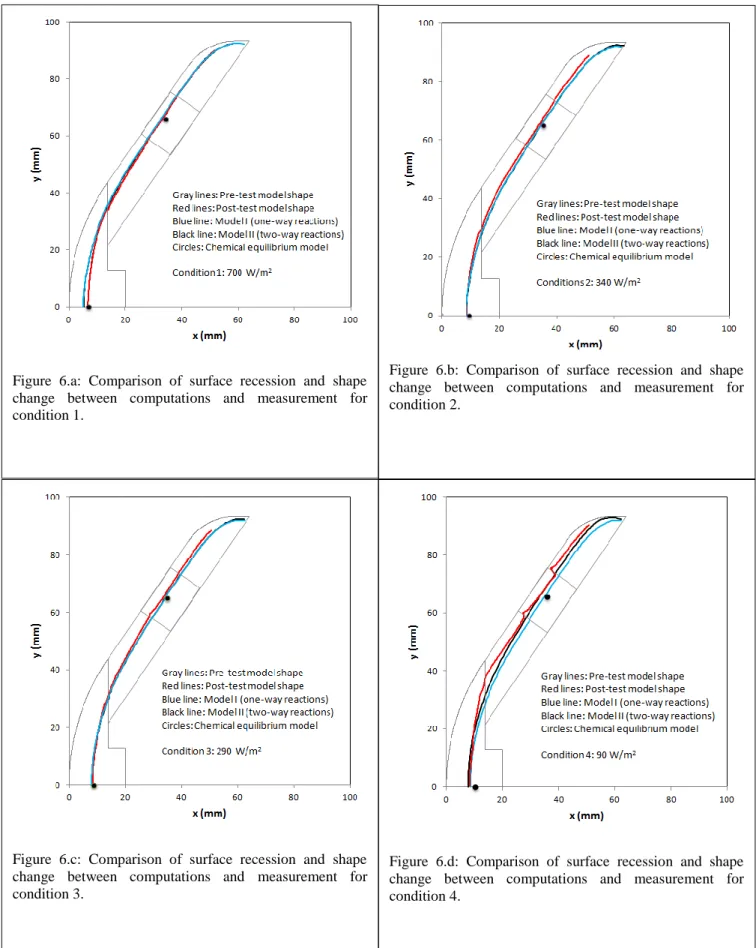
Four arc-jet test conditions for SPRITE model are considered for analysis. Their conditions are listed in Table 3. The highest stagnation-point cold-wall heat flux is 700 W/cm2, and the lowest one is 90 W/cm2. The heat flux at mid-conical section is about 50 to 60% of that at the stagnation point. The stream total center line enthalpy is in the range from 5.4 MJ/kg to 26.0 MJ/kg. For total enthalpy at 5.4 MJ/kg, the oxygen molecules in the arc flow are not fully dissociated. Additionally, the surface temperature for this lowest enthalpy condition, especially in the conical section (flank), should remain low and the carbon oxidation is controlled by the reaction rates.
Figure 5.b: The initial axi-symmetric computational grids for DPLR and TITAN used in the coupled simulation. Figure 5.a: The cross section of a SPRITE test model.
Table 1: SPRITE arc-jet cases selected for analysis. Case number Stagnation point heat flux,
W/cm2
(cold wall)
Stagnation point pressure, kPa
Exposure time, s
Est. total enthalpy MJ/kg
1 700 31.5 30 26.0
2 340 17.9 60 17.0
3 290 9.1 80 18.0
4 90 11.7 100 5.4
The PICA surface recession and shape change predicted by the coupled DPLR-TITAN simulation system are presented in Figs. 6. The gray lines represent the model initial shape before its exposure to the arc stream. The red lines are the post-test measurement of model surface shape. The predicted model surface at the end of exposure is in blue for Model I (one-way reaction model) and is in black for Model II (two-way reaction model). One-dimensional point calculation with the assumption of chemical equilibrium surface is also performed at the stagnation point and the mid-point of conic section (flank). The chemical equilibrium computations are calculated using FIAT and the results are shown as the black dots in Figs. 6. For Conditions 1 to 3, the blue lines (Model I) are on top of the black lines (Model II). Thus, the black lines are hardly to be seen. This indicates both models give almost identical predictions and agree very well with the post-test measurement. The chemical equilibrium predictions are generally slightly highly than those predicted by the finite-rate models, and are still in good agreement with measurements for Conditions 1 to 3. The carbon surface for Conditions 1 to 3 is in the diffusion controlled oxidation regime. All three surface chemistry models give consistent predictions with the measurement. Based on our predictions, it can be concluded that the complicated finite-rate simulation does not seem to be necessary, and a simple chemical equilibrium model should be adequate to predict the SPRITE model shape change with reasonable accuracy if carbon oxidation is limited by the diffusion rate. On the other hand, if the surface heating is low, such as that for Conditions 4, chemical equilibrium surface model over-predicts the surface recession by about 20% at the stagnation point, and 35% at flank, as shown in Fig. 6.d. The shape change and recession predicted by using Model II (black line) agree well with the measurement, except the areas covered by glass fence around the outer edges of gaps. These glass fences were generated from the product of decomposed RTV, as the surface temperature is not high enough to reach the melting point of glass (~1600 °C). Glass accumulates on the carbon surface near gaps to form these fences. The formation of glass fences may affect the accuracy of the axi-symmetric computation model. However, it should have little impact in the nose cap region because the subsonic flow is confined to a small region near stagnation point. Thus, the stagnation heating should not be affected by the presence of downstream glass fences. Besides, if the majority of solid
glass accumulation occurred later in the exposure time, the computation error associated with the presence of glass fences should be even lower. These fences are not seen in the other conditions with higher surface heat fluxes because their surface temperatures are higher than the glass melting point. For Condition 4, the recession prediction on the surface of the nose cap using Model I is also in good agreement with data, but Model I over-predicts the recession by about 20% at flank. It indicates that under such conditions the backward reaction rates become significant. This finding is consistent with the results obtained for stagnation models discussed in Part I.
Figure 6.a: Comparison of surface recession and shape change between computations and measurement for condition 1.
Figure 6.b: Comparison of surface recession and shape change between computations and measurement for condition 2.
Figure 6.c: Comparison of surface recession and shape change between computations and measurement for condition 3.
Figure 6.d: Comparison of surface recession and shape change between computations and measurement for condition 4.
Part 3:
The uncertainty on the arc stream total enthalpy is estimated to be within 15-20%, surface heat flux is 10%, and pressure is 5%. Additionally, the uncertainty of the surface recession measurement is around 10%. Consequently, we estimate that the error on the surface recession prediction should not exceed 15%, if the surface chemistry is correctly modeled.
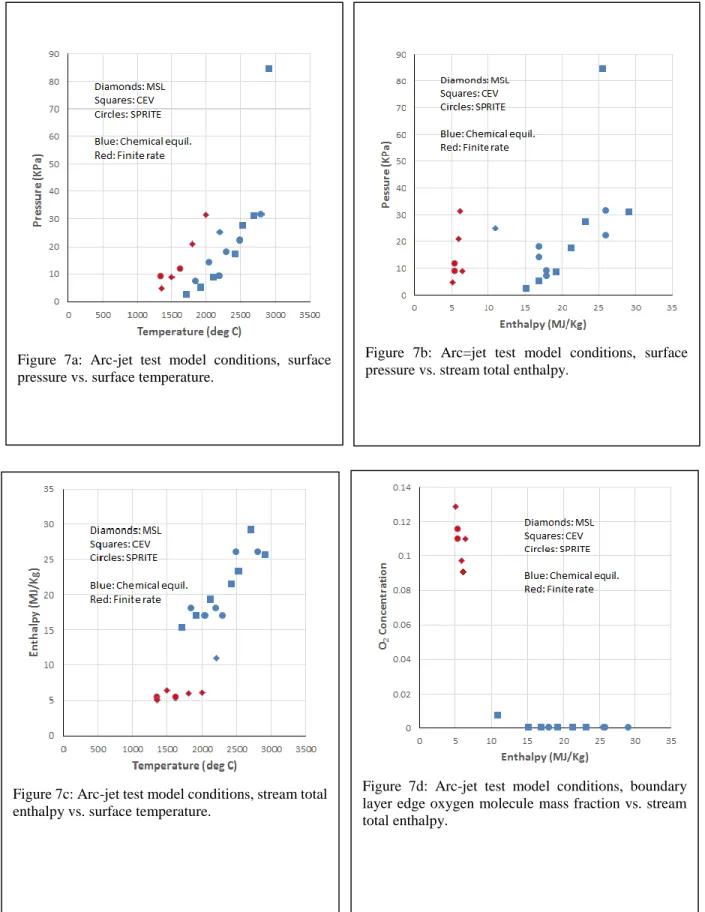
In Fig. 7a, surface pressure is plotted against surface temperature for all arc-jet conditions studied in this work. Diamonds represent the low enthalpy MSL conditions, squares represent the high enthalpy CEV ADP conditions, and circles represent the SPRITE stagnation point and mid-frustum conditions. For conditions in which the predictions using chemical equilibrium surface chemistry agree with measurements within ±15%, their symbols are colored in blue. If the agreement between chemical equilibrium surface prediction and measurement is greater than ±15% and that between finite-rate surface prediction and data is less than ±15%, their symbols are in red. Thus, for those conditions in red, the chemical equilibrium surface assumption is unlikely to be true and the finite-rate model has to be employed to correctly predict carbon recession. In Fig. 7a, it can be seen that, at a given surface pressure, the conditions at higher temperature are in blue and those at lower temperature are in red. This is because the reaction rates increase with increasing temperature. Figure 7b shows a similar chart for surface pressure vs. stream total enthalpy. All the symbols in red are at the low enthalpy side, and those in blue are with relatively high enthalpy. It indicates that surface pressure is not a key factor to determine the surface chemical state as compared with enthalpy and temperature. Figure 7c shows the chart for total enthalpy vs. surface temperature. At a given surface temperature, the conditions with higher enthalpy are at chemical equilibrium, but those with lower enthalpy are not. This suggests that total enthalpy is the most important factor to determine the chemical state of surface for arc stream conditions studied in this paper. Figure 7d presents the chart for boundary edge oxygen molecule concentration vs. total enthalpy. It can be found that the O2 concentrations for symbols in red are significantly high than those in blue. O is far more reactive than O2 when they interact with a carbon surface. This can explain why a carbon surface exposed to high enthalpy flow is more likely to reach a chemical equilibrium state.
Figure 7a: Arc-jet test model conditions, surface pressure vs. surface temperature.
Figure 7b: Arc=jet test model conditions, surface pressure vs. stream total enthalpy.
Figure 7c: Arc-jet test model conditions, stream total enthalpy vs. surface temperature.
Figure 7d: Arc-jet test model conditions, boundary layer edge oxygen molecule mass fraction vs. stream total enthalpy.
V. Conclusions
Two sets of finite-rate gas-surface interaction models for carbon based ablator have been proposed. The predicted PICA surface recession using the proposed models with surface heat fluxes ranging from 40 to 1100 W/cm2 were compared with arc-jet data. The predictions using the model with two-way surface reactions agree well with data if carbon recession is primarily an oxidation process. However, the proposed two-way reaction model, presented here, under-predicts the carbon sublimation rate. The predictions using the proposed one-way reaction model are also in good agreement with data except the relatively low heat flux condition (below 50 W/cm2), in which the backward reaction rate becomes significant. Generally speaking, the chemical equilibrium surface model tends to over-predict the carbon surface recession, if carbon oxidation is rate controlled, and a finite-rate model has to be applied to accurately compute the carbon recession. The simulation of SPRITE arc-jet model reconfirms that the proposed two-way reaction model can accurately predict the recession and shape change of PICA material at low surface heat flux condition, where the chemical equilibrium and one-way reaction models are normally over-predicting. It was also found that the carbon ablation process is more likely to reach a chemical equilibrium state if the surface is exposed to a high enthalpy flow with fully dissociated oxygen, as compared to a low enthalpy flow with partially dissociated oxygen.
Acknowledgements
This work is partially funded by the Game Changing Development Program’s Entry Systems Modeling Project. The support from the NASA Ames Entry Systems and Technology Division, through contract NNA10DE12C to ERC, Inc., is gratefully acknowledged.
References
[1]Chen, Y.-K., Milos, F. S., and Gökçen, T., "Loosely Coupled Simulation for Two-Dimensional Ablation and Shape Change," Journal of Spacecraft and Rockets, Vol. 47, No 5, September-October 2010, pp. 775-785. doi: 10.2514/1.39667
[2]Gökçen, T., Chen, Y.-K., Skokova, K. A., and Milos, F. S., "Computational Analysis of Arc-Jet Stagnation Tests including Ablation and Shape Change," Journal of Thermophysics and Heat Transfer, Vol. 24, No. 4, October-December 2010, pp 694-707. doi: 10.2514/1.46199
[3]Wright, M. J., Candler, G. V., and Bose, D., "Data-Parallel Line Relaxation Method for the Navier-Stokes Equations," AIAA Journal, Vol. 36, No. 9, Sept. 1998, pp 1603–1609. doi: 10.2514/2.586
[4]Chen, Y.-K., and Milos, F.S., "Two-Dimensional Implicit Thermal Response and Ablation Program for Charring Materials," Journal of Spacecraft and Rockets, Vol. 38, No. 4, 2001, pp. 473-481. doi: 10.2514/2.3724
[5]Chen, Y.-K., and Gökçen, T., "Effect of Nonequilibrium Surface Thermochemistry in Simulation of Carbon-Based Ablators," Journal of Spacecraft and Rockets, 2013, Vol.50: 917-926. doi: 10.2514/1.A32451
[6]Chen, Y.-K., and Gökçen, T., "Implicit Coupling Approach for Simulation of Charring Carbon Ablators,"
Journal of Spacecraft and Rockets, 2014, Vol.51: 779-788. doi: 10.2514/1.A32753
[7]Park, C., and Ahn, H. K., "Stagnation-Point Heat Transfer for Pioneer-Venus Probes," Journal of Thermophysics and Heat Transfer, Vol. 13, No. 1, January-March 1999, pp. 33-41. doi: 10.2514/2.6426
[8]Zhluktov, S. V. and Abe, T., "Viscous Shock-Layer Simulation of Airflow past Ablating Blunt Body with Carbon Surface, " Journal of Thermophysics and Heat Transfer, Vol. 13, No. 1, January-March 1999, pp. 50-59. doi: 10.2514/2.6400
[9]MacLean, M., Marschall, J., and Driver, D., "Finite-Rate Surface Chemistry Model, II: Coupling to Viscous Navier-Stokes Code," AIAA-2011-3784, 42nd AIAA Thermophysics Conference, Honolulu, Hawaii, June 27-30, 2011.
[10]Tran, H., Johnson, C, Rasky, D., Hui, F., Chen, Y.-K., and Hsu, M., "Phenolic Impregnated Carbon Ablators (PICA) for Discovery Class Missions," AIAA Paper 96-1911, June 1996.
[11] Milos, F. S., Chen, Y.-K., and Gökçen, T., "Nonequilibrium Ablation of Phenolic Impregnated Carbon Ablation," Journal of Spacecraft and Rockets, Vol. 49, No 5, September-October 2012, pp. 8945-904. doi: 10.2514/1.60051
[12]Prabhu, D., "Flowfield Analysis of a Small Entry Probe (SPRITE) Tested in an Arc Jet," AIAA Paper 2012-0216, 50th AIAA Aerospace Sciences Meeting including the New Horizons Forum and Aerospace Exposition, Nashville, Tennessee, January 2012.
[13]Marschall, J. and MacLean, M., "Finite-Rate Surface Chemistry Model, I: Formulation and Reaction System Examples," AIAA-2011-3783, 42nd AIAA Thermophysics Conference, Honolulu, Hawaii, June 27-30, 2011.
[14]Park, C., Howe, J.T. Jaffe, R.L. and Candler, G.V., "Review of Chemical Kinetic Problems for Future NASA Missions, II: Mars Entries, " Journal of Thermophysics and Heat Transfer, Vol. 8, No. 1, 1994, pp. 9–23. doi:10.2514/3.496
[15]Bhutta, B. A., and Lewis, C. H., "A New Technique for Low-to-High Altitude Predictions of Ablative Hypersonic Flow. Fields, "Journal of Spacecraftand Rockets, Vol. 29, No. 1, 1992, pp. 35–50. doi:10.2514/3.26311
[16]Sangiovanni, J. J., and Barber, T. J., "Role of Hydrogen/Air Chemistry in Nozzle Performances for Hypersonic Propulsion System," Journalof Propulsion and Power, Vol. 9, No. 1, 1993, pp. 178–183. doi:10.2514/3.11495
[17]Heicklen, J., "Gas-Phase Chemistry of Reentry," AIAA Journal, Vol. 5, No. 1, 1967, pp. 4–15. doi: 10.2514/3.3901
[18]Dean, A. J., and Hanson, R. K., "CH and C-Atom Time Histories in Dilute Hydrocarbon Pyrolysis: Measurements and Kinetic Calculations, " International Journal of Chemical Kinetics, Vol. 24, No. 6, 1992, pp. 517– 532. doi:10.1002/kin.550240602
[19]Kruse, T. and Roth, P., "Kinetics of C2 Reactions during High-Temperature Pyrolysis of Acetylene,"
J. Phys. Chem. A, 1997, 101, 2138-2146. doi: 10.1021/jp963373o [20]NIST Chemical Kinetics Database, Ver. 7.0, 2003.
[21]Tsang, W., and Hampson, R. F., "Chemical Kinetic Data Base for Combustion Chemistry. Part 1. Methane and Related Compounds, " Journal of Physical Chemistry Reference Data, Vol. 15, No. 3, 1986, pp. 1087–1279. doi:10.1063/1.555759
[22]Kiefer,J.H., Sidhu,S.S., Kern,R.D., Xie,K., Chen,H., Harding,L.B., "The Homogeneous Pyrolysis of Acetylene II: The High Temperature Radical Chain Mechanism, " Combust. Sci. Technol. 1992, 82, 101-130 doi:10.1080/00102209208951815
[23]Kiefer,J.H., Kumaran,S.S., "Rate of methane dissociation over 2800-4300 K: the low-pressure-limit rate constant, " J.Phys Chem. 1993, 97, 414-420. doi:10.1021/j100104a024
[24]Chen, Y.-K., and Milos, F. S., "Navier-Stokes Solutions with Finite-Rate Ablation for Planetary Mission Earth Re-entries," Journal of Spacecraft and Rockets, Vol. 42, No. 6, 2005, pp. 961-970.doi: 10.2514/1.12248
[25]Chen, Y.-K., and Milos, F. S., "Effect of Non-equilibrium Chemistry and Darcy-Forchheimer Flow of Pyrolysis Gas for a Charring Ablator," Journal of Spacecraft and Rockets, 2013, Vol.50: 256-269, doi:10.2514/1.A32289
[26]Chen, Y.-K., Gökçen, T., and Edquis, K.T., "Two-Dimensional Ablation and Thermal Response Analyses for Mars Science Laboratory Heat shield," Journal of Spacecraft and Rockets, 2015, Vol. 52, pp. 134-143. doi: 10.2514/1.A32868
[27]Milos, F. S., and Chen, Y.-K., "Ablation and Thermal Response Property Model Validation for Phenolic Impregnated Carbon Ablator," Journal of Spacecraft and Rockets, Vol. 47, No. 5, 2010, pp. 786-850. doi: 10.2514/1.42949