24
Analysis of the Determinants of Technical Efficiency among Some
Selected Small Scale Farmers in Kogi State
Dr Adama .I. Joseph
Department of Economics, Ahmadu Bello University Zaria E-mail: [email protected]
Abstract
The purpose of this study was to analyze the determinants of technical efficiency of small scale farmers in Kogi State and the effect of policy changes on technical efficiency, using the stochastic frontier methodology. Results of the analysis indicate that, the farmers have an average farm size of 1.72 hectares. It is also indicated that both family and hired labour were expansively used in farm production. The analysis shows a spacious variation in the estimated technical efficiencies within the range of 0.19 and 0.93, and a mean value of 0.64, indicating an ample opportunity for enhancement in the technical efficiency. The results of simulation of policy variables prove that the level of technical efficiency would extensively increase with rising level of farming experiences and educational level among the rural farmers.
Keywords: Technical efficiency, Small scale farmers, Stochastic Frontier, production function. INTRODUCTION
Kogi State agriculture is predominantly small scale farmers who produce the bulk of food requirements in the State. Despite their distinctive and fundamental position, the small holder farmers belong to the poorest section of the population and therefore, cannot spend much on their farms. The vicious circle of poverty among these farmers has led to the low performance of the agricultural sector. While substantial efforts have been made to raise production and productivity of these farmers so as to achieve food security, such efforts have had negative implications for the environment. As the population density increases, farmers must produce even more food than before. With the population increases today, people are being pushed to new lands and many into marginal lands. One of the enormous challenges in the drive to increase food to feed the growing population will be to raise productivity and efficiency in the agricultural sector. More so that Nigeria’s rapid population growth has outstripped the nation’s capacity to grow food. From 1991 - 2000, Kogi state population grew by 2.1% a year, while agricultural production lagged far behind - growing at just 2.5% a year (Ojo 1993). Given the various agricultural programmes and policies implemented over the years to raise farmers’ efficiency and productivity, it then becomes imperative to quantitatively measure the current level of and determinants of technical efficiency and policy options available for raising the present level of efficiency, given the fact that efficiency of production is directly related to the overall productivity of the agricultural sector. From the foregoing, there is crucial need to raise agricultural growth, as such growth is the most efficient means of alleviating poverty and protecting the environment. For Kogi State, raising productivity per area of land is the key to effectively addressing the challenges of achieving food security, as most cultivable land has already been brought under cultivation, and in areas where wide expanse of cultivable land is still available, physical and technological constraints prevent large-scale conversion of potentially cultivable land.
The main objective of this study is to estimate technical efficiency and identify the factors that explain variations in technical efficiency. The study has two specific objectives. First, it examines the impact of technology adoption, such as improved seeds and fertilizer application, on the technical efficiency of smallholder farmers in Kogi State. Secondly, the study determines the relative role of farmer education, use of fertilizers, use of hybrid seeds and farm size.
Conceptual framework
Akpakpan (1999) refers to efficiency as the objective of getting the most from an undertaking. A resource is said to be efficiently used, if its marginal variable cost (MVC) exceeds its marginal factor cost (MFC). Noting the three components of efficiency Farrel (1957) referred to technical efficiency as the ability to produce the highest level of output given a bundle of resources. On the other hand, technical inefficiency depicts a situation in which actual and observed output from a given input mix is less than the maximum possible (Bailey, 1989). The modern theory of efficiency dates back to the pioneering work of Farrel (1957), who drew extensively from the earlier works of Debreu (1951) and Koopmans (1951) to define a simple measure of firm efficiency, which could account for multiple inputs. Farrel identified two components of firm efficiency- technical and allocative and the combination of these two components provides a measure of economic efficiency (Udoh, 2005). Technical efficiency, the main issue in this study can be measured either as input conserving oriented technical efficiency or output expanding oriented technical efficiency. Output expanding oriented technical efficiency is the ratio of observed to maximum feasible output, conditional on technical and observed input usage (Jondraw et al., 1982; Ali, 1996; Udoh, 2005).
25 Theoretical Literature
There are a number of different theoretical approaches that attempt to explain efficiency of farmers in crop production. As a component of productive efficiency, technical efficiency is derived from the production function. Productive efficiency consists of technical efficiency and allocative or factor price efficiency. Productive efficiency represents the efficient resource input mix for any given output that minimizes the cost of producing that level of output or equivalently, the combination of inputs that for a given monetary outlay maximizes the level of production (Forsund et al., 1980). Technical efficiency reflects the ability of a firm to maximize output for a given set of resource inputs, while allocative (factor price) efficiency reflects the ability of the firm to use the inputs in optimal proportions given their respective prices and the production technology. Developments in cost and production frontiers are attempts to measure productive efficiency as proposed by Farrell (1957). The frontier defines the limit to a range of possible observed production (cost) levels and identifies the extent to which the firm lies below (above) the frontier.
Estimating technical efficiency
The literature suggests several alternative approaches to measuring productive efficiency, grouped into non-parametric frontiers and non-parametric frontiers. Nonnon-parametric frontiers do not impose a functional form on the production frontiers and do not make assumptions about the error term. These have used linear programming approaches; the most popular non-parametric approach has been the data envelopment analysis. Parametric frontier approaches impose a functional form on the production function and make assumptions about the data. The most common functional forms include the Cobb–Douglas, constant elasticity of substitution and translog production functions. The other distinction is between deterministic and stochastic frontiers. Deterministic frontiers assume that all the deviations from the frontier are a result of firms’ inefficiency, while stochastic frontiers assume that part of the deviation from the frontier is due to random events (reflecting measurement errors and statistical noise) and part is due to firm specific inefficiency (Forsund et al., 1980; Battese, 1992; Coelli et al., 1998). The stochastic frontier approach, unlike the other parametric frontier measures, makes allowance for stochastic errors arising from statistical noise or measurement errors. The stochastic frontier model decomposes the error term into a two-sided random error that captures the random effects outside the control of the firm (the decision making unit) and the one-sided efficiency component. The model was first proposed by Aigner et al.
Factors influencing technical efficiency
The literature suggests two methodological approaches for analysing the sources of technical efficiency based on stochastic production functions. The first approach is the two-stage estimation procedure in which first the stochastic production function is estimated, from which efficiency scores are derived. In the second stage the derived efficiency scores are regressed on explanatory variables using ordinary least square methods or tobit regression. This approach has been criticized on grounds that the firm’s knowledge of its level of technical inefficiency affects its input choices; hence inefficiency may be dependent on the explanatory variables. The second approach advocates a onestage simultaneous estimation approach as in Battese and Coelli (1995), in which the inefficiency effects are expressed as an explicit function of a vector of farm-specific variables. The technical inefficiency effects are expressed as u j = Zjδ
Where, for farm j, z is a vector of observable explanatory variables and δis a vector of unknown parameters.
Thus, the parameters of the frontier production function are simultaneously estimated with those of an inefficiency model, in which the technical inefficiency effects are specified as a function of other variables. The one-stage simultaneous approach is also implemented in FRONTIER and in addition to the basic parameters the programme also provides coefficients for the technical inefficiency model. Several factors, including socioeconomic and demographic factors, plot-level characteristics, environmental factors, and non-physical factors are likely to affect the efficiency of smallholder farmers. Parikh et al. (1995), using stochastic cost frontiers in Pakistani agriculture in a two-stage estimation procedure, find that education, number of working animals, credit per acre and number of extension visits significantly increase cost efficiency, while large land holding size and subsistence significantly decrease cost efficiency.
Existing empirical studies in Africa
The literature on productive or technical efficiency in African agriculture is emerging. Globally, however, there is a wide body of empirical research on the economic efficiency of farmers in both developed and developing countries (for reviews see Battese, 1992; Coelli, 1995). While the empirical literature on the efficiency of farmers is vast in developed countries and Asian economies, few studies focus on African agriculture. Heshmati and Mulugeta (1996) estimate the technical efficiency of Ugandan matokeproducing farms and find that they face decreasing returns to scale with mean technical efficiency of 65%. On the other hand, they find no significant variation in technical efficiency with respect to farm sizes. Nor do they identify the various sources of technical efficiency among matoke-producing farmers. Seyoum et al. (1998) consider the technical efficiency and productivity of maize producers in Ethiopia and compare the performance of farmers within and outside the programme of technology demonstration. Using Cobb–Douglas stochastic production functions, their empirical results show that farmers who participate in the programme are more technically efficient with a mean technical
26
efficiency equal to 94% compared with those outside the project whose mean efficiency equalled 79%. Also in Ethiopia, Weir (1999) investigates the effects of education on farmer productivity of cereal crops using average and stochastic production functions. This study finds substantial internal benefits of schooling for farmer productivity in terms of efficiency gains but finds a threshold effect that implies that at least four years of schooling are required to lead to significant effects on farm level technical efficiency. Using different specifications, average technical efficiencies range between 0.44 and 0.56, and raising education from zero to four years in the household leads to a 15% increase in technical efficiency. Moreover, the study finds evidence that average schooling in the villages (external benefits of schooling) improves technical efficiency. The impact of education externalities on production and technical efficiency of farmers in rural Ethiopia is the subject of Weir and Knight (2000). They find evidence that the source of externalities to schooling is in the adoption and spread of innovations that shift out the production frontier. Mean technical efficiencies of cereal crop farmers are 0.55. A unit increase in years of schooling increases technical efficiency by 2.1 percentage points. One limitation of the Weir (1999) and Weir and Knight (2000) is that they investigate the levels of schooling as the only source of technical efficiency. Using data envelopment analysis, Townsend et al. (1998) investigate the relationships among farm size, returns to scale and productivity for wine producers in South Africa. They find that most farmers operate under constant returns to scale, but the inverse relationship between farm size and productivity is weak. Mochebelele and Winter-Nelson (2000) assess the impact of labour migration on the technical efficiency performance of farms in the rural economy of Lesotho. Using the stochastic production function (translog and Cobb–Douglas), the study finds that households that send migrant labour to South African mines are more efficient than those that do not, with mean inefficiencies of 0.36 and 0.24, respectively. In addition, there is no statistical evidence that the size of the farm or the gender of the household head affects the efficiency of farmers. These authors conclude that remittances facilitate agricultural production, rather than substitute for it. Their study does not, however, consider the many other household characteristics that may affect technical efficiency such as education, farmers’ experience, access to credit facilities (capital) and advisory services, and the extent to which households that export labour receive remittances. The authors’ interpretation that it is remittances that explain differences in technical efficiencies is based on the presumption that migrant labourers remit to their exporting households, and not on some measure of the extent of remittances. Sherlund et al. (2002) investigate the efficiency of smallholder rice farmers in Côte d’Ivoire while controlling for environmental factors that affect the production process. Apart from identifying factors that influence technical efficiencies, the study finds that the inclusion of environmental variables in the production function significantly changes the results: the estimated mean technical efficiencies increase from 36% to 0.76%. Binam et al. (2004) examine factors influencing technical efficiency of groundnut and maize farmers in Cameroon. They use a Cobb–Douglas production function to find mean technical efficiencies to be in the region of 73% and 77%. They also conclude that access to credit, social capital,distance from the road and extension services are important factors explaining the variations in technical efficiencies.
METHODOLOGY: The Study area
Kogi State is one of the Central states of Nigeria created on the 27th of August, 1991.The state is located between latitudes 60:33’and 80:44’N and longitudes50:22’ and 70: 49’ E. The state has a total population of about 3.278million (NPC, 2007) people with an average of about 228,964 farm families (Kogi state Min. of Agric, 1999). About 70% of the people lives in the rural areas and mostly engage in one form of agricultural practice or the other. The average farm family in the state is made up of 7 people with an average farm size of about 2 hectares per farmer. Administratively, the state has 21 local government areas. They are Adavi, Ajaokuta, Ankpa, Bassa, Dekina, Okehi, Idah, Ijumu, Kogi, Ofu, Olamaboro and Kabba-Bunu. The rest are Ibaji, Igalamela odolu, Lokoja, Mopamuro and Omala, Wikipedia, (2010). Kogi State has a total land area of 28,313.53 square kilometers. The three major ethnic groups are Igala, Ebira and Yoruba. Other minor groups are Nupe, Bassa, Ogori-magongo, Ebira koto and Hausa. English is the official language of the state and it is widely spoken. Farm level data were collected on 240 small scale farmers .Predominant agricultural crops cultivated in the state includes, crops such as cassava, maize, cocoyam and yam. The massiveness of the agricultural products is obtained from rain-fed irrigated crops with mixed cropping system.
Data for the Study
The selection of respondent farmers for this study was multistage. The first stage involves the selection of two (2) local government areas from the three senatorial districts. The local governments in the state were divided into villages and one village was selected from each of the local government. The second stage of the sampling procedure demands the random selection of villages proportionate to the village population of the identified local government (LGAs). From each selected village, 40 smallholder farmers were interviewed, making a total of 240 sample farmers in all. Major Production resources used by the farmers were grouped into five. These are: land, labour, seed, implements, and chemical. Majority of the farmers relied mostly on these productive resources. The study measured land in hectares; and human labour in mandays (family and hired labour). Seed chemical and
27
implements, were each measured in quantity and price of the resources used. Model Specification:
This study uses the stochastic frontier production function. The stochastic frontier production function model has the advantage in that it allows simultaneous estimation of individual technical efficiency of the respondent farmers as well as determinants of technical efficiency (Battese and Coelli, 1995). The idea of frontier production function can be illustrated with a farm using n inputs (X1, X2 ...Xn) to produce output Y. Efficient transformation of inputs into output is characterized by the production function f(x), which shows the maximum output obtainable from various input vectors. The stochastic frontier production function assumes the presence of technical inefficiency of production. Hence, the function is defined by,
Yi = f(xi, ) exp (vi - ui) i = 1, 2, ...n (1)
where v is a random error which is associated with random factors not under the control of farmer. The model is such that the possible production Yi is bounded above by the stochastic quantity f(xi, ) exp (vi), hence the term stochastic frontier. The random error vi are assumed to be independently and identically distributed as N(0, Ø2 v) random variables independent of the uis.
Technical efficiency of an individual farmer is defined in terms of the ratio of the observed output to the corresponding frontier output, given the available technology.
Technical efficiency (TE) = Yi/Yi*
= f(xi, ) exp (vi - ui) / f(xi, ) exp (vi)
= exp (-ui) (2)
where Yi is the observed output and Yi* the frontier output. Technically efficient farms are those that operate on the production frontier and the level by which a farm lies below its production frontier is regarded as the measure of technical inefficiency. For this study, the production technology of small scale foodcrop farmers is assumed to be specified by the Cobb-Douglas frontier production function defined by,
In Y = βo + βlog X1 + β log X2 + β3 log X3 + β4 log X4 + β5 log X5 + VI – UI ( 3) Where
In represents the natural logarithm
Y represents the value of production of i-th farmer measured in Naira1 X1 represents the total area of land in hectares on which crops were grown X2 represents family labour in mandays
X3 stands for the value of implements in Naira
X4 represents the quantity of fertilizer used, in kilograms X5 stands for value of seed in Naira
βis are coefficients to be estimated
Vis are assumed to be independent and identically distributed normal random errors, having zero mean and unknown variance, Ø2v;
The Uis are the technical inefficiency effects, which are assumed to be independent of Vis such that Uis is the non-negative truncation (at zero) of the normal distribution with mean, ui, and variance, Ø2, where uis is defined by,
µi = <>o + d1z1i + 2z2i + 3z3i + 4z4i + 5z5i ( 4) where z1, z2, z3, z4, z5 are age, level of education, farming experience, farm size and family size of farm
operator respectively. These variables are assumed to influence technical efficiency of the farmers, are unknown scalar parameters to be estimated. The variables age, level of education, farming experience, farm size and family size are included in the model as determinants of technical efficiency, to indicate possible effects of farmers characteristics on technical efficiency in order to be able to come out with recommendations on how government policy formulation could be used to influence these variables so as to enhance the technical efficiency of the farmers
RESULTS
Summary of Descriptive Statistics
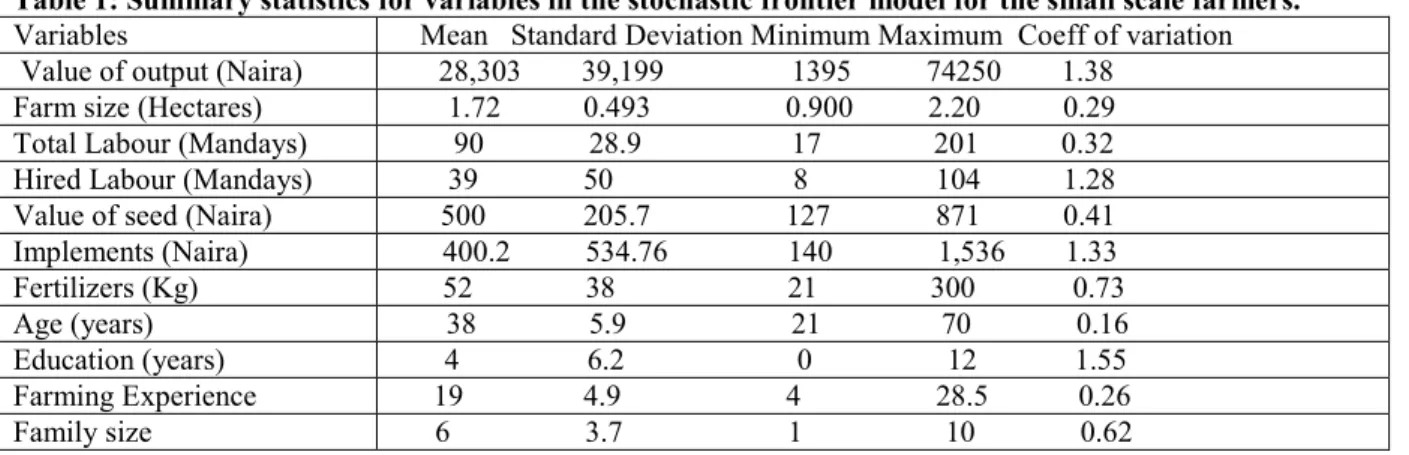
Presented below is a summary statistics of variables used in the stochastic frontier production function. The values in the summary statistics vary across the two zones. The farmers involved in the study have relatively small farms. Farm sizes for both zones ranged between 0.493 and 2.20 hectares. Also both hired and family labour was extensively used by the respondents, though with wide variations within and between zones. The main reason for wide variation in the intensity of farm labour use could be attributed to variation in the types of crops grown by respondent farmers. For instance yam production is known to be traditionally associated with intensive labour use, especially with mould-making, staking and other operations involved in yam farming.
28
Table 1: Summary statistics for variables in the stochastic frontier model for the small scale farmers. Variables Mean Standard Deviation Minimum Maximum Coeff of variation Value of output (Naira) 28,303 39,199 1395 74250 1.38
Farm size (Hectares) 1.72 0.493 0.900 2.20 0.29 Total Labour (Mandays) 90 28.9 17 201 0.32 Hired Labour (Mandays) 39 50 8 104 1.28 Value of seed (Naira) 500 205.7 127 871 0.41 Implements (Naira) 400.2 534.76 140 1,536 1.33 Fertilizers (Kg) 52 38 21 300 0.73 Age (years) 38 5.9 21 70 0.16 Education (years) 4 6.2 0 12 1.55 Farming Experience 19 4.9 4 28.5 0.26 Family size 6 3.7 1 10 0.62 Source: Field Survey 2011.
Results of Maximum likelihood Estimates
Inferences about stochastic frontier model on the maximum likelihood estimates, represented by the elasticity estimates. The variance parameters of the model is obtained in terms of :
α2s =αu2 + αv2 and
= α2 / (αv2 + α2) (5
)
The estimate for the parameter in the stochastic frontier model (87%) is quite large. The value indicates the relative magnitude of the variance with the inefficiency effects. This implies that technical inefficiencies are highly significant in the analysis of the data. The production elasticity measures the proportional change in output resulting from a proportional change in the i-th input level, with all other input levels held constant. Presented in Table 3 are elasticity estimates and returns-to scale value.
Table 3: Elasticity and Returns-to-scale for Small Scale Farmers in Kogi State
Land 0.23 Labour 0.34 Implements 0.27 Agrochemicals 0.18 Seeds 0.24 Returns-to-scale 1.26
The elasticity of mean values of output with respect to the inputs are estimated at the values of the means of the resources. The elasticity of mean value of farm output with respect to land, labour, implements, agrochemicals and seeds are 0.23, 0.34, 0.27, 0.18 and 0.24 respectively. Given the specification of the Cobb-Douglas frontier models, the results show that, the elasticity of mean value of farm output is estimated to be an increasing function of land, an increasing function of labour, and an increasing function of implements. Also, the mean value of farm output is estimated to be an increasing function of agrochemicals as well as an increasing function of seeds. The returns-to-scale value, 1.26, indicates an increasing returns-to- scale. The returns-to-scale parameter indicates what happens when all production resources are varied in the long run by the same proportion. The implication of increasing-returns-scale in this study means increasing productivity per unit of input. The farmers are not using their resources efficiently. They can still increase their level of output at the current level of resources.
Technical Efficiency Estimates
Given the specification of the Cobb-Douglas stochastic frontier model in equation (1), the predicted technical efficiency differ widely among the sample farmers, with minimum and maximum values of 0.19 and 0.93 respectively and a mean technical efficiency value of 0.64. Table 4 presents the frequency distribution of technical efficiency of the sample farmers.
Table 4: Frequency Distribution of Technical Efficiency Estimates. Technical
Efficiency Range Frequency % of Total
0.1 – 0.29 15 7.5 0.30 – 0.49 43 21.5 0.50 – 0.69 106 53.0 0.70 – 0.89 31 15.5 0.90 – 1.00 5 2.5 Total 200 100
Source: Computed from field survey 2011
The distribution of the technical efficiency in table 4 clearly shows that the technical efficiency skewed heavily in the 0.50 and 0.69 range, representing 53% of the sample farmers. The wide variation in technical
29
efficiency estimates is an indication that most of the farmers are still using their resources inefficiently in the production process and there still exists opportunities for improving on their current level of technical efficiency. Given the results of the inefficiency model in the Cobb-Douglas frontier model, age of operator, level of education, and farming experience of operators are individually significant determinants of technical inefficiency at 5% level. The implication here is that these variables significantly affect the level of technical efficiency of the respondent farmers. However, family size and farm size did not significantly influence technical inefficiency. While the level of education, farm size and farming experience have negative coefficients, age of operator, and family size have positive coefficients, respectively. The negative coefficients of level of education, farm size and farming experience imply that an increase in any of or in all of these variables would lead to decline in the level of technical inefficiency. An increase in the value of variables with positive coefficients (age of operator and family size) implies that an increase in the value of these variables would lead to increase in the level of technical inefficiency. In order to determine the magnitude of change in the level of technical efficiency, that could result as a result of change in government policies that influence the determinants of technical inefficiency, a simulation analysis was performed on the identified variables which could be influenced by government policy. Analysis of Policy Variables that Affect Technical Inefficiency
Table 5 shows the simulation results, assuming a change in policy that influences the determinants of technical inefficiency. The simulation is done with an increase in the values of the variables by 5%, 10% and 20% and the observed change in the level of technical efficiency is as presented below.
Table 5: Simulation Results of Variation in Policy Variables on Mean Technical Efficiency.
Variable Mean T.E = 0.63
+5 +10 +20 Age of operator 0.65 0.64 0.63 Level of education 0.67 0.69 0.72 Farming experience 0.67 0.68 0.71 Family size 0.65 0.65 0.64 Farm size 0.67 0.68 0.69
Source: Data Analysis
The results of simulation of policy variables show that the mean technical inefficiency would decline with rising level of education, farming experience and farm size. An increase in the level of education from 5% through 20% raised the mean technical efficiency from the current level of 67% to 72%, while an increase in the level of farming experience from 5% through 20% led to increase in the mean technical efficiency from the current level of 67% to 71%. On the other hand an increase in farm size from 5% through 20% only led to marginal increase in the mean technical efficiency. An increase in age and family size of operator from 5% through 20% led to significant decline in the mean technical efficiency from 65% to 63% and from 65% to 64% respectively. The implication of the foregoing analyses is that education is one of the policy variables which can be used by policy makers to improve the current level of technical efficiency of farmers in Nigeria. Hence any agricultural policy in the country that would attract people with high level of education into farming and/or encourage illiterate farmers to undergo education/training would definitely lead to increase in the level of technical efficiency of the farmers. Also the analyses imply that any agricultural policy in the country that would encourage experienced farmers to remain in the farming business (thereby gaining more experience) would also lead to increase in the level of technical efficiency of the farmers. It is also important to state that any agricultural policy that would attract young people into farming business would lead to increase in the level of technical efficiency, given that young and educated people are more receptive to agricultural innovation than the old and illiterate farmers. The current government policy which encourages a maximum of four children per woman will on the long run lead to decline in family size, especially among the farming families. A decline in family size is expected to result in increase in the level of technical efficiency (Table 5), given that the farmers have small farm size and most family members are underemployed on the farm.
Conclusion
In conclusion, education level of farmers as well as farming experience are important policy variables and determinants of efficiency which can be incorporated into the agricultural policy in Kogi State in order to raise the current level of technical efficiency and hence the level of productivity in the Nigerian agricultural sector. References
Abdulkadri, A.O.; Ajibefun, I. A. and Ogundare, F.N. (1999), “Technical efficiency of Small Scale Oil Palm Processors in Nigeria”, American Journal of Agricultural Economics,Vol. 81 No. 5, pp 1328.
Adesina, A.A. and K.K. Djato (1997), “Relative Efficiency of Women as Farm Managers: Profit Function Analysis in Cote d’Ivoire’, Agricultural Economics, 16, 47-53.
Aigner, D, C.A.K. Lovell and P. Schmidt (1977), “Formulation and Estimation of Stochastic Frontier Production Models”, Journal of Econometrics, 6, 21 - 37.
30
Ajibefun, I. and O.A Abdulkadri (1999), “An Investigation of Technical Inefficiency of Production of Farmers Under the National Directorate of Employment in Ondo State, Nigeria”, Applied Economics Letter, 6, 111- 114, Routledge, London.
Ajibefun, I.A., Battese, G.E. and Daramola, A.G. (1996), “Investigation of Factors Influencing the Technical Efficiencies of Smallholder Croppers in Nigeria”, CEPA Working Papers No. 10/96 Department of Econometrics, University of New England, Armidale, Australia, Pp 19.
Akpakpan, E.B., 1999. The Economy: Towards A New Type of Economy, p.25. Belpot, Nigeria
Bagi, F.S. and C.J. Huang (1983), “Estimating Production Technical Efficiency for Individual Farms in Tennessee”Canadian Journal of Agricultural Economics, 31, 249-256.
Battese, G.E and G.S. Corra (1977), “Estimation of a Production Frontier Model: With Application to the Pastoral Zone of Eastern Australia”, Australia”, Australian Journal of Agricultural Economics, 21, 169-179. Brova-Ureta, B. and A.E. Pinheiro (1993), “Efficiency Analysis of Developing Country Agriculture: A Review of the Frontier Function Literature”, Agricultural Resource Economics Review, 22, 88-101.
Battese, G.E and T.J. Coelli (1995), “A Model For Technical Inefficiency Effect in a Stochastic Frontier Production Function for Panel Data”, Empirical Economics, 20, 325-332.
Central bank of Nigeria (CBN), Annual Statement of Accounts (2010).
Edeth, U and Oluwatoyin, F(2006), “Resource use efficiency and productivity among farmers in Nigeria”, Journal of Agriculture and Social Sciences 2, 264 - 268
Kumbhakar, S.C., B. Biswas, and D.V. Bailey, (1989), “A study of Economic Efficiency of Utah Dairy Farmers: A System Approach”, Review of Economics and Statistics, 71,595-604