Durham Research Online
Deposited in DRO:
28 November 2019
Version of attached le:
Published VersionPeer-review status of attached le:
Peer-reviewedCitation for published item:
See, Beng Huat and Morris, Rebecca and Gorard, Stephen and Siddiqui, Nadia (2019) 'Evaluation of the impact of Maths counts delivered by teaching assistants on primary school pupils' attainment in maths.', Educational research and evaluation. .
Further information on publisher's website:
https://doi.org/10.1080/13803611.2019.1686031Publisher's copyright statement: c
2019 The Author(s). Published by Informa UK Limited, trading as Taylor Francis Group This is an Open Access article distributed under the terms of the Creative Commons Attribution-NonCommercial-NoDerivatives License (http://creativecommons.org/licenses/by-nc-nd/4.0/), which permits non-commercial re-use, distribution, and reproduction in any medium, provided the original work is properly cited, and is not altered, transformed, or built upon in any way.
Additional information:
Use policy
The full-text may be used and/or reproduced, and given to third parties in any format or medium, without prior permission or charge, for personal research or study, educational, or not-for-prot purposes provided that:
• a full bibliographic reference is made to the original source • alinkis made to the metadata record in DRO
• the full-text is not changed in any way
The full-text must not be sold in any format or medium without the formal permission of the copyright holders. Please consult thefull DRO policyfor further details.
Durham University Library, Stockton Road, Durham DH1 3LY, United Kingdom Tel : +44 (0)191 334 3042 | Fax : +44 (0)191 334 2971
Full Terms & Conditions of access and use can be found at
https://www.tandfonline.com/action/journalInformation?journalCode=nere20
Educational Research and Evaluation
An International Journal on Theory and Practice
ISSN: 1380-3611 (Print) 1744-4187 (Online) Journal homepage: https://www.tandfonline.com/loi/nere20
Evaluation of the impact of Maths Counts
delivered by teaching assistants on primary school
pupils’ attainment in maths
Beng Huat See, Rebecca Morris, Stephen Gorard & Nadia Siddiqui
To cite this article: Beng Huat See, Rebecca Morris, Stephen Gorard & Nadia Siddiqui (2019): Evaluation of the impact of Maths Counts delivered by teaching assistants on primary school pupils’ attainment in maths, Educational Research and Evaluation, DOI: 10.1080/13803611.2019.1686031 To link to this article: https://doi.org/10.1080/13803611.2019.1686031
© 2019 The Author(s). Published by Informa UK Limited, trading as Taylor & Francis Group
Published online: 22 Nov 2019.
Submit your article to this journal
Article views: 208
View related articles
Evaluation of the impact of Maths Counts delivered by
teaching assistants on primary school pupils
’
attainment in
maths
Beng Huat See a, Rebecca Morris b, Stephen Gorard aand Nadia Siddiqui a
a
School of Education, Durham University, Durham, UK;bCentre for Education Studies, University of Warwick, Coventry, UK
ABSTRACT
This paper presents thefindings of a 1-year efficacy trial of Maths Counts (MC), an intensive, individualised programme delivered by trained teaching assistants. The programme was delivered 3 times a week over 10 weeks. The sample included 291 Year 3 to Year 6 pupils (age 7 to 11) from 35 primary schools in England. Pupils were individually randomised within school to receive MC or business as usual. The results suggest that MC is effective for children struggling with basic maths skills (ES = +0.12 for general maths skills and +0.18 for maths attitude), but there is no evidence that it is particularly effective for children eligible for free school meals. Staff and pupil absences, and other social-emotional and behavioural difficulties may have prevented some pupils from getting the most from the programme. In general, the trial shows that trained teaching assistants can be effectively deployed to support children’s maths learning.
ARTICLE HISTORY Received 12 June 2019 Accepted 24 October 2019 KEYWORDS
Maths intervention; randomised control trial; primary school; teaching assistants; one-to-one intervention
Background
Achievement in maths is one of the key requirements for success in school and future out-comes (Duncan et al.,2007; Frye et al.,2013). Maths skills are reportedly in high demand in the labour market. Internationally, although England’s maths performance in PISA (Pro-gramme for International Assessment) ranked above the average, low-achieving pupils in England are performing below that of many of the other low-performing countries (Organisation for Economic Co-operation and Development [OECD], 2016), p. 195, Figure 1.5.9). In fact, it is estimated that the gap between the highest and lowest achieving pupils in maths in England is above the national OECD average, equivalent to over eight years of schooling (Jerrim & Shure,2016). Many children who struggle with maths in their early yearsfind it difficult to learn and appreciate maths in later years (Jordan, Kaplan, & Hanich, 2002; Morgan, Farkas, Hillemeier, & Maczuga, 2016; Morgan, Farkas, & Wu,
2009). Once anxiety sets in, learning maths becomes even more difficult because there
© 2019 The Author(s). Published by Informa UK Limited, trading as Taylor & Francis Group
This is an Open Access article distributed under the terms of the Creative Commons Attribution-NonCommercial-NoDerivatives License (http://creativecommons.org/licenses/by-nc-nd/4.0/), which permits non-commercial re-use, distribution, and reproduction in any medium, provided the original work is properly cited, and is not altered, transformed, or built upon in any way.
CONTACT Beng Huat See b.h.see@durham.ac.uk https://doi.org/10.1080/13803611.2019.1686031
will be multiple issues to deal with, including pupils’ self-confidence, self-esteem, aca-demic self-concept, and attitude towards maths.
In the last decade, several programmes have been developed to assist children with maths learning, in England and worldwide. The2008Williams review of primary maths teaching specifically identified the Numbers Count (NC) programme as a promising approach to supporting children in learning maths (Williams,2008). Maths Counts (MC), the programme considered in this paper, is developed from the NC programme. Numbers Count drew much of its pedagogical rationale from What Works for Children with Mathematical Difficulties(Dowker,2004) and is modelled after the literacy programme known as Reading Recovery.
Maths Counts was developed by teachers, and takes on many elements of Numbers Count, the earlier programme. MC also shares a number of features with other maths pro-grammes, including Math Recovery (Smith, Cobb, Farran, Cordray, & Munter,2013), Build-ing Blocks, and Pre-K Mathematics, where pupils progress through a series of developmental levels or graded objectives using a sequence of instructions. These are designed to support early maths learning for children struggling in maths. Previous studies (e.g., Clements & Sarama,2012; Mosher, 2011) have suggested that knowledge of children’s developmental progressions and the use of appropriate teaching strategies to help them move along those progressions are important in developing children’s maths concepts (e.g., reciting number sequences and place values).
MC also has a number of characteristics of effective tutoring identified in the research literature, such as the use of manipulatives (e.g., dienes, Numicons1, counters, beads, and number lines) in developing maths concepts (Fuchs et al., 2005). In accordance with accepted thinking about the effective use of manipulatives (Marshall & Swan,2008), MC is practised within a planned and structured programme.
However, MC differs from NC and other similar programmes in a number of ways. First, unlike Numbers Count and Math Recovery, where tutors are trained to select appropriate tasks, Maths Counts uses a digital platform to assist with the planning, recording, and monitoring of lessons. The Digital Tool suggests activities and resources for each lesson. The Digital Tool is a piece of software specially developed to facilitate the delivery of the intervention, and is populated with content from the National Curriculum (Department for Education [DfE], 2013). It is intended as a one-stop shop which guides the teaching assistant (TA) and the child through a series of learning steps. Examples of learning steps are: counting forward in 10s from a given number, working with number lines, or understanding particular number facts. The Digital Tool stores information about each pupil’s knowledge and understanding of maths concepts and guides the TA in planning the lesson objectives for the individual pupil. Each learning step is represented as a visible clickable area of the tool where the TA can have access to downloadable resources to support the child’s understanding of that particular learning step. These resources could be ideas for the lesson, games, activities, or videos, which then form a document specific for that particular child. For each learning objective, appropriate activities and manipula-tives or resources are suggested. Examples of such activities are throwing and catching a soft football to count in sequenced steps, using straws to count in twos, base 10 or Numicon to secure place value skills, or playing shop using coins to purchase items to develop basic money skills. Once the child shows understanding across more than one activity for a learning objective, the TA records that objective on the Digital Tool,
identifying it as “secure at”and dating it. TAs are encouraged to be confident in their decisions to secure objectives. The learning activities, learning objectives, and progress for the child are stored securely on the computer.
Second, unlike Math Recovery and NC, MC is delivered by trained teaching assistants, also known as learning partners, rather than certified teachers. Systematic reviews of effective instruction have consistently demonstrated that tutoring by paraprofessionals, such as teaching assistants, was as effective as tutoring by qualified teachers (Baye, Lake, Inns, & Slavin, 2017; Inns, Lake, Pellegrini, & Slavin,2018; Pellegrini, Inns, & Slavin,
2018). This was true for both reading and maths and for primary and secondary school pupils, contrary to the earlier review by Wasik and Slavin (1993).
Third, unlike Building Blocks, Pre-K Mathematics (Clements & Sarama, 2012) and Number Rockets, where instruction is scripted to maintain consistency across tutors (Fuchs et al.,2005), MC features personalised one-to-one instruction where each session is tailored to the learning needs of the child. The theory is that individualised provision of one-to-one teaching of number concepts using the connective model and a construc-tivist approach can be effective in supporting the learning of maths concepts for children with low attainment in maths (Haylock & Cockburn,1989). This approach also encourages meta-cognition, or “learning-to-learn” behaviours, which is believed to be effective in improving confidence and ability in maths as well as other outcomes, such as self-esteem, resilience, and personal aspiration (Dowker,2004).
Fourth, like Maths Recovery, MC also emphasises initial diagnosis to adapt instruction to pupils’ level of needs and the developmental progressions of children’s learning and thinking.
Early evaluation of NC by its developer, Edge Hill University, indicated positive effects (Edge Hill University, 2018). The study suggested that children made an equivalent of 17 months’ progress in 4 months (4 times the expected progress). Teachers reported that children were showing more confidence and interest in learning mathematics in class after NC. However, gains were measured using the Sandwell Early Numeracy Test (https://www.gl-assessment.co.uk/products/sandwell-early-numeracy-test-sent/), which is closely aligned with (and even practised as part of) the intervention. Crucially, the evalu-ation did not compare the progress of these children with similar children not receiving NC. In other words, there was no suitable counterfactual, so it is not clear if the children would have made the same progress if they had not had the intervention. The first large-scale independent evaluation of NC (Torgerson et al.,2011), involving 522 pupils from 53 schools in England, reported a short-term impact on children’s maths attainment, measured using the standardised Progress in Maths test (PiM), when compared to those receiving no intervention (ES = 0.33). This was based on post-test scores only, and the intervention group was already ahead at pre-test based on the Sandwell Early Numeracy Test, so it is again unclear how effective NC has been.
A review of rigorous randomised control trials on maths teaching interventions for low-achieving pupils (Baker, Gersten, & Lee, 2002) suggests that interventions that provide data and feedback on maths performance to teachers and pupils (as in Maths Counts) are more effective than those focused solely on the quality of teaching. More broadly, there is already evidence that training TAs more rigorously to help with pupils undera-chieving in maths can be beneficial (Holmes & Dowker,2013). A similar intervention to MC, but with a literacy focus, demonstrated the usefulness of TAs in working with small
groups of pupils for catch up (Gorard, Siddiqui, & See, 2015). This all shows promise. However, the effectiveness of Maths Counts delivered by TAs using the digital platform for planning, recording, and monitoring pupils’progress has not previously been assessed using experimental methods and externally validated outcome measures. The new study described in this paper is thefirst independent robust evaluation of the Maths Counts programme.
Research questions
The aim of the evaluation was therefore to answer two main questions:
. Can the individualised Maths Counts programme delivered by teaching assistants, with digital support, have an impact on the maths skills of primary school children struggling in maths compared with an equivalent but“business-as-usual”control group?
. How effective is MC for more disadvantaged children eligible for free school meals? Subsidiary questions were:
. Does the programme also improve children’s attitude towards maths?
. How feasible is it to implement the programme with teaching assistants?
The intervention
MC is a 10-week programme, consisting of 30-minute one-to-one sessions for primary school children struggling with basic maths skills. The target children were those in Key Stage 2 or Years 3, 4, 5, and 6. These would be children between 7 and 11 years of age. The intervention was delivered by specially trained teaching assistants three times a week during curriculum time but outside the regular classroom. The key feature of MC is that it is tailored to the needs of the individual pupil.
Before a child begins on the programme, a set offive to seven initial diagnostic lessons are carried out to establish what the child can do and what aspects of maths need to be addressed. These diagnostic lessons were conducted by maths leads (ML) on a one-to-one basis using the Sandwell Early Numeracy Test. MLs are experienced teachers, responsible for leading on maths in their schools. They received prior training from the MC developers on conducting diagnostic lessons. The Sandwell Test assesses a pupil’s ability with numbers, through exploringfive strands of basic numeracy skills: identification, oral count-ing, value, object countcount-ing, and maths vocabulary from the National Curriculum.
Each diagnostic lesson lasts 30 minutes. These are divided into three 10-minute activi-ties. Each lesson is divided into themes, for example, counting, number system, number facts, or calculation. For each of these themes, there are suggested activities and guidance notes on what to look for. To understand the learner’s understanding, pupils are asked probing questions, for example:“How do you know?”;“Can you show me in a different way?”;“How could you check your answers?”The MLs enter the information from the diag-nostic lessons onto the Digital Tool to set a baseline for planning. This shows what learning objectives the learner has achieved and what needs to be achieved. This information is then uploaded onto the Digital Tool and used by the TAs to plan each lesson.
MC lessons are conducted behind a privacy board which creates a “Mini Learning Environment” (MLE). Each pupil also has a personalised Maths Map, which is a visual image of the progress they are making. This was designed as a talking point for the pupil and the TA in order to raise self-confidence and support pupils in reflecting upon their own learning and progress. A key element of MC includes the modelling of accurate use of mathematical language and terminology, encouraging the children to become fam-iliar with this, and to support their understanding of numerical ideas. MC teaching is focused on gaps in the children’s knowledge, building on what they already know. TAs are encouraged to employ a positive scaffolding framework approach to their interactions where prompts and cues help learners to arrive at the answers themselves or to self-correct. The Maths Counts programme includes a specific set of resources to support and promote learning. For this trial, a box of manipulatives (containing beads, coins, Numicon, and so on) was provided.
The content of the lessons is aligned with the primary maths National Curriculum. This includes number and place value; counting to 100 forward and backwards from any given number; ability to count, read, and write numbers in numerals and words; count in mul-tiples of twos, fives, and tens; identify and represent numbers and place values using objects and visual representations including the number line; and use maths vocabulary such as equal to, more than, or less than, first, second, third. In addition, children are taught to read, write, and interpret mathematical signs indicating addition (+), subtraction (−), and equals (=); compare and order numbers using <, >, and = signs; use number bonds; solve problems involving multiplication and division; solve problems with addition and subtraction mentally, fractions, measurement, 2-D and 3-D shapes, and position/direc-tion (e.g., above, between, around near).
The training of MLs and TAs began soon after schools were recruited for the trial described in this paper, and their participation confirmed. All MLs and TAs attended two full days of training, focused on the theory of the intervention, lesson planning, the Digital Tool, and use of the teaching resources provided. MLs were also trained to use the diagnostic assessment. In addition, TAs received four planned CPD (continuing pro-fessional development) workshop sessions delivered by the MLs. These sessions included specific training linked directly to issues that TAs could potentially encounter in their teaching, and included the use of manipulatives, questions, and teaching multiplication and division. Further information on the programme can be found on the developer website:https://mathscounts.co.uk/
Control group activity
According to our observations (below), while treatment pupils were taken out of the class-room for the MC sessions, control pupils carried on with their usual lessons including any small-group intervention they would have been receiving anyway. Control pupils may also be pulled out of lessons for intervention but these tended to be in small groups or in pairs as opposed to the one-to-one sessions for MC pupils. Such small-group interventions were also conducted by TAs, but they were not structured or prescriptive. Typically, pupils do practise maths with the TAs using materials prepared by the classroom teacher. To ensure that children receiving MC did not miss out on the whole class core maths instruc-tion, schools rotated the lessons used for withdrawal.
Methods used for the independent evaluation
The authors were funded to conduct an independent evaluation of Maths Counts, and monitored every stage from recruitment and training of the schools to post-intervention testing.
Trial design
This was a two-arm efficacy trial in which pupils were individually randomised within schools to receive MC (treatment group) or business as usual (control).
Although individual randomisation of pupils is the most powerful and flexible approach, it can run the risk of diffusion. This was minimised since control children did not take the diagnostic lessons, and there were no identified activities that TAs could use with them. The Digital Tool was password protected, so that only treatment pupils’ progress and activities could be accessed by TAs. Direct observations of control pupils during school visits indicated that TAs were not using the programme resources with control pupils, and no evidence of programme diffusion was identified.
The participants
The participants were pupils in Years 3 to 6 (age 7 to 11) from 35 schools in England. All schools recruited were new to the programme, as Maths Counts had never been used or tested before. Eligible pupils were those identified by their teachers as working below the National Curriculum Year 2 Programme of Study for their year, and were thus at risk of not achieving the nationally expected levels in maths. Because pupils were individually random-ised within each school, variation among teachers’judgement is therefore not an issue since the same teachers selected both intervention and control pupils. Therefore, the same judge-ment is applied to both groups. Teachers identified pupils working below the level expected of their age group as determined by pupils’performance in Key Stage 1 assessment, which is a standardised national assessment closely monitored by the Standards and Testing Agency.
A total of 305 pupils were recruited with an average of 8.7 pupils in each school. The achieved sample was determined by the fact that the delivery team had limited capacity to support a larger number of schools, and this was agreed with the funder.
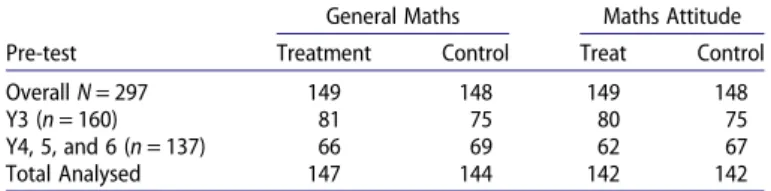
Eight pupils with post-test scores did not have Key Stage 1 maths scores (KS1 maths), which were used as their pre-test. It is possible that these pupils had either recently arrived from other countries or came from independent schools (where there is no KS1 assess-ment). Pupils could also have simply missed the KS1 assessment due to illness or absence. In addition, there were six pupils missing post-test scores. These were pupils who left the country and could not be tracked or moved to a school that did not agree to let the pupils take the post-test. They were excluded from analysis. In thefinal analyses, 291 cases were included.Table 1shows the number of pupils with pre-test scores (KS1) for General Maths, and the Maths Attitude module of the InCAS assessment. InCAS is a stan-dardised online computer-adaptive test developed by the Centre for Evaluation and Moni-toring (CEM) (http://www.cem.org/incas) and is suitable for children age 5 to 11. As it is adaptive, it adapts to the level and age of the individual child in an ongoing manner. It provides age-standardised and age-equivalent scores.
To assess the extent to which the achieved sample matches primary schools in England more generally, we compared the characteristics of the trial schools to all primary schools in England using the Department for Education (DfE) School Performance Tables (2015). The trial schools were more likely to be lower performing schools (Table 2). They had pro-portionately more children with special educational needs (SEN) and eligible for free school meals (FSM–a proxy for a child’s socioeconomic status). This was by design and at the request of the funder. They were less likely to have children for whom English is an additional language (EAL). This is probably because of the geographical location of the schools, being largely concentrated in the South West of England, a predominantly White British area.
Sample size calculation
The sample size calculation was based on the assumption that there would be 30 schools and four year groups (Years 3, 4, 5, and 6). We calculated the sample size needed for any
“effect”size to be considered secure by considering a priori the number of“counterfactual” cases needed to disturb afinding (Gorard,2018). This“number needed to disturb”(NNTD) is calculated as the “effect” size (ES) multiplied by the number of cases in the smallest group in the comparison (i.e., the number of cases included in either the control or treat-ment group, whichever is smaller). This approach allows for estimating ES and sample size using the formula as shown:
NNTD = ES*n
Therefore,n=NNTD/ES
With 152 cases in the smaller group, to achieve an NNTD of 40 would require the under-lying effect size being sought to be 0.26 or greater.
Traditional “power” calculations are based on the invalid approach of significance testing (Gorard, See, & Siddiqui,2017), and so are not appropriate here (see below).
Table 1.Number of pupils with pre-test scores by year groups for the three modules combined.
Pre-test
General Maths Maths Attitude Treatment Control Treat Control OverallN= 297 149 148 149 148
Y3 (n= 160) 81 75 80 75
Y4, 5, and 6 (n= 137) 66 69 62 67 Total Analysed 147 144 142 142
Table 2.Comparison of trial schools and all primary schools in England (based on the 2015 School Performance tables).
Pupil level (categorical) All primary schools (%) Trial schools (%) Proportion achieving Level 4 and above in reading, writing, and maths 80.0 76.0 Proportion of pupils eligible for FSM 15.6 17.2 Proportion of pupils with SEN support 13.0 16.5 Proportion of pupils with EAL 19.4 14.4 Source: DfE (2015).
Randomisation
Once pupils were determined as being eligible, opt-out consent was sought from parents before pupils were randomised (this was before GDPR2legislation was in force). Randomis-ation was carried out by the independent evaluator using a random number generator programme (random.org). Pupils were individually randomised within the school to receive either the intervention or business-as-usual control.
No school dropped out, and no parents refused their children participation after ran-domisation.Figure 1shows the participantflow diagram from recruitment to analysis.
Outcome measures
Baseline attainment was the Key Stage 1 (KS1) maths scores obtained for each pupil from the National Pupil Database (NPD)3, used to assess baseline equivalence between the two experimental groups. The use of KS1 assessment results, rather than a version of the post-test, for baseline was preferred by the funder as it reduces the burden of additional tests for children. In England, children are assessed at key stages. Key Stage assessments are
statutory assessments carried out in publicly funded schools. Key Stage 1 assesses the attainment of pupils against the programme of study of the National Curriculum at the end of Key Stage 1 when pupils are age 7.
The primary post-intervention outcome was General Maths skills, measured using the InCAS assessment. General Maths tests pupils’ understanding of counting, place values, fractions, patterns, problem-solving, measures, shapes and space, and data handling.
The secondary outcome was children’s attitude towards maths. This was measured using the maths-only questions in the attitudes subscale of the CEM InCAS test.
Analyses
The headline analyses were conducted based on intention to treat (ITT). This means that all children were analysed as they had been randomised, regardless of whether they received the intervention or not, and all pupils were followed up as far as possible even where they had left their school. ITT overcomes the potential problem of noncom-pliance and dropouts and maintains prognostic balance created by random allocation (Wertz,1995). It is meant to give an unbiased estimate of the treatment effect in real-life conditions.
There was some imbalance in the pre-intervention scores (the intervention group was ahead of the control children). This is due to the vagaries of randomisation. Therefore, the headline impact was measured using the gains or progress children made between pre-intervention (KS1 maths) and post-pre-intervention (InCAS Maths). The results are presented as Hedge’sg“effect”sizes using the difference in the standardised mean gain scores for the two groups, divided by the overall standard deviation of the gain scores.
Whilettests and analysis of variance have commonly been used to compare the means of two or more groups, to determine if they are“significantly”different, this approach is not recommended (Lipsey et al., 2012). A significance test estimates the likelihood that the data for different samples drawn randomly from a population are compatible with the parameters of that population if the parameters of that population are known (Col-quoun,2016; Pharoah, Jones, & Kar,2017). This is not the case here, and so even if the data had been a complete random sample, significance testing would still not have been appropriate.
KS1 assessment is a teacher-assessed record of pupils’performance at the end of KS1 when children are age 7. Teacher assessment might be considered more unreliable and open to bias than independent testing, but this is less so in maths marking, where there are usually clear right and wrong answers, and there are very clear guidelines in the National Curriculum framework about what this means (Standards and Testing Agency [STA],2017). In England, KS is a national assessment set and delivered by the Stan-dards and Testing Agency. While it may be teacher assessed, it has to comply to strict gui-dance laid down in the Department of Education Assessment and Reporting Arrangement in terms of administration, marking, and moderation. Marking is monitored by the Stan-dards and Testing Agency to ensure that pupils’responses are marked accurately and con-sistently. Teachers receive training in assessment, and the assessment is externally moderated by local authorities and other recognised bodies. Moderation ensures marking is consistent, accurate, and valid (STA,2012). Marking schemes also ensure con-sistency and reliability.
At the time of the trial, changes were made to the KS1 assessment framework. This meant that for the older cohort (Years 4, 5, and 6), the KS1 results were in point scores, whereas for the younger cohort (Year 3), the results were presented as descriptive cat-egories (a system brought in after the trial was set up).
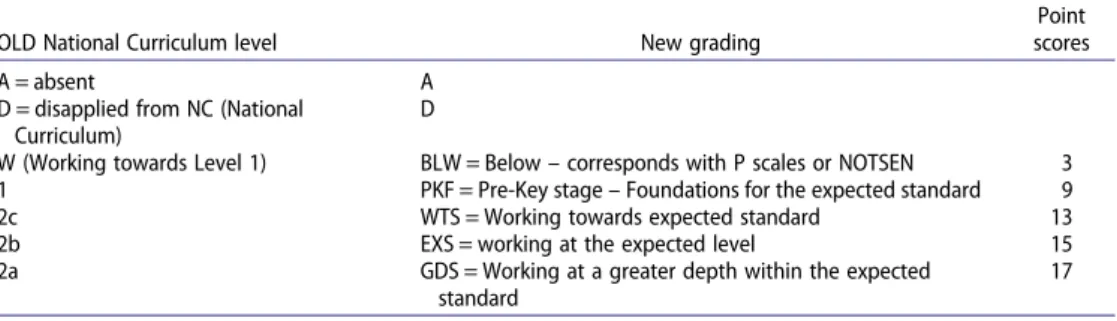
To combine all baseline data points, we converted the descriptive measures for the Year 3 cohort to a score approximately equivalent to the National Curriculum levels (Table 3). This was the system already used by some of the schools in the trial in making comparisons between the old and new grading system. For example, if Level 2b is the expected level for Year 3 pupils, the new grading WTS (working towards expected standard) will be equiv-alent to Level 2c and the new PKF (pre-key stage foundation for the expected standard) will be equivalent to Level 1 (achieved Level 1) and so on (seeTable 3). These grades were then converted to the point score equivalent for each grade. The point scores for maths at KS1 (age 7) range from 3 to 17, where 15 means that the child is working at the expected level for their age, 17 means that the child is working above the expected level, and 13 indi-cates that the child is working towards the level expected for their age. Scores of 3 and 9 indicate that the child is working below their age-expected level.
Additional analyses
The same analyses were conducted using only pupils eligible for free school meals, to esti-mate the impact for disadvantaged pupils.
Since not all pupils received the recommended number of sessions, ITT analysis may underestimate the effects. Therefore, we also assess the impact offidelity to treatment using the number of sessions that children actually received as recorded on the Digital Tool, and correlate this with their General Maths scores.
Further analysis was carried out to estimate the treatment effects where not all pupils in the treatment group receive the recommended dosage. This was done using the complier average causal effect (CACE) analysis (Nicholl, n.d.). Complier here is defined as completion of the minimum number of 30 sessions. Essentially, it is a comparison of what actually happens with what might have happened (Ye, Beyene, Browne, & Thabane,2018). The complier average causal effect is estimated using known information about the treatment outcomes and the assumptions that because of randomisation the proportion of com-pliers in the control would be the same as for treatment, and the average outcome for those in the control group who did not comply would be the same as the outcome of non-compliers in the treatment group (Cell D,Table 4).
Table 3.Mapping of new and old KS1 point scores to levels.
OLD National Curriculum level New grading
Point scores
A = absent A
D = disapplied from NC (National Curriculum)
D
W (Working towards Level 1) BLW = Below–corresponds with P scales or NOTSEN 3 1 PKF = Pre-Key stage–Foundations for the expected standard 9 2c WTS = Working towards expected standard 13 2b EXS = working at the expected level 15 2a GDS = Working at a greater depth within the expected
standard
Given that we know the overall results for both groups (Cells F & K) and the data for those in the treatment group who complied and who did not comply (Cells A to D), we can calculate the average outcome for those in the control group who would have com-plied if given the treatment (x). The proportion in treatment group who complied is assumed to be A/E:
. Number in control group who complied (Cell G) will be A/E*J
. Number of non-compliers in control group (Cell H) will be J-G
. The average outcome for compliers in the control group (x) is calculated thus:
x=((J*K)−(H*I))/G
Missing cases
As missing cases can bias results even if attrition is balanced between comparator groups (Dong & Lipsey,2011) and pose a threat to the validity of any conclusion reached even when advanced statistical methods like multiple imputations are used (Campbell & Stanley,1963; Foster & Fang,2004; Little & Rubin,1987; Puma, Olsen, Bell, & Price,2009; Shadish, Cook, & Campbell,2001), we did two things to address this.
First, we compared the pre-test scores of pupils missing post-test scores to check if the groups were more unbalanced as a result of missing data, and whether this could have influenced the results (Table 5). Those missing post-test scores from the treatment group have slightly higher average pre-scores than those missing from the control. However, because the overall number missing post-test was so small (4% for Maths Atti-tude and 2% for General Maths), there is no reason to believe that these cases have influenced the overall result substantially (seeTable 5).
Second, we compared the number of missing cases to the number of counterfactual cases needed to disturb (NNTD) the finding (for a fuller explanation of NNTD, see Gorard,2018). The number of counterfactual cases (NNTD) is the number of hypothetical cases in the opposite direction to thefindings that would be needed in order to alter the
findings by making the effect size zero. Comparing the number of missing cases with NNTD will help determine whether the number of missing cases is large enough to alter/explain thefindings. It is a measure of how stable the result is after attrition. NNTD
Table 4.CACE formula.
Participants Compliers Non-compliers All
Nwho completed minimum
30 sessions Mean N
who did not complete the minimum number of sessions Mean
Total
N Mean
Treatment A B C D E F
Control (G) (x) (H) (I) J K
Note: The scores in brackets are estimated for the control group using the knownfigures for the treatment.
Table 5.Pre-scores for cases missing post-test scores.
Treatment missingN Treatment mean SD Control missingN Control mean SD
General Maths 2 13.00 0 4 12.5 2.52
is calculated as the“effect”size multiplied by the number of cases in the smallest group in the comparison.
The number of cases actually missing a value is then subtracted from the NNTD to give an estimate of how large the“effect”size would be even in the extreme situation that all missing cases had the strongly “counterfactual” score hypothesised in the NNTD calculation.
Process evaluation
Fidelity of implementation was assessed by the evaluators via direct observations of the MC sessions and interviews with pupils and teaching staffin 12 of the schools. Six of the schools were visited twice, once at the beginning and once at the end of the trial to observe changes in teachers’and pupils’behaviour. The other schools were visited only once (at the beginning) because schools could not accommodate the evaluation team at the end of term due to other school activities going on at the same time, such as school inspections, mock exams, staffabsence, or, in one case, school building work. Face-to-face interviews were conducted with 12 MLs, 15 TAs, and 12 pupils across the 12 schools.
To help ensurefidelity of implementation and quality of instruction, the intervention developers also made coaching visits to schools where it was revealed on the Digital Tool that TAs had not secured the required number of objectives for the pupils. Coaching visits consisted of direct observations of lesson delivery followed by discussions with TAs on the challenges and barriers to implementation. Additional feedback was collected from all the other participating schools at the end of the trial from the review and feedback ses-sions organised by the programme developers. Data collected from these observations, the interviews, and from the review and feedback sessions provided information for the process evaluation.
Fidelity of implementation was further determined by the number of sessions delivered as recorded on the Digital Tool. These data were used to estimate dosage and for the cal-culation of the compliance analysis.
Findings
Is there evidence that MC improves the maths skills of children in general?
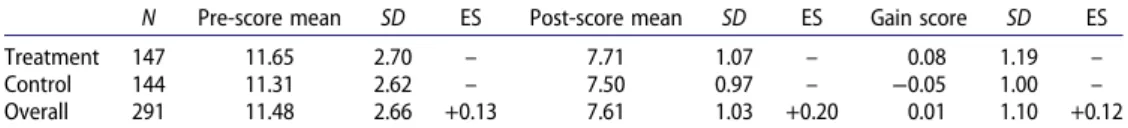
To estimate the impact of MC on children’s maths skills, we used a gain score analysis (and standardised both pre- and post-scores before computing the gain). This is because the groups were not fully balanced at pre-test (ES of +0.13) and therefore using the post-test scores only would be misleading. For the benefit of readers, we also present the results for both the pre-test and post-test scores.
Table 6shows that MC has a small positive effect on pupils’General Maths skills (ES = +0.12). The treatment group made a small gain between pre- and post-test, whereas the control group actually showed negative progress. Regardless of whether gain scores or post-test scores were used, the substantive result is the same (effect size +0.20 for post-test only and +0.12 for gain scores; seeTable 6).
Note that we do not use significance tests and confidence intervals as these are based on the strict assumption that there are no missing data. And even if this condition was met,
they would still not be appropriate because they only tell us the probability of observing the results we get assuming that there is no difference between the groups (Colquoun,
2014,2016; Gorard,2019). What we are interested to know is whether there is, indeed, any difference between groups.
To ensure that the results are not created only by the missing data, we calculated the NNTD (explained above). NNTD is the number of counterfactual cases needed to alter this
finding, and is estimated as ES*n(size of the smaller group), or 0.12*144, which is 17. This means that it would take 17 missing cases to eliminate the effects. Since there were only six missing cases, this means that it is not possible for this result to be created solely by the missing data. It is therefore reasonably safe to say that the results can be attributed to the intervention.
The results also suggest that Maths Counts has a small positive effect on children’s Maths Attitude, with the treatment group showing higher scores than the control children (Table 7). However, thisfinding was based on post-test scores only, since there was no pre-test for Maths Attitude, and so must be treated as more indicative than definitive.
Does MC benefit FSM-eligible pupils?
To estimate the effect of MC for disadvantaged children, we analysed the results of only those eligible for free school meals in the last 6 years (EverFSM6). The results, presented inTables 8and9, suggest that MC has not been effective in improving the maths skills of disadvantaged pupils. In fact, there appears to be a negative impact on their General Maths performance, so the headlinefinding must be due to greater gains for
non-FSM-Table 6.Comparison of pre, post, and standardised gain scores for General Maths (age equivalent), all pupils.
N Pre-score mean SD ES Post-score mean SD ES Gain score SD ES Treatment 147 11.65 2.70 – 7.71 1.07 – 0.08 1.19 – Control 144 11.31 2.62 – 7.50 0.97 – −0.05 1.00 – Overall 291 11.48 2.66 +0.13 7.61 1.03 +0.20 0.01 1.10 +0.12 Note: The pre-intervention scores (KS1) use a different scale to the post-intervention scores (InCAS test).
Table 8.Comparison of gains scores and post-test scores in General Maths for EverFSM6 pupils. N Pre-scoremean SD ES Post-score mean SD ES Gain score SD ES Treatment 67 11.33 2.86 – 7.51 1.04 – −0.09 1.24 – Control 66 10.70 2.92 – 7.50 0.99 – 0.07 1.09 – Overalln (missing) 133 (4) 11.06 2.89 +0.22 7.50 1.02 +0.01 −0.01 1.17 −0.14
Table 7.Comparison of Maths Attitude (age equivalent) for all pupils. N Post-score mean SD ES
Treatment 142 46.27 45.75 –
Control 142 37.72 48.64 –
Overall 284 41.99 47.33 +0.18 Note: The Maths Attitude scores were only provided by CEM as not age equivalent,
eligible pupils. However, these results should be interpreted with caution. Given the smaller number of pupils eligible for free school meals (N= 133), the results can be more volatile.
Does the number of sessions received make a difference to the outcome?
The mean number of sessions received by children in the intervention group was 30.8 with a mode of 34. Of the treatment group, 58 learners did not achieve the minimum number of 30 sessions recommended, while 94 learners received the recommended 30 lessons with a large percentage well in excess of this number. Two learners did not receive the interven-tion because their TA left and no replacement could be found. One treatment child left their school before the programme started so did not receive the intervention; one left in the middle of the course (so had only 11 sessions); and one child was excluded from school (so had only 15 sessions). The complex needs of another child prevented them from accessing the lessons as regularly as hoped; and for three children, there was an interruption when their TAs left and a replacement had to be found and trained. These three children received 25, 20, and 18 sessions. For the remainder, the most common reason for the low dosage was pupil absence. There were also staff absences due to illness, which could sometimes affect the number of lessons delivered.
Correlation analysis showed a small positive relationship between both post-scores and gain scores in General Maths and the number of sessions received (Table 10). In other words, the more sessions a child received, the higher their maths scores to some extent (and vice versa). It is difficult to say exactly what this means because pupils who missed sessions or who were regularly absent may face other issues which contribute to their attainment (and which are not investigated within the scope of this project). There may also be the increased likelihood of issues in relation to motivation or confidence for these children.
Analysis of compliance, where compliance is a minimum of 30 sessions (this is the rec-ommended number of sessions that the developers felt would be needed if results are to be realised), shows positive effects whether we use post-test scores (Table 11) or gain scores (Table 12).
Using post-test scores and the overall standard deviation fromTable 6, the effect size based on compliers (those who completed at least 30 sessions) is +0.30. This complier effect is bigger than the overall post-intervention headline ES of +0.20, and thus gives
Table 9.Comparison of gains scores and post-test scores in Maths Attitude for EverFSM6 pupils.
N Post-score mean SD ES
Treatment 64 47.94 46.89 –
Control 65 44.89 43.68 –
Overalln(missing) 129 (8) 46.42 45.18 +0.07
Table 10.Correlation between number of sessions attended and General Maths (age equivalent), all pupils.
General Maths post-scores (n= 291) Gain scores
more weight to the idea that the intervention, conducted as intended, was effective for all pupils in general. The CACE process was repeated with the gain scores (Table 12). Again using the overall SD for gain scores from Table 6, this shows a complier ES of +0.19, larger than the headline figure of +0.12, again suggesting that the difference could be due to the intervention.
Fidelity of implementation
Information collected from the Digital Tool helped the project team to track the planning and delivery of the intervention. Data on the number of sessions planned, the number of times that TAs had logged-on to the system, and the number of learning objectives secured by each pupil are all recorded on the Digital Tool (Table 13). In all hubs (schools were grouped by regions called hubs), over half of the treatment pupils managed to receive the minimum 30 sessions.
In the schools we observed, appropriate space was found to deliver the lessons. In some schools, the sessions were conducted either along the common corridor, which was quiet during lessons, and behind the mini learning environment, which provided some privacy for the children, and in others a dedicated room was found for the TAs. In all schools visited, TAs were observed to deliver the intervention as they were trained. Lesson activi-ties and lesson objectives were planned on the Digital Tool. In line with the MC training, TAs employed a range of questioning techniques throughout the sessions, such as:“What is happening here?”,“How do we know this?”, and“Can we check this?”These encouraged the children to explain and justify their thinking and their mathematical reasoning. TAs were generally supportive, using positive language, praise, and subject-specific
Table 11.CACE compliance based on 30+ sessions and General Maths post-score (age equivalent).
30+ sessions <30 sessions Overall
N Mean N Mean N Mean
Intervention 90 7.76 57 7.64 147 7.71 Control 88 7.41 56 7.64 144 7.50
Table 12.CACE compliance based on 30+ sessions and General Maths gain score.
30+ sessions <30 sessions Overall
N Mean N Mean N Mean
Intervention 90 +0.12 57 +0.02 147 +0.08 Control 88 −0.09 56 +0.02 144 −0.05
Table 13.Number of sessions planned for learners in each hub.
Learners with at least 30 sessions planned
Learners with less than 25 sessions planned
Total number of learners in hub Hub 1 (mean = 31) 21 4 36 Hub 2 (mean = 27) 18 9 32 Hub 3 (mean = 31.5) 26 7 44 Hub 4 (mean = 33.2) 30 3 40 Total 95 23 152
terminology that forms part of the MC programme. Time was given for pupils to think, make mistakes, and self-correct. Lessons were generally delivered as per protocol. There is some suggestion that it is the nurturing and attention that the low achievers received and the close rapport they have developed with the TAs that motivated them (Slavin,
2019). MC encourages TAs to be supportive and encouraging. Children’s every little success is celebrated. Slavin (2019) believed that the one-to-one delivery allows TAs to give nurturing and personal attention to struggling learners. And it is this positive learning environment where children are not made to feel like failures that motivates them to want to do well (Inns et al.,2018; Pellegrini et al.,2018).
A common complaint from TAs was that there was some initial confusion about the Digital Tool and how to use it. A number also fed back that some of the learning objectives were not clearly linked with the activities, and this had made planning difficult and some-times time consuming. TAs reported that they were well supported by MLs. The process evaluation suggests a number of other factors that may have impacted on the outcomes, and some lessons that can be learnt from this trial. One of these is pupil absences, which have impacted on the optimal delivery of the programme. About 18% of the treatment pupils had fewer than the recommended minimum number of sessions due to frequent absences. The CACE analysis suggests that compliance to the minimum number of ses-sions is associated with greater impact. So it is important that that attendance is moni-tored, and children receive at least 30 of the recommended sessions.
A small number of children were observed not being able to read mathematical symbols. This suggests that an area for further development may need to be around the understanding of basic mathematics symbols.
Impact on teaching assistants
In addition to the impact of MC on children’s maths skills and attitude, the programme may also have a beneficial effect for the teaching assistants. The trial has shown that teach-ing assistants, if properly trained, can be deployed to deliver the programme successfully. Some of the teaching assistants reported that they had learnt a lot about how to utilise the various common, but rarely used, resources, such as the Numicon and dienes. Many teach-ing assistants also reported that they felt empowered. For thefirst time, they were not simply just doing maths problems with pupils that were set by the classroom teacher or working in a supporting role; instead, they were preparing, developing, and delivering the lessons themselves, as well as monitoring the children’s progress. They were also receiving high-quality, personalised, and subject-specific CPD, something which most of them had not experienced before.
Limitations
While the trial was well designed, there were a number of limitations beyond the evalua-tors’control that might influence the strength of the evidence adversely. The biggest limit-ation is the sample size. To protect the integrity of the programme, each TA could only support four pupils. Schools’capacity meant that they could not release more stafffor the programme. These factors limit the scale of the study, and thus reduce the likelihood of detecting a minimum effect size.
The use of KS1 results for the pre-test (a decision made by the funder) and the InCAS assessment for the post-test is likely to dampen the effect size. The two tests have a lower correlation compared to using the same test for pre- and post-assessments. In this trial, the correlation coefficient between the KS1 scores and the InCAS assessment is only 0.40, whereas equivalent pre- and post-attainment scores are more usually around 0.70.
Finding an appropriate assessment for the kind of children being supported is another factor to consider. Maths Counts only delivers lessons on number skills, but we could only
find normative assessments that assessed general maths. The Sandwell Early Numeracy Test is an option, but this was not considered appropriate for the trial as it had many aspects which were closely aligned with the intervention. The most appropriate assess-ment at the time was the CEM InCAS assessassess-ment, which is adaptive but also includes data handling, shapes, and space. The latter were not the focus of MC.
In terms of generalisability, the schools in the trial are fairly similar to those in England but more likely to have higher proportions of pupils eligible for FSM and with reported SEN. They also tend to be lower performing schools with a lower than average proportion of pupils attaining Level 4 and above at KS2 in reading, writing, and maths. This was a require-ment of the funding–to target schools with higher than average disadvantaged pupils. The trial schools were mostly located in the South and South West of England, in big cities like London and Bristol and small towns with largely White populations. These schools have proportionately fewer pupils who have English as an additional language compared to the national average. So, in this respect, the results may not be representative of schools in other parts of England where the demographics are slightly different.
Future research
With most trials, there is the issue of intervention decay, where the schools go back to business as usual after the trial ends and researchers leave the field. If possible, we would like to follow up these schools tofind out a year later how many have actually con-tinued with the programme as it is, how many have concon-tinued with the programme but in a modified form, and how many have abandoned it completely. We would also like to see how many of the control schools decide to adopt the programme after the trial.
Feedback from the schools suggests that they would mostly like to continue with the programme but with less intensity (once a week rather than three times a week) and on a small-group basis (two or three pupils) rather than on a one-to-one basis. The main concern was cost in terms of the amount of time TAs spent on preparation and delivery. If they could do it on a small-group basis, it would be more cost effective.
There are some accounts suggesting that this programme might also work with small groups for younger children. Edge Hill had done their own evaluation and found that the small-group intervention does not work as well with older children (Edge Hill University,
2018). But these assumptions have not been tested properly in randomised trials. So future research might want to look into whether a modified version of Maths Counts, and with different age groups, is as or more effective. If so, this may be a more efficient and appealing approach for schools to adopt.
Future research could also look intofinding a suitable test for assessing number skills only for children whose maths skills are still at the elementary stage for their age. For a
stronger evidence of effect, future study could use the same instruments for measuring outcomes pre and post.
Conclusions
The process evaluation revealed some challenges that may have affected how children received the intervention. It was observed that a few children displayed social-emotional and behavioural difficulties, as well as challenges with maths, which could not be addressed by the programme. A recent EEF/RS (Education Endowment Foundation and the Royal Society) review suggests literacy as an important mediating factor in learn-ing science (Nunes et al.,2017). Poor literacy skills and other special educational chal-lenges, such as dyslexia, can affect children’s learning, presumably of maths also. Research evidence suggests that there is a close link between low income, mental health, and attainment at school (Bradley & Greene, 2013; Gutman & Vorhaus, 2012; Public Health England [PHE], 2014). The challenges faced by a number of children in the trial may be more than just a lack of understanding of mathematical concepts. So while the programme might be successful in supporting those who struggled in a whole-class environment, it may be less successful in helping those who have more complex needs. Feedback from teaching staff suggested that the programme is less suited to those with more general learning difficulties. Perhaps, future trials may also want to consider how these children can be supported in other ways to help them access the curriculum. Enhancing the general wellbeing of children may be a precursor to effective learning (PHE,2016; Weale,2017).
Staffabsences and TAs being used for other duties have also affected optimal delivery. This can impact attainment (Miller, Murnane, & Willett, 2008), and can be disruptive to some children who take time to develop a rapport with adults. Staffabsences and turnover also meant that children missed lessons and did not have the continuity that may have been beneficial. This is, of course, an issue that has implications beyond the delivery of a single intervention. Current data, however, suggest that the number of TAs in schools in England is falling (Webster, 2018), probably due to schools’ budget constraints. This could be a concerning development when the evidence points towards their potential value for learners’outcomes, when deployed appropriately. The importance of a stable staffpresence in school when running an intervention like this (and indeed in general day-to-day teaching) also points to some of the challenges in schools relating to the environment and workload. In order to ensure that staff are present and able to support interventions such as MC, it is important that they feel supported by senior leader-ship in the school, and that those tasked with leading the delivery (in this case, TAs) are given adequate and protected time to do so.
Thefindings of this trial add to the existing evidence that teaching assistants can be deployed effectively to support children’s learning (Gorard et al., 2015; Holmes & Dowker, 2013; Sharples, Webster, & Blatchford, 2015). But the relatively small sample size and the low correlation between the pre-test and the post-test makes it difficult to attribute the results to the intervention with full confidence. Cost, other than the TA time, was minimal. This new study finds that the Maths Counts approach has a small benefit, but will not reduce the“poverty gradient”in basic maths attainment at primary school. Something else is needed as well (or even instead).
Notes
1. Numicons areflat plastic shapes with holes, with each shape representing a number from one to 10. Each number has its own colour.
2. GDPR is the EU General Data Protection Regulation, which regulates the way personal data are collected and processed. It came into force in May 2018. Under GDPR, there are certain con-ditions under which personal data can be collected and analysed.
3. The NPD is a collection of datasets compiled by the DfE. Among the datasets are results for national curriculum tests and public exams. To access these data, an application has to be made to the DfE and strict security protocol has to be followed.
Acknowledgements
The project was funded by the Education Endowment Foundation. The full evaluation report and protocol are available on the EEF website (see: https://educationendowmentfoundation.org.uk/ projects-and-evaluation/projects/maths-counts/). Please note that the report and the protocol are subject to the Crown copyright © Crown copyright [2018].
Disclosure statement
No potential conflict of interest was reported by the authors.
Notes on contributors
Beng Huat Seeis Associate Professor at Durham University. She is a Fellow of the Higher Education Academy, of the Royal Society of Arts, and of the Wolfson Research Institute for Health and Well-being. Her research expertise is in the synthesis of research evidence and evaluations of education programmes and government policies.
Rebecca Morrisis a lecturer at the University of Warwick. She is a Fellow of the Higher Education Academy. Her research interests are in education and social policy, teacher education, widening par-ticipation, and assessment.
Stephen Gorardis Professor of Education and Public Policy, Fellow of the Wolfson Research Institute at Durham University, and Honorary Professorial Fellow at the University of Birmingham. His work concerns the robust evaluation of education as a lifelong process, focused on issues of equity and effectiveness.
Nadia Siddiquiis Associate Professor at Durham University. Her research interests are in exploring the stubborn patterns of poverty and inequality. Her research expertise is in the analysis of large-scale longitudinal data sets.
ORCID
Beng Huat See http://orcid.org/0000-0001-7500-379X
Rebecca Morris http://orcid.org/0000-0002-1699-4172
Stephen Gorard http://orcid.org/0000-0002-9381-5991
Nadia Siddiqui http://orcid.org/0000-0003-4381-033X
References
Baker, S., Gersten, R., & Lee, D.-S. (2002). A synthesis of empirical research on teaching mathematics to low-achieving students.The Elementary School Journal,103(1), 51–73.
Baye, A., Lake, C., Inns, A., & Slavin, R. E. (2017). Effective reading programs for secondary students. Baltimore, MD: Johns Hopkins University, Center for Research and Reform in Education. Bradley, B. J., & Greene, A. C. (2013). Do health and education agencies in the United States share
responsibility for academic achievement and health? A review of 25 years of evidence about the relationship of adolescents’ academic achievement and health behaviors. Journal of Adolescent Health,52(5), 523–532.doi:10.1016/j.jadohealth.2013.01.008
Campbell, D. T., & Stanley, J. C. (1963). Experimental and quasi-experimental designs for research on teaching. In N. L. Gage (Ed.),Handbook of research on teaching(pp. 171–246). Chicago, IL: Rand McNally.
Clements, D. H., & Sarama, J. (2012). Early childhood mathematics intervention.Science,333(6045), 968–970.doi:10.1126/science.1204537
Colquoun, D. (2014). An investigation of the false discovery rate and the misinterpretation of p -values. Royal Society Open Science,1(3).doi:10.1098/rsos.140216
Colquoun, D. (2016).The problem with p-values. Retrieved from https://aeon.co/essays/it-s-time-for-science-to-abandon-the-term-statistically-significant
Department for Education. (2013).Mathematics programmes of study: Key stages 1 and 2. National Curriculum in England. Retrieved from https://assets.publishing.service.gov.uk/government/ uploads/system/uploads/attachment_data/file/335158/PRIMARY_national_curriculum_-_ Mathematics_220714.pdf
Department for Education. (2015).Primary school performance tables: 2015. Retrieved fromhttps:// www.gov.uk/government/statistics/primary-school-performance-tables-2015
Dong, N., & Lipsey, M. W. (2011).Biases in estimating treatment effects due to attrition in randomized controlled trials and cluster randomized controlled trials: A simulation study(2011 SREE Conference Abstract Template). Retrieved fromhttps://pdfs.semanticscholar.org/1759/b351ef5cb9cc4dfaf3a 916860b613d6fb250.pdf?_ga=2.15078837.2038775032.1571433373-2074097860.1571433373 Dowker, A. (2004).What works for children with mathematical difficulties?(Research Report No. RR554).
Nottingham: Department for Education and Skills.
Duncan, G. J., Dowsett, C. J., Claessens, A., Magnuson, K., Huston, A. C., Klebanov, P.,…Japel, C. (2007). School readiness and later achievement.Development Psychology,43(6), 1428–1446.doi:10.1037/ 0012-1649.43.6.1428
Edge Hill University. (2018).Numbers Count. Retrieved fromhttps://everychildcounts.edgehill.ac.uk/ mathematics/numbers-count/
Foster, E. M., & Fang, G. Y. (2004). Alternative methods for handling attrition: An illustration using data from the Fast Track evaluation.Evaluation Review,28(5), 434–464.doi:10.1177/0193841X04264662 Frye, D., Baroody, A. J., Burchinal, M., Carver, S. M., Jordan, N. C., & McDowell, J. (2013).Teaching math to young children: A practice guide (NCEE 2014-4005). Washington, DC: National Center for Education Evaluation and Regional Assistance (NCEE), Institute of Education Sciences, U.S. Department of Education.
Fuchs, L. S., Compton, D. L., Fuchs, D., Paulsen, K., Bryant, J. D., & Hamlett, C. L. (2005). The prevention, identification, and cognitive determinants of math difficulty.Journal of Educational Psychology,
97(3), 493–513.doi:10.1037/0022-0663.97.3.493
Gorard, S. (2018).Education policy: Evidence of equity and effectiveness. Bristol: Policy Press. Gorard, S. (2019). Do we really need confidence intervals in the new statistics?International Journal of
Social Research Methodology,22(3), 281–291.doi:10.1080/13645579.2018.1525064
Gorard, S., See, B. H., & Siddiqui, N. (2017).The trials of evidence-based education: The promises, oppor-tunities and problems of trials in education. Abingdon: Routledge.
Gorard, S., Siddiqui, N., & See, B. H. (2015). An evaluation of the“Switch-on Reading”literacy catch-up programme.British Educational Research Journal,41(4), 596–612.doi:10.1002/berj.3157
Gutman, L. M., & Vorhaus, J. (2012).The impact of pupil behaviour and wellbeing on educational out-comes(Research Report No. DFE-RR253). London: Department for Education.
Haylock, D., & Cockburn, A. (1989).Understanding early years mathematics. London: Sage.
Holmes, W., & Dowker, A. (2013). Catch up numeracy: A targeted intervention for children who are low-attaining in mathematics. Research in Mathematics Education,15(3), 249–265. doi:10.1080/ 14794802.2013.803779
Inns, A., Lake, C., Pellegrini, M., & Slavin, R. (2018, March).Effective programs for struggling readers: A best-evidence synthesis. Paper presented at the annual meeting of the Society for Research on Educational Effectiveness, Washington, DC.
Jerrim, J., & Shure, N. (2016). Achievement of 15-year-olds in England: PISA 2015. National Report. London: Department for Education.
Jordan, N. C., Kaplan, D., & Hanich, L. B. (2002). Achievement growth in children with learning diffi cul-ties in mathematics: Findings of a two-year longitudinal study.Journal of Educational Psychology,
94(3), 586–597.doi:10.1037/0022-0663.94.3.586
Lipsey, M. W., Puzio, K., Yun, C., Hebert, M. A., Steinka-Fry, K., Cole, M. W.,…Busick, M. D. (2012).
Translating the statistical representation of the effects of education interventions into more readily interpretable forms(NCSER 2013-3000). Washington, DC: National Center for Special Education Research, Institute of Education Sciences, U.S. Department of Education.
Little, R. J. A., & Rubin, D. B. (1987).Statistical analysis with missing data. New York, NY: Wiley. Marshall, L., & Swan, P. (2008).Exploring the use of mathematics manipulative materials: Is it what we
think it is? Retrieved from https://ro.ecu.edu.au/cgi/viewcontent.cgi?article=1032&context= ceducom
Miller, R. T., Murnane, R. J., & Willett, J. B. (2008). Do teacher absences impact student achievement? Longitudinal evidence from one urban school district.Educational Evaluation and Policy Analysis,
30(2), 181–200.doi:10.3102/0162373708318019
Morgan, P. L., Farkas, G., Hillemeier, M. M., & Maczuga, S. (2016). Who is at risk for persistent math-ematics difficulties in the United States?Journal of Learning Disabilities,49(3), 305–319. doi:10. 1177/0022219414553849
Morgan, P. L., Farkas, G., & Wu, Q. (2009). Five-year growth trajectories of kindergarten children with learning difficulties in mathematics.Journal of Learning Disabilities,42(4), 306–321.doi:10.1177/ 0022219408331037
Mosher, F. A. (2011).The role of learning progressions in standards-based education reform(CPRE Policy Brief). Philadelphia, PA: Consortium for Policy Research in Education.
Nicholl, J. J. (n.d.). Complier average causal effect analysis. Retrieved fromhttps://www.sheffield.ac. uk/polopoly_fs/1.418711!/file/JNicholls.pdf
Nunes, T., Bryant, P., Strand, S., Hillier, J., Barros, R., & Miller-Friedmann, M. (2017).Review of SES and science learning in formal educational settings. London: Education Endowment Foundation. Organisation for Economic Co-operation and Development. (2016).PISA 2015 results in focus. Paris:
Author.
Pellegrini, M., Inns, A., & Slavin, R. (2018, March).Effective programs in elementary mathematics: A best-evidence synthesis. Paper presented at the annual meeting of the Society for Research on Educational Effectiveness, Washington, DC.
Pharoah, P. D. P., Jones, M. R., & Kar, S. (2017).P-values and confidence intervals: Notfit for purpose?
bioRxiv preprintfirst posted online August 24, 2017.doi:10.1101/180117
Public Health England. (2014).The link between pupil health and wellbeing and attainment: A briefing for head teachers, governors and staffin education settings. London: Author.
Public Health England. (2016).The mental health of children and young people in England. London: Author.
Puma, M. J., Olsen, R. B., Bell, S. H., & Price, C. (2009).What to do when data are missing in group ran-domized controlled trials? (NCEE 2009-0049). Washington, DC: National Center for Education Evaluation and Regional Assistance, Institute of Education Sciences, U.S. Department of Education. Shadish, W. R., Cook, T. D., & Campbell, D. T. (2001).Experimental and quasi-experimental designs for
generalized causal inference. Boston, MA: Houghton Mifflin.
Sharples, J., Webster, R., & Blatchford, P. (2015).Making best use of teaching assistants: Guidance report. London: Education Endowment Foundation.
Slavin, R. (2019, January 31). How tutoring could benefit students who do not need it [Web log post]. Retrieved fromhttps://robertslavinsblog.wordpress.com/2019/01/31/how-tutoring-could-benefi t-students-who-do-not-need-it/
Smith, T. M., Cobb, P., Farran, D. C., Cordray, D. S., & Munter, C. (2013). Evaluating Math Recovery: Assessing the causal impact of a diagnostic tutoring program on student achievement.
American Educational Research Journal,50(2), 397–428.doi:10.3102/0002831212469045
Standards and Testing Agency. (2012).Assessing and reporting arrangements Key Stage 1. London: Department for Education.
Standards and Testing Agency. (2017). Teacher assessment frameworks at the end of Key Stage 1. London: Department for Education.
Torgerson, C. J., Wiggins, A., Torgerson, D. J., Ainsworth, H., Barmby, P., Hewitt, C.,…Tymms, P. (2011).
Every Child Counts: The independent evaluation technical report(Research Report No. DF-RR091a). London: Department for Education.
Wasik, B. A., & Slavin, R. E. (1993). Preventing early reading failure with one-to-one tutoring: A review offive programs.Reading Research Quarterly,28(2), 178–200.doi:10.2307/747888
Weale, S. (2017, September 21). Primary school teachers“not trained to deal with mental health issues”. The Guardian. Retrieved from https://www.theguardian.com/society/2017/sep/21/ primary-school-teachers-not-trained-to-deal-with-mental-health-issues
Webster, R. (2018, June 28). It’s official: School budget cuts have finally caught up with teaching assistants [Web log post]. Retrieved from https://ioelondonblog.wordpress.com/2018/06/28/its-official-school-budget-cuts-have-finally-caught-up-with-teaching-assistants/
Wertz, R.T. (1995). Intention to treat: Once randomized, always analyzed. Clinical Aphasiology,
23, 57–64.
Williams, R. (2008).Independent review of mathematics teaching in early years settings and primary schools: Final report. Nottingham: Department for Children, Schools and Families.
Ye, C., Beyene, J., Browne, G., & Thabane, L. (2018). Estimating treatment effects in randomised con-trolled trials with non-compliance: A simulation study. BMJ,4: e005362. doi:10.1136/bmjopen-2014-005362