Strathprints Institutional Repository
Martin, Anne and Booth, Josephine N. and Young, David and Revie, Matthew and Boyter, Anne C. and Johnston, Blair and Tomporowski, Phillip D. and Reilly, John J. (2015) Associations between obesity and cognition in the pre-school years. Obesity. ISSN 1930-7381 ,
http://dx.doi.org/10.1002/oby.21329
This version is available at http://strathprints.strath.ac.uk/54825/
Strathprints is designed to allow users to access the research output of the University of Strathclyde. Unless otherwise explicitly stated on the manuscript, Copyright © and Moral Rights for the papers on this site are retained by the individual authors and/or other copyright owners. Please check the manuscript for details of any other licences that may have been applied. You may not engage in further distribution of the material for any profitmaking activities or any commercial gain. You may freely distribute both the url (http://strathprints.strath.ac.uk/) and the content of this paper for research or private study, educational, or not-for-profit purposes without prior permission or charge.
Any correspondence concerning this service should be sent to Strathprints administrator:
Associations between obesity and cognition in the pre-school years
Anne Martin, PhD1; Josephine N. Booth, PhD2; David Young, PhD3; Matthew Revie, PhD4; Anne C. Boyter, PhD5; Blair Johnston, PhD5; Phillip D. Tomporowski, PhD6;
John J. Reilly, PhD1
Affiliations:1 Physical Activity for Health Group, School of Psychological Sciences & Health, University of Strathclyde, Glasgow, Scotland,2 School of Psychology, The University of Dundee, Dundee, Scotland, 3 Department of Mathematics and Statistics,
University of Strathclyde, Glasgow, Scotland, 4 Department of Management Science, University of Strathclyde, Glasgow, Scotland, 5 School of Pharmacy, Strathclyde Institute of Pharmacy & Biomedical Sciences, University of Strathclyde, Glasgow, Scotland, 6 Department of Kinesiology, The University of Georgia, Athens, USA
Address Correspondence to: Dr Anne Martin, Physical Activity for Health Research Centre, The University of Edinburgh, Holyrood Road, Edinburgh, EH8 8AQ, UK. Email [email protected]; Phone +44 131 6514127.
Short title: Obesity and cognition
Word count: 3,500
Keywords: Millennium Cohort Study; obesity; cognitive performance; early childhood; pre-school.
Funding Source: This work was funded by the University of Strathclyde ‘Bridging
the Gap’ fund. The funders had no role in study design, data collection and analysis, decision to publish, or preparation of the manuscript.
Financial Disclosure: The authors declare no financial relationships that could be broadly relevant to the work.
What is Known on This Subject
Recent systematic review evidence of sixty-seven studies indicated that childhood obesity is negatively associated with aspects of neurocognitive functioning including executive function, attention, and visuospatial performance.
Recent evidence suggests that obesity is associated with poorer cognitive outcomes and impaired educational attainment in adolescent girls.
The issue of when lower cognition and educational attainment related to obesity develop during childhood and adolescence is unclear.
What This Study Adds
Reduced obesity-associated performance in some cognitive abilities emerges in the pre-school years.
Lower performance in some cognitive abilities associated with obesity was not substantial in the pre-school years and might gain practical significance later in childhood or adolescence.
Abstract
Objective To test the hypothesis that obesity is associated with impaired cognitive outcomes in the pre-school years.
Methods Associations were examined between weight status at age 3-5 years and cognitive performance at age 5 years. Cognitive outcome measures were tests of Pattern Construction (visuo-spatial skills), Naming Vocabulary (expressive language skills), and Picture Similarity (reasoning skills). The sample was the UK Millennium Cohort Study (MCS; n 12,349 participants).
Results Boys with obesity at 3 years had significantly lower performance in Pattern Construction at age 5 years compared to those of a healthy weight, even after controlling for confounders ( = -0.029, p=0.03). Controlling for confounders, boys who developed obesity between the age of 3 and 5 years had lower scores in Pattern Construction ( =-0.03, p=0.03). ’Growing out’ of obesity had a beneficial impact on Picture Similarity performance in girls ( =0.03, p=0.04).
Conclusions Obesity in the pre-school years was associated with poorer outcomes for some cognitive measures in this study. Stronger relationships between obesity and cognition or educational attainment may emerge later in childhood.
Introduction
Childhood obesity has a variety of adverse consequences, in the short and long-term (1, 2). A systematic review by Caird et al tested the hypothesis that child or adolescent obesity impairs educational attainment (3), but found that the evidence was unclear because most previous studies had serious limitations, notably cross-sectional design, lack of control for socio-economic status (SES), an important confounder, and small sample size. Liang et al (4) recently reviewed the neurocognitive impacts of child and adolescent obesity, and concluded that while obesity related deficits in cognition were likely, there was a lack of empirical evidence, and a need for longitudinal studies to address the issue.
Historically, psychometric intelligence quotient (IQ) tests designed for young children emphasize expressive language ability, visuospatial skills and non-verbal reasoning. Early indicators of IQ are implicated at older ages and important for attainment (5, 6, 7) . Evidence in older children suggests a negative association between obesity and language ability, visuospatial skill and non-verbal reasoning (4). Whether this adverse relationship emerges in early childhood needs to be explored.
In a recent English cohort study, obesity at age 11 years was associated with a marked deficit in subsequent educational attainment (up to age 16 years) in girls, but not boys(8). The impact of obesity on educational attainment might be useful to support arguments for school-based obesity prevention initiatives since educational attainment is so highly valued by families and school systems (8). Furthermore, knowledge of
when obesity-related deficits in attainment emerge, and how large the deficits are at various ages, may also be useful in translating evidence on this topic into policy
aimed at preventing obesity. In the UK, as in the USA and many other parts of Europe, formal education now begins in the pre-school period, at age 3-5 years, and there is increasing emphasis on the importance of the pre-school period for subsequent academic outcomes (9). There is therefore a need to test whether, and to what extent, pediatric obesity is associated with cognitive function and educational attainment in the crucial pre-school years.
In addition to emerging epidemiological evidence that obesity may impair cognition and/or educational attainment (4, 8), a number of plausible biological mechanisms linking obesity to impaired cognitive function have now been identified both in humans and in animal models (10, 11, 12, 13, 14, 15).
The primary aim of the present study was to test the hypothesis that obesity in early childhood is associated independently with impaired cognitive outcomes in a large, longitudinal, UK birth cohort study, the Millennium Cohort Study (MCS;(16)) .
Methods Study cohort
The sample comprised participants from the MCS (17), a nationally representative longitudinal study of 18,819 infants. A random two-stage sample of all infants born between 1 September 2000 and 31 August 2001 (for England and Wales), and between 24 November 2000 and 11 January 2002 (for Scotland and Northern Ireland), alive in the UK at age nine months was drawn from child benefit (a universal benefit paid to mothers) registers. The sample was clustered geographically at electoral ward level and was disproportionately stratified to over-represent areas with high
proportions of ethnic minorities in England, areas of high child poverty, and those living in the three smaller countries of the UK. The interview response rate was initially 82%; at first follow-up 80% (2003/2004) and at second follow-up 79% (2005/2006). Study enrolment is described in more detail elsewhere (16). Ethical approval for the study was obtained from the UK National Health Service Ethical Authority, and informed written consent was provided by all parents/guardians.
In order to account for maternal education and post-pregnancy body mass index (BMI) participants were included in this study where the main interview respondent was the natural (n=12,336, 99.9%) or adoptive (n=12, 0.1%) mother. Children were also excluded when parents reported children were diagnosed with relevant cognitive impairments, i.e. attention deficit hyperactivity disorder (ADHD; n=116, 0.8%) or
autism/Asperger’s syndrome (n=107, 0.8%).
Characteristics of study participants
Objective measurements of height and weight were made in 12,349 participants at age 3 years: 76.5% with healthy weight (4,783 male; 4,665 female); 18.0% with overweight (1,080 male; 1,183 female); 5.5% with obesity (332 male; 351 female). Measurements of weight status at age 3 and 5 years old were available for 12,292 boys and girls. Between age 3 and 5 years 91.0% (5,634 male, 5,549 female) of the children were never with obesity, 3.1% (202 male, 178 female) ‘grew out’ of obesity, 3.5% (206 male, 220 female) developed obesity, and 2.5% (130 male, 173 female) were persistently with obesity. Following the application of exclusion criteria, data for 12,262 (Picture Similarity), 12,281 (Naming Vocabulary), and 12,243 (Pattern Construction) participants remained for analyses. Table 1 provides characteristics of
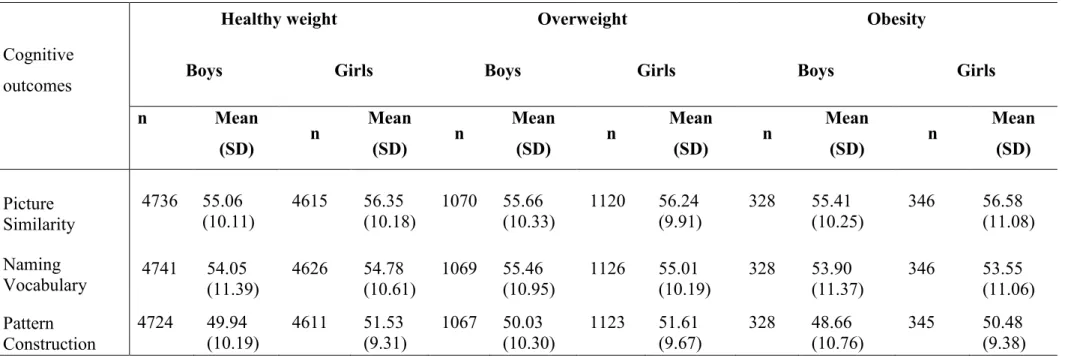
study participants and Table 2 shows mean T-scores for each cognitive test by weight status at 3 years old.
When comparisons of characteristics were made between those who participated at age 3 years and those who did not, small differences were found in income, maternal education, maternal age at child birth, and birth weight.
Predictor variables, outcomes and confounders Weight status predictor variables
Children’s weight (measured without shoes or outdoor clothes) and height was measured according to MCS standard protocols. Weight status was defined on the basis of the body mass index (BMI) for age relative to age and gender-specific UK 1990 population reference data (18). Healthy weight was defined as BMI percentile
≤84.9th, overweight as BMI percentile 85.0th-94.9th, and obesity as BMI percentile
>95.0th.
Cognitive outcome variables
Three academically relevant cognitive outcome measures from the MCS cohort aged 5 years were obtained using the British Ability Scales (BAS) II and so these were used for the present analyses. For detailed information on how and by whom children were assessed the reader is referred to the MCS User Guide (19). The outcome measures were Naming Vocabulary, Picture Similarity and Pattern Construction. Normative scores were used for the analysis (T-scores with a mean of 50 and standard deviation of 10) (20). BAS II showed construct validity as measure of cognitive ability and high test-retest reliability for the three tests administered to children aged 5
years (21): r=0.80 (Naming Vocabulary), r=0.63 (Picture Similarity), r=0.73 (Pattern Construction). The Picture Similarity test measured non-verbal reasoning ability: the child was shown a row of four pictures, given a corresponding card and asked to place the card under the picture which shares an element or concepts with the image on the card (22). Naming Vocabulary assessed children’s expressive language ability where they recalled words from long-term memory: test items consisted of a booklet of coloured pictures of objects which the child is shown one at a time and asked to name it; successful performance depends on the child’s previous development of a vocabulary of nouns (22). Pattern Construction is a non-verbal test of visuo-spatial skills: the child was asked to construct a design by putting together flat squares or solid cubes with black and yellow patterns on each side; the score is based on accuracy and speed (22).
Statistical analyses
The associations between weight status (children with healthy weight, overweight or obesity) and cognitive abilities were assessed using univariate and multivariate linear regression analyses with weight status as predictor variable with healthy weight as the reference group. As males and females have been found to differ in relation to cognitive ability and educational attainment (23), and research suggests that the relationship between obesity and educational attainment may be sex-specific, at least in adolescence(5), the interaction between sex and weight status was tested formally. There was evidence for interaction effects, therefore analyses were conducted separately for males and females. No interaction effect was detected between ethnicity and weight status.
Potential confounders were included in the analyses due to their possible relationship with the exposure and outcome measures: age; birth weight; maternal smoking during pregnancy (yes/no); maternal-reported child’s general health (excellent, very good, good, fair, poor); ethnicity; socio-economic status based on maternal education (no education to education at University degree level), annual household income and number of children in household; language spoken at home (English only to other language only); vocabulary ability at age 3 years measured using the BAS II Naming Vocabulary test; how often parents read to child (daily, 1-2 times/week, several
times/week, less often, not at all); child’s behaviour reported by the mother using the
Strengths and Difficulties Questionnaire (24); and whether the child attended primary school (elementary school). With the necessary exceptions of birth weight, maternal smoking during pregnancy, and vocabulary ability at age 3 years, analyses included confounding variables measured at the follow-up time point of age 5 years. Given that expressive language ability performance measured by the Naming Vocabulary test depends on child’s previous development of a vocabulary of nouns we added vocabulary ability at age 3 years as confounder to account for baseline cognitive ability when assessing the association between weight status and cognition at the age of 5 years. Each variable was considered univariately as a predictor of cognition. Those which were found to be significant univariately were then considered in a multivariate analysis.
Five models were used to explore the impact of confounding variables: Model 1 was unadjusted for any confounding variables, Model 2 adjusted for demographic and socio-economic variables (age, ethnicity, maternal education, number of children in
household and family income), Model 3 extended Model 2 by including child’s birth weight and maternal smoking during pregnancy. Model 4 extended Model 3 by
adding child’s general health and Strengths and Difficulties Questionnaire scores. Model 5 included child developmental variables such as how often parents read to the child, whether the child attended primary school and language spoken at home. To the fully adjusted model, vocabulary abilities at age 3 years were added. Confounders not significant in the models were removed.
To investigate whether change in weight status between 3 years old and 5 years old had an impact on cognitive performance at age 5 years, weight change status (never with obesity; ’grew out’ of obesity; developed obesity from healthy weight or overweight; persistently with obesity) was entered as the predictor variable with never with obesity as the reference group in regression analyses.
SPSS version 21 was employed for all analyses with list wise deletion for regression models. All models were weighted for sampling design and non-response. Combined sample design and non-response weights were available at the MCS dataset. Standard sequential weighting procedures were used to estimate non-response weights after multiple imputation of missing data was performed (19). Significance was considered at the 5% level.
Results
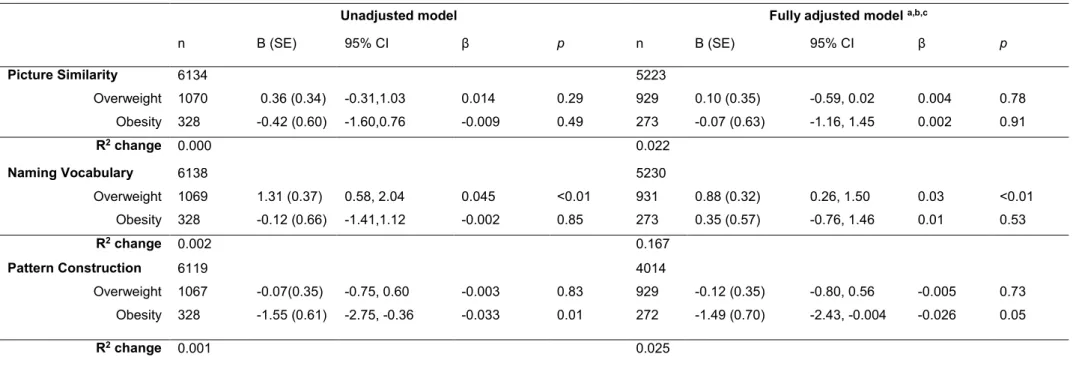
Unstandardized and standardized coefficients for the unadjusted and fully adjusted models can be found in Table 3 for boys and Table 4 for girls (results for each step of adjustment available from the corresponding author).
In boys, based on the unadjusted model, there was evidence of a significantly negative association between obesity at age 3 years and Pattern Construction ability at age 5 years: boys with obesity had significantly lower performance in Pattern Construction (visuo-spatial skill) compared to those with a healthy weight ( = -0.033, p = 0.01). Adjustment for the full range of confounding variables showed that obesity at age 3 years continued to predict decreased Pattern Construction performance with only small attenuation of the coefficient ( = -0.030, p = 0.03, adjusted R2 = 9.7%) and widening of the 95% confidence interval. Associations between obesity and performance in Picture Similarity (reasoning) and Naming Vocabulary were non-significant in the unadjusted and fully adjusted model.
For 3 year old girls with obesity, the beta coefficients revealed lower performance scores in Naming Vocabulary ( = -0.03, p = 0.02) and Pattern Construction ( = -0.03, p = 0.01) at the age of 5 years compared to girls with healthy weight. Findings for Pattern Construction remained significant after adjustment for a wide range of confounders; however when cognitive ability at age 3 years was entered into the model the association became non-significant at the 5% level. There was no group difference for Naming Vocabulary performance after adjustment for SES, ethnicity and age (model 2). There was also no significant association between obesity and performance in Picture Similarity.
Associations of change in weight status between 3 and 5 years old and cognitive outcomes aged 5 years
Results of unadjusted and fully adjusted models for the association between change in weight status between age 3 and 5 years and cognitive ability in boys and girls are shown in Table 5.
Boys who developed obesity between 3 and 5 years had lower Naming Vocabulary
scores ( = -0.03, p = 0.04) and Pattern Construction scores ( = -0.03, p = 0.02) at age 5 years compared to boys who were never with obesity. Similarly, boys - with persistent obesity between age 3 and 5 obtained lower Pattern Construction scores ( = -0.03, p = 0.03) compared to boys who were never with obesity. After adjustment for a full range of confounders the group difference remained evident for boys who developed obesity compared to boys who were never with obesity ( = -0.03, p = 0.03, adjusted R2 = 9.7%). The negative association between persistent obesity and
Pattern Construction scores and developing obesity and Naming Vocabulary scores became non-significant after adjustment for socio-economic confounders. There was
no evidence of a significant group difference for boy’s Picture Similarity
performance.
For girls, the unadjusted model suggested a non-significant association between
‘growing out’ of obesity and Picture Similarity performance ( = 0.02, p = 0.06). However, this association became statistically significant after adjustment for confounders indicating that ’growing out’ of obesity predicted better performance in Picture Similarity compared to girls who were never with obesity ( = 0.03, p = 0.03, adjusted R2 = 6.6%). The unadjusted model indicated for both performance in
obesity (NV: = -0.03, p = 0.04; PC: = -0.03, p = 0.03) or remained with obesity (NV: = -0.03, p = 0.03; PC: = -0.03 , p = 0.04) between age 3 and 5 years obtained lower scores than girls who were never with obesity. These associations became non-significant after adjustment for SES, age and ethnicity (model 2).
Discussion
Main findings and study implications
The present study found that obesity at age 3 years was associated with some adverse cognitive outcomes at age 5 years. The adverse association between obesity at age 3 and visuospatial skills (Pattern Construction test) at age 5 in boys with obesity was robust to confounding variables, but only 9.7% of the variation in the pattern construction test was explained by obesity at age 3 years: the biological/educational significance of an association of this magnitude is unclear. In girls, there were no significant associations between weight status and all three cognitive outcomes when fully adjusted for all confounders. Better performance in visuo-spatial tasks in boys than girls has been reported previously, suggesting sex-specific learning strategies (21). ’Growing out’ of obesity was associated with better reasoning skills (Picture Similarity test) in girls, but the variability in reasoning skills explained by ’growing
out’ of obesity in the present study was only 6.6%. Gender differences in associations between obesity and cognition or academic attainment have been reported previously (8, 25, 26). The evidence of differences between the sexes in the present study was not entirely unexpected, though these gender differences are not fully understood at present.
The cognitive outcomes used in the present study are important tests of ability and are related to subsequent educational attainment (20, 22).. Given the apparently large influence of obesity on educational attainment in adolescence, at least in girls (8) it is possible that stronger associations between obesity and assessed cognitive abilities and impaired educational attainment may emerge later in childhood or in adolescence (8). It is also possible that weight status is negatively associated with other important measures of cognitive ability which were not made in the UK MCS, such as attention, impulsivity, and inhibition control at pre-school age (27).
Context and comparisons with other studies
The recent systematic review by Liang et al (4) noted the limited evidence on the cognitive effects of obesity, and the dearth of evidence on this topic from early childhood. Veldwijk et al (28) found no associations between childhood obesity at age 4 years and cognitive ability at age 7 years in a Dutch cohort, but different cognitive constructs were tested (mental processing), the sample size was small (n=236), and power may have been limited. Heinonen et al (29), in a cohort of 1,056 Finnish children, found some evidence that a higher weight gain trajectory up to age 4 years might be associated with lower ability in some cognitive domains at age 5 years. The absence of associations between obesity and some cognitive outcomes in the present study may reflect the specificity of obesity effects on brain development, structure, or function. For example, effects of obesity on visuo-spatial skills are better established than other cognitive effects (27). In addition, it is possible that associations might not be observed at certain ages/stages of development, or because the cognitive tests used in the present study did not adequately map onto the cognitive processes affected by obesity.
Associations between changes in weight status in early childhood and educational attainment appear to have been assessed by only two previous cohort studies (25, 26).
Datar and Sturm’s study (n~7000) suggested that girls who developed obesity between kindergarten and elementary school grade 3 scored significantly lower in Mathematics and Reading compared to those who were never with obesity (30). This association was non-significant for boys though. Carter et al (31) did not find an association between developing obesity and lower Mathematics scores. However, Carter et al also included children who ‘grew out’ of obesity between the ages 2-5 years and 8-11 years (n =2,582). Findings indicated that children who ‘grew out’ of obesity obtained higher Mathematics scores compared to those who were never with obesity (31).
Study strengths and limitations
The present study had a number of important strengths namely: novelty; large sample size; longitudinal design; ability to adjust for a wide range of confounders; objective measures of exposure and outcome variables; independent measures of cognitive outcomes; ability to consider changes in weight status over time.
This study also had a number of limitations. We had measures of some but not all cognitive outcomes as well as confounding or mediating variables. For example, objectively measured physical activity levels are important to account for when assessing the impact of obesity on cognitive ability given that childhood obesity is associated with low level of physical activity (32) and the probable beneficial impact of physical activity on cognitive abilities and educational attainment (33, 34). The loss
of data when adjusting for confounders could be considered a limitation; however results were weighted for participants who did not respond at follow-up. Nevertheless, reduction of sample size in the comparison groups potentially reduced the statistical power to detect an impact of obesity on cognitive outcomes. Age and gender specific BMI cut-offs were used as measures of overweight and obesity; however BMI is an acceptable but imperfect measure of obesity. The use of change in age and gender-specific BMI z-scores between 3 and 5 years as continuous predictor variable was considered given its advantages over categorical weight status. However, the MCS data set included BMI and categorical weight data (i.e healthy weight, overweight, obesity) only. The present study was observational, and intervention studies would provide stronger evidence of the impact of obesity on cognitive outcomes.
Adverse effects of obesity on educational attainment-related cognitive abilities are plausible given the fact that plausible mechanisms have been identified (10, 12, 13, 14, 15), but also that poorer performance in some cognitive tests are associated with susceptibility to obesity (4). For example, when compared to healthy weight children, children with obesity show higher impulsivity and lower self-regulation, attention and mental flexibility (35, 36, 37). Hence the association between childhood obesity and cognitive abilities might be reciprocal. Intervention studies might provide useful evidence on effects of obesity on cognitive and educational outcomes, but most interventions which aim to improve weight status in children and adolescents with obesity often report small-modest effects (38, 39), and in any event, a recent Cochrane review found a dearth of obesity intervention studies with cognitive or educational outcome measures (40).
Conclusions
This study suggests that obesity in early childhood may be weakly associated with some poorer cognitive outcomes in the pre-school to early school years. Since stronger relationships between obesity and educational attainment have been described in English adolescents (8), it is possible that any adverse impact of obesity on cognition or educational attainment may emerge later in childhood, or in adolescence.
Acknowledgements
We are grateful to The Centre for Longitudinal Studies, Institute of Education for the use of these data and to the UK Data Archive and Economic and Social Data Service for making them available. However, they bear no responsibility for the analysis or interpretation of these data.
References
1. Reilly JJ, Kelly J. Long-term impact of overweight and obesity in childhood and adolescence on morbidity and premature mortality in adulthood:
systematic review. International journal of obesity 2011;35: 891-898.
2. Reilly JJ, Methven E, McDowell ZC, Hacking B, Alexander D, Stewart L, et al. Health consequences of obesity. Archives of Disease in Childhood
3. Caird J, Kavanagh J, Oliver K, Oliver S, O'Mara A, Stansfield C, et al. Childhood obesity and educational attainment: a systematic review. EPPI-Centre, Social Science Research Unit, Institute of Education, University of London, 2011.
4. Liang J, Matheson BE, Kaye WH, Boutelle KN. Neurocognitive correlates of obesity and obesity-related behaviors in children and adolescents.
International journal of obesity 2014;38: 494-506.
5. Deary IJ, Strand S, Smith P, Fernandes C. Intelligence and educational achievement. Intelligence 2007;35: 13-21.
6. Spinath B, Spinath FM, Harlaar N, Plomin R. Predicting school achievement from general cognitive ability,self-perceived ability, and intrinsic value.
Intelligence 2006;34: 363-374.
7. Gustafsson J-E, Undheim JO. Individual differences in cognitive function In: Berliner D, Calfee R (eds). Handbook of educational psychology. Prentice Hall International: New York, 1996, pp 186-242.
8. Booth JN, Tomporowski PD, Boyle JM, Ness AR, Joinson C, Leary SD, et al.
Obesity impairs academic attainment in adolescence: findings from ALSPAC, a UK cohort. International journal of obesity 2014;38: 1335-1342.
9. Feinstein L, Duckworth K. Development in the early years: Its importance for school performance and adult outcomes [Wider Benefits of Learning Research Report No. 20]. Centre for Research on the Wider Benefits of Learning, Institute of Education, University of London, 2006.
10. Erion JR, Wosiski-Kuhn M, Dey A, Hao S, Davis CL, Pollock NK, et al.
Obesity elicits interleukin 1-mediated deficits in hippocampal synaptic plasticity. The Journal of neuroscience : the official journal of the Society for Neuroscience 2014;34: 2618-2631.
11. Khan NA, Raine LB, Donovan SM, Hillman CH. IV. The cognitive
implications of obesity and nutrition in childhood. Monographs of the Society for Research in Child Development 2014;79: 51-71.
12. Skledar M, Nikolac M, Dodig-Curkovic K, Curkovic M, Borovecki F, Pivac N. Association between brain-derived neurotrophic factor Val66Met and obesity in children and adolescents. Progress in Neuro-Psychopharmacology and Biological Psychiatry 2012;36: 136-140.
13. Yau PL, Castro MG, Tagani A, Tsui WH, Convit A. Obesity and metabolic syndrome and functional and structural brain impairments in adolescence.
14. Yokum S, Ng J, Stice E. Relation of regional gray and white matter volumes to current BMI and future increases in BMI: a prospective MRI study.
International journal of obesity 2012;36: 656-664.
15. Zhao J, Bradfield JP, Li M, Wang K, Zhang H, Kim CE, et al. The Role of Obesity-associated Loci Identified in Genome-wide Association Studies in the Determination of Pediatric BMI. Obesity 2009;17: 2254-2257.
16. Plewis I. The Millennium Cohort Study: Technical Report on Sampling. Centre for Longitudinal Studies: London, 2007.
17. University of London, Institute of Education, Centre for Longitudinal Studies. Millennium Cohort Study: First Survey, 2001-2003. UK Data Archive
Colchester, Essex, 2007.
18. Cole TJ, Freeman JV, Preece MA. Body mass index reference curves for the UK, 1990. Archives of disease in childhood 1995;73: 25-29.
19. Johnson J, Joshi H, Calderwood L, Jones E, McDonald J, Platt L, et al.
Millennium Cohort Study: First, Second, Third and Fourth Surveys, A Guide to the Datasets (Seventh Edition). In: Hansen K (ed). Centre for Longitudinal Studies: London, 2012.
20. Elliott C. British Ability Scale Second Edition (BAS II) Adminitration and Scoring Manual, 2nd edn. The NFER-NELSON Publishing Company Ltd.: Windsor, 1996.
21. Connelly R. Millennium Cohort Study Data Note 2013/1: Interpreting Test Scores. Centre for Longitudinal Studies, Institute of Education:
http://www.cls.ioe.ac.uk/Publications.aspx?sitesectionid=85&sitesectiontitle=
Data+notes, 2013.
22. Elliott C, Smith P, McCulloch K. British Ability Scales Second Edition (BAS II): Technical Manual, 2nd edn. The NFER-NELSON Publishing Company Ltd: Windsor, UK, 1997.
23. Strand S, Deary IJ, Smith P. Sex differences in cognitive abilities test scores: a UK national picture. The British journal of educational psychology 2006;76:
463-480.
24. Goodman R. The Strengths and Difficulties Questionnaire: a research note.
Journal of child psychology and psychiatry 1997;38: 581-586.
25. Mond JM, Stich H, Hay PJ, Kraemer A, Baune BT. Associations between obesity and developmental functioning in pre-school children: a population-based study. International journal of obesity 2007;31: 1068-1073.
26. Azurmendi A, Braza F, Sorozabal A, Garcia A, Braza P, Carreras MR, et al.
Cognitive abilities, androgen levels, and body mass index in 5-year-old children. Hormones and behavior 2005;48: 187-195.
27. Smith E, Hay P, Campbell L, Trollor JN. A review of the association between obesity and cognitive function across the lifespan: implications for novel approaches to prevention and treatment. Obesity reviews : an official journal of the International Association for the Study of Obesity 2011;12: 740-755.
28. Veldwijk J, Scholtens S, Hornstra G, Bemelmans WJ. Body mass index and cognitive ability of young children. Obesity facts 2011;4: 264-269.
29. Heinonen K, Raikkonen K, Pesonen AK, Kajantie E, Andersson S, Eriksson JG, et al. Prenatal and postnatal growth and cognitive abilities at 56 months of age: a longitudinal study of infants born at term. Pediatrics 2008;121: e1325-1333.
30. Datar A, Sturm R. Childhood overweight and elementary school outcomes.
International journal of obesity 2006;30: 1449-1460.
31. Carter MA, Dubois L, Ramsay T. Examining the relationship between obesity and math performance among Canadian school children: A prospective analysis. International Journal of Pediatric Obesity 2010;5: 412-419.
32. Rauner A, Mess F, Woll A. The relationship between physical activity, physical fitness and overweight in adolescents: a systematic review of studies published in or after 2000. BMC Pediatr 2013;13: 19.
33. Davis CL, Tomporowski PD, McDowell JE, Austin BP, Miller PH, Yanasak NE, et al. Exercise improves executive function and achievement and alters brain activation in overweight children: A randomized, controlled trial. Health Psychology 2011;30: 91-98.
34. Fedewa AL, Ahn S. The effects of physical activity and physical fitness on children's achievement and cognitive outcomes: a meta-analysis. Research quarterly for exercise and sport 2011;82: 521-535.
35. Delgado-Rico E, Rio-Valle JS, Gonzalez-Jimenez E, Campoy C, Verdejo-Garcia A. BMI predicts emotion-driven impulsivity and cognitive inflexibility in adolescents with excess weight. Obesity 2012;20: 1604-1610.
36. Fields SA, Sabet M, Reynolds B. Dimensions of impulsive behavior in obese, overweight, and healthy-weight adolescents. Appetite 2013;70: 60-66.
37. Nederkoorn C, Braet C, Van Eijs Y, Tanghe A, Jansen A. Why obese children cannot resist food: the role of impulsivity. Eating behaviors 2006;7: 315-322.
38. Danielsson P, Kowalski J, Ekblom O, Marcus C. Response of severely obese children and adolescents to behavioral treatment. Archives of pediatrics & adolescent medicine 2012;166: 1103-1108.
39. Hughes AR, Stewart L, Chapple J, McColl JH, Donaldson MD, Kelnar CJ, et al. Randomized, controlled trial of a best-practice individualized behavioral program for treatment of childhood overweight: Scottish Childhood
Overweight Treatment Trial (SCOTT). Pediatrics 2008;121: e539-546.
40. Martin A, Saunders DH, Shenkin SD, Sproule J. Lifestyle intervention for improving school achievement in overweight or obese children and adolescents. The Cochrane database of systematic reviews 2014;3:
Table 1 Demographic, socio-economic, health and developmental characteristics for the total sample and by weight status at 3 years old
Characteristics Total Sample Healthy Weight Overweight Obesity
n Means (SD) n Means (SD) n Means (SD) n Means (SD)
Age (years) at baseline 12349 3.1 (0.2) 9309 3.1 (0.8) 2187 3.1 (0.8) 671 3.2 (0.9)
Age (years) at follow up 12348 4.8 (0.4) 9447 4.8 (0.4) 2218 4.8 (0.4) 683 4.8 (0.4)
OECD equalised annual household income (British Pounds)
12286 359.3 (220.3) 9401 362.2 (223.1) 2205 357.4 (210.0) 680 325.6 (210.2)
Maternal BMI (kg/m2) 10425 25.1 (5.0) 8007 24.9 (4.8) 1860 26.0 (5.1) 558 27.5 (6.3)
Birth weight (kg) 11864 3.3 (0.6) 9077 3.3 (0.6) 2132 3.5 (0.4) 655 3.5 (0.6)
Strengths and Difficulties score
11974 7.1 (4.7) 9151 7.0 (4.7) 2170 7.0 (4.7) 653 7.7 (5.0)
Naming Vocabulary T-score at 3 years
11851 50.0 (11.2) 9084 49.9 (11.2) 2124 50.7 (11.1) 643 49.2 (11.7)
n Proportion n Proportion n Proportion n Proportion
Gender Boys Girls 6195 6154 50.2% 49.8% 4783 4665 50.6% 49.4% 1080 1138 48.7% 51.3% 332 351 48.6% 51.4% Child’s ethnicity White Mixed Indian Pakistani/Bangladeshi Black/Black British Other 12345 10555 336 297 648 359 150 85.5% 2.7% 2.4% 5.2% 2.9% 1.2% 8019 255 264 521 264 124 94.9% 2.2% 2.8% 5.5% 2.8% 1.3% 1974 60 26 79 59 18 89.1% 2.7% 1.2% 3.6% 2.7% 0.8% 562 21 7 48 36 8 82.4% 3.1% 1.0% 7.0% 5.3% 1.2% Language spoken in household English only Mostly English 12349 10770 607 87.2% 4.9% 8196 492 86.7% 5.2% 1997 83 90.0% 3.7% 577 32 84.5% 4.7%
Half English, half other Mostly other Other language only
489 422 61 4.0% 3.4% 0.5% 381 329 50 4.0% 3.5% 0.5% 70 60 8 3.2% 2.7% 0.4% 38 33 3 5.6% 4.8% 0.4% Number of children in household 1 child 2 children 3 children 4 children 5 or more children 12349 1930 5842 2973 1132 472 15.9% 47.3% 24.1% 9.2% 3.8% 1452 4470 2288 879 359 15.4% 47.3% 24.2% 9.3% 3.8% 357 1082 513 192 74 16.1% 48.8% 23.1% 8.7% 3.3% 121 290 172 61 39 17.7% 42.5% 25.2% 8.9% 5.7% Maternal education University degree Diploma/further education A levels/Scottish Higher O levels/ CSE Other None 11344 1622 1145 859 3556 774 3388 14.3% 10.1% 7.6% 31.3% 6.8% 29.9% 1273 870 673 2714 587 2565 14.7% 10.0% 7.8% 31.8% 6.8% 29.5% 281 211 150 657 137 605 13.8% 10.3% 7.3% 32.2% 6.7% 29.6% 68 64 36 185 50 218 11.0% 10.3% 5.8% 29.8% 8.1% 35.1% Maternal smoking during
pregnancy Yes No 11880 1767 10113 14.9% 85.1% 1301 7786 14.3% 85.7% 337 1800 15.8% 84.2% 129 527 19.7% 80.3% Maternal general health
Excellent Very good Good Fair Poor 13345 2771 4915 3855 1444 360 20.8% 36.8% 28.9% 10.8% 2.7% 1972 3475 2736 997 267 20.9% 36.8% 29.0% 10.6% 2.8% 472 827 619 247 52 21.3% 37.3% 27.9% 11.1% 2.3% 126 253 197 86 20 18.5% 36.1% 28.9% 12.6% 2.9%
Excellent Very good Good Fair Poor 6477 3810 1552 447 63 52.4% 30.9% 12.6% 3.6% 0.5% 4912 2936 1221 334 45 52.0% 31.1% 12.9% 3.5% 0.5% 1225 665 235 82 11 55.2% 30.0% 10.6% 3.7% 0.5% 340 209 96 31 7 49.8% 30.6% 14.1% 4.5% 1.0% In primary school Yes No 12349 12207 142 98.9% 1.1% 9328 120 98.7% 1.3% 2200 18 99.2% 0.8% 679 4 99.4% 0.6% Read to child Every day Several times a week Once or twice a week Once or twice a month Less often Not at all 12349 6388 3516 1764 324 181 176 51.7% 28.5% 14.3% 2.6% 1.5% 1.4% 4902 2682 1335 255 142 132 51.9% 28.4% 14.1% 2.7% 1.5% 1.4% 1128 646 339 51 26 28 50.9% 29.1% 15.3% 2.3% 1.2% 1.3% 358 188 90 18 13 16 52.4% 27.5% 13.2% 2.6% 1.9% 2.3% Playing physically active
games
Every day Several times a week Once or twice a week Once or twice a month Less often Not at all 12347 781 2208 4378 2186 1709 1085 6.3% 17.9% 35.5% 17.7% 13.8% 8.8% 576 1697 3382 1687 1277 827 6.1% 18.0% 35.8% 17.9% 13.5% 8.8% 153 396 781 379 323 186 6.9% 17.9% 35.2% 17.1% 14.6% 8.4% 52 115 215 120 109 72 7.6% 16.8% 31.5% 17.6% 16.0% 10.5%
Table 2 Participants’ cognitive ability T-scores at age 5 years by weight status assessed at 3 years old
Healthy weight Overweight Obesity
Cognitive
outcomes Boys Girls Boys Girls Boys Girls
n Mean (SD) n Mean (SD) n Mean (SD) n Mean (SD) n Mean (SD) n Mean (SD) Picture Similarity 4736 55.06 (10.11) 4615 56.35 (10.18) 1070 55.66 (10.33) 1120 56.24 (9.91) 328 55.41 (10.25) 346 56.58 (11.08) Naming Vocabulary 4741 54.05 (11.39) 4626 54.78 (10.61) 1069 55.46 (10.95) 1126 55.01 (10.19) 328 53.90 (11.37) 346 53.55 (11.06) Pattern Construction 4724 49.94 (10.19) 4611 51.53 (9.31) 1067 50.03 (10.30) 1123 51.61 (9.67) 328 48.66 (10.76) 345 50.48 (9.38)
Table 3. Weight status at age 3 years predicting Picture Similarity, Naming Vocabulary, and Pattern Construction abilities in 5 year old boys
(reference group = healthy weight)
Unadjusted model Fully adjusted model a,b,c
n B (SE) 95% CI p n B (SE) 95% CI p Picture Similarity Overweight Obesity 6134 1070 328 0.36 (0.34) -0.42 (0.60) -0.31,1.03 -1.60,0.76 0.014 -0.009 0.29 0.49 5223 929 273 0.10 (0.35) -0.07 (0.63) -0.59, 0.02 -1.16, 1.45 0.004 0.002 0.78 0.91 R2 change 0.000 0.022 Naming Vocabulary Overweight Obesity 6138 1069 328 1.31 (0.37) -0.12 (0.66) 0.58, 2.04 -1.41,1.12 0.045 -0.002 <0.01 0.85 5230 931 273 0.88 (0.32) 0.35 (0.57) 0.26, 1.50 -0.76, 1.46 0.03 0.01 <0.01 0.53 R2 change 0.002 0.167 Pattern Construction Overweight Obesity 6119 1067 328 -0.07(0.35) -1.55 (0.61) -0.75, 0.60 -2.75, -0.36 -0.003 -0.033 0.83 0.01 4014 929 272 -0.12 (0.35) -1.49 (0.70) -0.80, 0.56 -2.43, -0.004 -0.005 -0.026 0.73 0.05 R2 change 0.001 0.025
a) Picture Similarity: adjusted for age, ethnicity, maternal education, family income, birth weight, child health, SDQ scores, vocabulary skills at age 3, b) Naming Vocabulary: adjusted for age, ethnicity, maternal education, family income, birth weight, maternal smoking, child health, SDQ scores, how often parents read to child, language spoken at home, whether in primary school, vocabulary skills at age 3, c) Pattern Construction: adjusted for age, ethnicity, maternal education, family income, number of children in the household, birth weight, SDQ scores, whether in primary school, vocabulary skills at age 3 years
Table 4. Weight status at age 3 years predicting Picture Similarity, Naming Vocabulary, and Pattern Construction abilities in 5 year old girls
(reference group = healthy weight)
Unadjusted model Fully adjusted model a,b,c
n B (SE) 95% CI p n B (SE) 95% CI p Picture Similarity Overweight Obesity 6081 1120 346 0.12 (0.34) 0.76 (0.56) -0.55,0.78 -1.03,1.18 0.005 0.002 0.72 0.89 5223 957 281 -0.02 (0.35) 0.48 (0.59) -0.71, 0.67 -0.68, 1.64 -.001 .011 0.95 0.42 R2 change 0.000 0.019 Naming Vocabulary Overweight Obesity 6098 1126 346 0.07(0.35) -1.36 (0.52) -0.61,0.76 -2.49,-0.22 0.003 -0.030 0.83 0.02 5329 962 282 0.03 (0.30) 0.20 (0.51) -0.57, 0.62 -0.78, 1.20 0.001 0.005 0.93 0.70 R2 change 0.001 0.164 Pattern Construction Overweight Obesity 6079 1123 345 0.23 (0.32) -1.34 (0.52) -0.39,0.85 -2.37,-0.31 0.010 -0.033 0.46 0.01 5509 815 230 0.28 (0.32) -.952 (0.54) -0.35, 0.92 -2.01, 0.11 .012 -.023 0.38 0.08 R2 change 0.001 0.027
a) Picture Similarity: adjusted for age, ethnicity, maternal education, family income, number of children in the household, birth weight, maternal smoking, child health, SDQ scores, vocabulary skills at age 3; b) Naming Vocabulary: adjusted for age, ethnicity, maternal education, family income, birth weight, maternal smoking, child health, SDQ scores, how often parents read to child, language spoken at home, whether in primary school, vocabulary skills at age 3, c) Pattern construction: adjusted age, ethnicity, maternal education, family income, birth weight, maternal smoking, child health, SDQ scores, vocabulary skills at age
Table 5. Associations of change in weight status between 3 and 5 years old and cognitive outcomes (reference group = never with obesity)
Unadjusted model Fully adjusted model*
Boys Girls Boys Girls
n p n p n p n p
Picture Similarity ’Grew out’ of obesity
Developed obesity Persistent obesity 6144 199 205 129 -0.004 -0.023 -0.013 0.73 0.07 0.32 6082 175 216 171 0.024 -0.023 -0.024 0.06 0.07 0.07 5264 168 166 106 0.003 -0.016 -0.006 0.83 0.25 0.67 5223 142 172 140 0.028 -0.001 -0.011 0.04 0.96 0.41 R2 change 0.001 0.002 0.023 0.019 Naming Vocabulary ’Grew out’ of obesity
Developed obesity Persistent obesity 6147 199 203 129 0.001 -0.027 -0.015 0.92 0.04 0.25 6101 175 217 171 -0.017 -0.027 -0.029 0.19 0.35 0.02 4472 134 134 90 0.002 -0.001 0.008 0.84 0.95 0.57 5240 142 173 141 -0.003 0.007 0.004 0.79 0.53 0.47 R2 change 0.001 0.002 0.167 0.158 Pattern Construction ’Grew out’ of obesity
Developed obesity Persistent obesity 6129 198 203 130 -0.021 -0.031 -0.029 0.11 0.02 0.02 6083 174 215 171 -0.024 -0.029 -0.027 0.07 0.03 0.04 5216 167 164 105 -0.022 -0.029 -0.015 0.09 0.03 0.27 5224 141 171 141 -0.025 -0.001 -0.012 0.06 0.92 0.35 R2 change 0.002 0.002 0.024 0.027
a) Picture Similarity: adjusted for age, ethnicity, maternal education, family income, number of children in the household, maternal smoking during pregnancy, child healthy, SDQ scores, vocabulary skills at age 3years; b) Naming Vocabulary: adjusted for age, ethnicity, maternal education, family income, number of children in household, maternal smoking during pregnancy, child health, SDQ scores, whether started school, how often parents read to child, language spoken at home, vocabulary skills at age 3years; c) Pattern Construction: adjusted for age, ethnicity, maternal education, family income, number of children in the household, birth weight, maternal smoking during pregnancy, child health, SDQ scores, vocabulary skills at age 3years