This is a repository copy of
Language and reading development in children learning
English as an additional language in primary school in England
.
White Rose Research Online URL for this paper:
http://eprints.whiterose.ac.uk/159764/
Version: Published Version
Article:
Dixon, C., Thomson, J. and Fricke, S. orcid.org/0000-0003-2706-121X (2020) Language
and reading development in children learning English as an additional language in primary
school in England. Journal of Research in Reading. ISSN 0141-0423
https://doi.org/10.1111/1467-9817.12305
[email protected] https://eprints.whiterose.ac.uk/ Reuse
This article is distributed under the terms of the Creative Commons Attribution-NonCommercial (CC BY-NC) licence. This licence allows you to remix, tweak, and build upon this work non-commercially, and any new works must also acknowledge the authors and be non-commercial. You don’t have to license any derivative works on the same terms. More information and the full terms of the licence here:
https://creativecommons.org/licenses/
Takedown
If you consider content in White Rose Research Online to be in breach of UK law, please notify us by
Language and reading development in
children learning English as an
additional language in primary school in
England
Chris Dixon
Division of Human Communication Sciences, Health Sciences School, University of Sheffield, Sheffield, UK and School of Psychology, University of Leeds, Leeds, UK
Jenny Thomson
Division of Human Communication Sciences, Health Sciences School, University of Sheffield, Sheffield, UK
Silke Fricke
Division of Human Communication Sciences, Health Sciences School, University of Sheffield, Sheffield, UK
Children learning English as an additional language (EAL) are a growing population of learners in English primary schools. These children begin school with differing levels of English language proficiency and tend to underperform in relation to their non-EAL peers on measures of English oral language and reading. However, little work has examined the developmental trajectories of these skills in EAL learners in England. EAL learners and 33 non-EAL peers in Year 4 (age 8–9 years) were assessed at three time points over 18 months on measures of oral language (vocabu-lary, grammar and listening comprehension), phonological processing (spoonerisms and rapid automatised naming) and reading skills (single-word decoding and passage reading). Att1, EAL learners scored significantly lower than non-EAL peers in re-ceptive and expressive vocabulary (breadth but not depth), spoonerisms and passage reading accuracy. Contrary to previous research, no significant group differences were found in listening or reading comprehension skills. With the exception of pas-sage reading accuracy, there was no evidence for convergence or divergence between the groups in rate of progress over time. After three years of English-medium class-room instruction, EAL learners continue to underperform relative to their non-EAL peers in breadth of English vocabulary knowledge. This discrepancy in vocabulary knowledge does not appear to narrow as a result of regular classroom instruction in the run up to the final stages of primary school, pinpointing vocabulary as a key target for intervention.
Keywords: bilingual, vocabulary, word reading, reading comprehension, phonological processing
This is an open access article under the terms of the Creative Commons Attribution-NonCommercial License, which permits use, distribution and reproduction in any medium, provided the original work is properly cited and is not used for commercial purposes.
© 2020 UKLA
Journal of Research in Reading, ISSN 0141-0423 DOI:10.1111/1467-9817.12305 Volume 00, Issue 00, 2020, pp 1–20
Highlights
What is already known about this topic
• Children learning EAL in England tend to underperform in relation to their
non-EAL peers in vocabulary knowledge, grammar and reading comprehen-sion but not single-word reading or passage reading accuracy.
• Attainment gaps between EAL learners and monolingual peers close gradually
over the course of compulsory education, although reading attainment gaps re-main by age 16.
What this paper adds
• EAL learners exhibit significantly lower levels of English vocabulary breadth
and passage reading accuracy but not vocabulary depth, listening comprehen-sion or reading comprehencomprehen-sion.
• In this study, the magnitude of group differences was reduced relative to
pre-vious work, potentially as a result of socio-economic status and EAL learners’
exposure to English.
• Where EAL learners underperform, there is no evidence that they make a
sig-nificantly faster rate of progress over time than their non-EAL peers. Similar
developmental trajectories may serve to sustain group differences in primary education.
Implications for theory, policy or practice
• Mere exposure to classroom teaching may not be a sufficient means of
ensur-ing the English language proficiency (particularly vocabulary) of EAL
learners, potentially impeding access to more challenging aspects of the Na-tional Curriculum.
• Breath of vocabulary knowledge may represent one particularly pertinent
tar-get for explicit classroom instruction for EAL learners.
In England, children learning English as an additional language (EAL) are school pupils
who are exposed to a first language other than English during early development and
who may continue to use this language in the home or community setting throughout their schooling (DfES 2007). For the past decade, the proportion of EAL learners in primary schools in England has been growing steadily, currently standing at 21.2% (Department
for Education [DfE] 2019). These children are highly diverse in terms of their proficiency
in English at school onset, their exposure to English outside of school, literacy skills in the home language, religious and cultural practices and the number of different languages spoken.
All classroom instruction in state-maintained (government controlled) schools in
En-gland takes place in English, with the expectation that EAL learners will acquire sufficient
English language and reading skills through this instruction alone (Costley 2014). Due to a DIXON, THOMSON & FRICKE
focus on inclusive educational practices, EAL has no concrete status in England’s primary
school National Curriculum, and many newly qualified teachers feel underprepared for the
task of teaching and assessing children whose first language is not English (Flynn &
Curdt-Christensen 2018). Nationally, EAL learners underperform in relation to their non-EAL peers on assessments of reading and writing, with this attainment gap diminishing in magnitude but still present by the end of compulsory education at age 16
(Strand et al. 2015). The lower English language proficiency of many EAL learners at
school entry means that these children will be required to make a faster rate of progress over time in order to avoid attainment gaps, but little work has examined growth in com-ponent skills of language and reading in this population.
Development of language and reading skills in monolingual and bilingual learners
Within the simple view of reading (Gough & Tunmer 1986), reading ability is conceptualised as the product of decoding and linguistic comprehension. Therefore, as well as decoding ability, oral language skills such as vocabulary, grammar and listening
comprehension are strong and significant predictors of reading comprehension
(Cunning-ham & Stanovich 1997; Ouellette 2006).
The relationship between oral language and reading comprehension applies similarly in the case of children acquiring literacy in a second or additional language (August & Shanahan 2008); however, there is some evidence to suggest the stronger predictive power of vocabulary knowledge in the reading comprehension performance of EAL learners (e.g.
Burgoyne et al. 2009; Babayiğit 2014). Regarding language skills, studies in England
re-port trends for lower performance of primary school-age EAL learners relative to their non-EAL peers in receptive and expressive measures of vocabulary and grammar and
lis-tening comprehension (Hutchinson et al. 2003; Burgoyne et al. 2009; Babayiğit 2014).
Some U.K.-based work has examined aspects of vocabulary depth knowledge in EAL learners. For instance, Smith and Murphy (2014) compared EAL/non-EAL group
differ-ences in knowledge of‘multi-word phrases’(e.g.‘break the ice’), while Hessel and
Mur-phy (2019) examined group differences in performance on a metaphor comprehension
task. Both of these studies report trends for lower EAL group performance infigurative
lan-guage comprehension using bespoke measures in which stimuli are presented within story contexts. On the other hand, studies of EAL learners in England have typically not
employed more traditional measures of vocabulary depth such as definition tasks. There
is evidence from the international literature to suggest that vocabulary depth measured in this way may also be a challenging domain for bilingual learners (Lervåg & Aukrust 2010; Karlsen et al. 2017), and such a measure was employed in the present study.
Regarding lower-level reading skills, bilingual learners appear to perform at least simi-larly to and in some cases higher than their monolingual peers in the domains of phonolog-ical awareness, single-word reading and rapid automatised naming (RAN; Geva & Farnia 2012; Melby-Lervåg & Lervåg 2014). These skills have been little researched in EAL learners in England, although some work does provide evidence of parity in phonological awareness and aspects of phonological processing (Frederickson & Frith 1998). Addition-ally, single-word reading has been shown to be a particular strength of EAL learners during
primary school (Burgoyne et al. 2009; Babayiğit 2014).
In terms of higher-level reading skills, reading comprehension has been identified as a
per-sistently challenging domain for EAL learners (Frederickson & Frith 1998; Hutchinson et al. LANGUAGE AND READING DEVELOPMENT IN EAL
2003; Burgoyne et al. 2009; Babayiğit 2014). The reading comprehension difficulties of EAL learners are often observed within the presence of adequate passage reading accuracy. For example, 7- to 8-year-old EAL learners in Burgoyne et al. (2009) were able to progress further on the Neale Assessment of Reading Ability (Neale 1997) than their non-EAL peers due to a higher level of passage reading accuracy, allowing them to attempt more compre-hension questions. When accuracy scores were controlled for, however, EAL learners
exhib-ited significantly lower reading comprehension scores than their non-EAL peers.
Given evidence for early group discrepancies in oral language knowledge and reading
comprehension, it is of interest to what extent EAL learners are able to‘close the gap’over
time and approximate the English language proficiency of their non-EAL peers. Although
bilingual learners are often found to acquire surface-level linguisticfluency within around
two years, a period offive to seven years is required to develop deeper-level linguistic
com-petency (Thomas & Collier 2002; Demie 2013).
Longitudinal studies in England rarely report significantly faster growth of EAL learners
in either English oral language or reading skills. Between the three time points in
Hutch-inson et al. (2003), 6- to 8-year-old EAL learners made significantly faster progress in
lis-tening comprehension, with group discrepancies widening over time in receptive vocabulary and receptive grammar. In a similar fashion, Burgoyne et al. (2011) found a widening of the gap between the two groups not only in receptive vocabulary but also in reading comprehension between the ages of 7 to 8. In both studies, however, EAL learners maintained an advantage in passage reading rate and accuracy over time and began to close the gap to a small degree in expressive vocabulary.
Current study
The present longitudinal investigation aimed to compare the language and reading develop-ment of a small sample of EAL and non-EAL learners. Research questions were as follows: 1. What are the similarities and differences in the language and reading skills of children
learning EAL and their non-EAL peers at the beginning of Year 4?
2. What are the developmental trajectories of the two groups of children in language and reading skills between Year 4 and Year 5?
Method
A longitudinal cohort design was employed consisting of repeated measurements at three
intervals over a period of 18 months: the beginning of Year 4 (t1; age 8–9), the end of Year
4 (t2; age 9–10) and the middle of Year 5 (t3; age 9–10). The study was conducted in a
large city in South Yorkshire, England, in collaboration with the city council that identified
schools likely to be interested in the research and with a mixed enrolment of EAL and non-EAL pupils. At the time of recruitment, 22.1% of primary school pupils in the study
area were classified as learning EAL, closely resembling the national average of 19.4%
(DfE 2015). Eight state-maintained primary schools gave consent to participate in the study. Across the eight schools, the proportion of EAL learners ranged from 10.5% to 91.6%, and every school ranked above the national average in terms of proportion of pupils eligible for Free School Meals, one indicator of socio-economic deprivation (mean 36%, national average 16.5%; DfE 2015).
Participants
Att1, a total of 48 children learning EAL (22 male; mean age 8;8,SD= 3.3 months) and 33
non-EAL peers (14 male; mean age 8;8,SD= 3.4 months) were recruited onto the study.
The two groups did not differ significantly in age,t(79) = .49,p= .630,r= .043, or
gen-der distribution, χ2(1) = .092, p = .760. EAL status was gathered through bespoke
parent-administered and child-administered questionnaires, as well as school records. In all cases, school binary EAL status agreed with the results of child questionnaires
(n= 48) and parent questionnaires (n= 36 returned). Participation criteria were as follows:
(1) no statement of Special Educational Needs or receipt of intervention from a speech and
language therapist (this decision was taken as a result of the study’s focus on typical
devel-opment); (2) for children with EAL, receipt of English-medium education since at least
Year 1 (age 5–6) in order to account for a potentially confounding effect of unequal
amounts of English-medium instruction. Where possible, EAL and non-EAL children were recruited from the same classrooms. Children in the EAL group spoke a total of 15 differ-ent languages. Of the 36 returned questionnaires from pardiffer-ents of EAL learners, 33 stated that their child had been born in the United Kingdom, and only four stated that English was not spoken at all in the home. According to parents, frequency of English use in the home was as follows: Never (3%); Rarely (6%); Sometimes (27%); Most of the time (49%); Always (15%). When asked about languages spoken most often at home, 62% of children indicated English, 36% the home language, and 2% both. Parents indicated that
their children were more likely to use English frequently (‘mostly’or‘all the time’) with
siblings (88%) and friends (63%) than with the mother (57%) or father (50%). A
sub-sample of EAL learners (n= 12) also took part in a vocabulary teaching intervention
that coincided witht2of the longitudinal study. As target vocabulary from the intervention
did not overlap with any stimuli from standardised assessments, these children continued to
participate in all time points of the longitudinal study.1
Materials and procedure
All testing took place in a one-to-one format in a quiet area of participating schools. At each time point, measures were administered in the same order in two sessions (max. 45 mi-nutes each). The same assessments were administered at all three time points aside from
the measure of nonverbal reasoning, which was given att1only.
Oral language
Receptive vocabulary.The British Picture Vocabulary Scale-III (Dunn, Dunn,, & NFER 2009) is a measure of receptive vocabulary breadth in which examinees match spoken words with one of four pictorial representations.
Expressive vocabulary.The Expressive Vocabulary subtest of the Clinical Evaluation of
Language Fundamentals-IV (CELF-IV; Semel et al. 2006) measures an examinee’s ability
to name illustrations depicting objects, people and actions.
Vocabulary depth.The Vocabulary subtest of Wechsler Intelligence Scale for Children-IV (WISC-IV; Wechsler 2003) is a measure of depth of word knowledge. The subtest consists LANGUAGE AND READING DEVELOPMENT IN EAL
of 36 nouns, verbs and adjectives, for which examinees are required to provide a verbal
definition each scored on a scale from 0 to 2.
Listening comprehension.In the understanding spoken paragraphs subtest of the CELF-IV, examinees listen to three aurally presented passages and answer questions tapping literal and inferential comprehension. All passages were prerecorded by the researcher at an even reading rate and played back using an Olympus digital voice recorder. Scaled scores were utilised given that children listened to different passages depending on their age.
Expressive grammar.In the formulated sentences subtest of the CELF-IV, examinees are required to formulate syntactically and semantically appropriate sentences about pictures using target stimulus words or phrases.
Phonological processing
Phonological awareness.The spoonerisms subtest of the Phonological Assessment Battery (Frederickson et al. 1997) measures the ability to substitute individual phonemes and syl-lables in real and pseudowords. Part 1 requires substitution of individual phonemes in
words, for example,fun with a bgives bun, while part 2 requires substitution between
two words, for example,fed mangivesmed fan.
Rapid automatised naming.The RAN subtests of the Comprehensive Test of Phonological Processing (Wagner et al. 1999a) assess speed of letter naming and digit naming. Exam-inees are asked to read stimuli aloud from left to right, as quickly as possible. Scores for each subtest are calculated by summing the time taken in seconds to name all stimuli.
Reading
Single-word reading.The Test of Word Reading Efficiency-II (Wagner et al. 1999b) is a timed assessment in which examinees are asked to read aloud as many real words
(sight-word efficiency) and nonwords (phonemic decoding efficiency) as they can within
45 seconds.
Passage reading.The York Assessment of Reading for Comprehension-Primary (YARC-P; Snowling et al. 2011) is an individually administered reading comprehension assess-ment. Examinees read passages out loud and are asked questions tapping both literal and inferential comprehension. The YARC derives age-standardised scores based on the two highest consecutively completed passages. The use of raw scores for the YARC was con-sidered inappropriate due to the fact that different children read different subsets of pas-sages according to their ability. Therefore, age-standardised scores were utilised for passage reading rate (time taken in seconds), accuracy (number of errors) and comprehen-sion (number of questions answered correctly).
Cognition
Measures of nonverbal reasoning and memory were included in the battery to ensure fair comparison between the two groups of children and to help rule out differences in perfor-mance on language and reading measures due to other cognitive factors.
Nonverbal reasoning.The matrix reasoning subtest of the WISC-IV is a measure of per-ceptual reasoning and general intellectual nonverbal ability. Examinees are presented with
increasingly difficult, partially complete sequences of coloured geometric shapes and are
asked to select the appropriate pattern from a choice offive to complete the sequence.
Memory. The number repetition subtest of the CELF-IV was employed as a measure of memory. Examinees are required to recall and recite random digit sequences of increasing length forwards (numbers forwards; a measure of short-term memory) and backwards (numbers backwards; a measure of working memory).
Analytical strategy
Linear mixed modelling (LMM) was employed in the analysis of developmental
trajecto-ries. The inclusion of random as well asfixed effects allows for the estimation of an
indi-vidual intercept and slope for each subject, thus minimising unexplained variance and accounting for within-subject correlation among residuals (West et al. 2007). In the present
study, fixed effects included group (EAL or non-EAL), time (t1, t2 and t3), and
time×groupinteraction; random effects included subject intercept and slope fortime. Ran-dom slopes for school were not appropriate given imbalance of EAL and non-EAL chil-dren in different schools. In each of a series of 13 models, the dependent variable was a language or reading measure of interest (Tables 2 and 3).
A step-up model building strategy was employed, beginning with a random intercept for
timeand nofixed effects (unconditional growth model). Next, a random slope was added to
this model but only retained in the event of significantly improved modelfit (assessed with
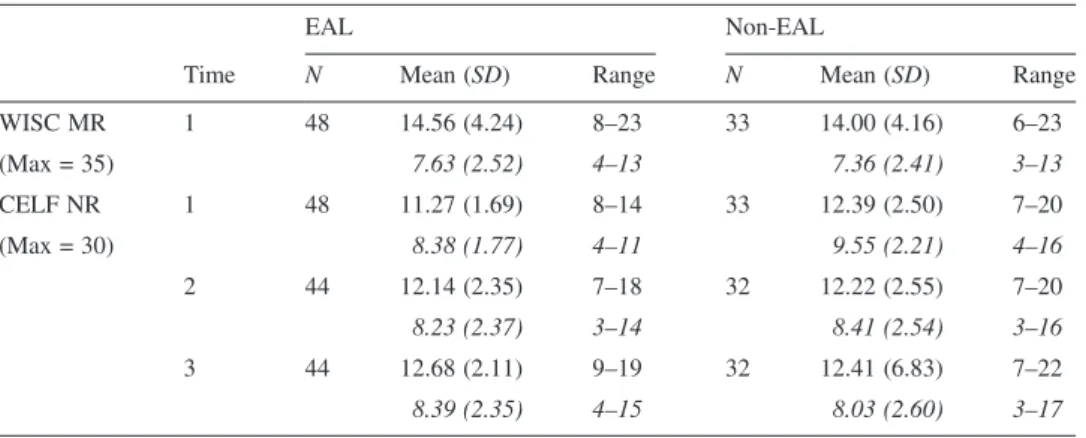
Table 1.Descriptive statistics for background cognitive variables.
Time
EAL Non-EAL
N Mean (SD) Range N Mean (SD) Range WISC MR 1 48 14.56 (4.24) 8–23 33 14.00 (4.16) 6–23 (Max = 35) 7.63 (2.52) 4–13 7.36 (2.41) 3–13 CELF NR 1 48 11.27 (1.69) 8–14 33 12.39 (2.50) 7–20 (Max = 30) 8.38 (1.77) 4–11 9.55 (2.21) 4–16 2 44 12.14 (2.35) 7–18 32 12.22 (2.55) 7–20 8.23 (2.37) 3–14 8.41 (2.54) 3–16 3 44 12.68 (2.11) 9–19 32 12.41 (6.83) 7–22 8.39 (2.35) 4–15 8.03 (2.60) 3–17 Note: WISC MR = Wechsler Intelligence Scale for Children-IV Matrix Reasoning; CELF NR = Clinical Evalu-ation of Language Fundamentals-IV Number Repetition.
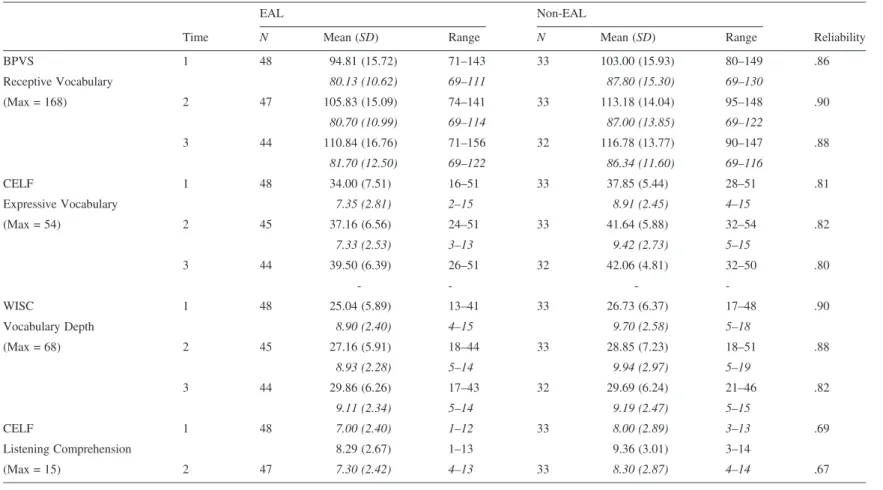
Table 2.Descriptive statistics for oral language and phonological processing variables for both groups at all three time points.
Time
EAL Non-EAL
Reliability
N Mean (SD) Range N Mean (SD) Range
BPVS 1 48 94.81 (15.72) 71–143 33 103.00 (15.93) 80–149 .86 Receptive Vocabulary 80.13 (10.62) 69–111 87.80 (15.30) 69–130 (Max = 168) 2 47 105.83 (15.09) 74–141 33 113.18 (14.04) 95–148 .90 80.70 (10.99) 69–114 87.00 (13.85) 69–122 3 44 110.84 (16.76) 71–156 32 116.78 (13.77) 90–147 .88 81.70 (12.50) 69–122 86.34 (11.60) 69–116 CELF 1 48 34.00 (7.51) 16–51 33 37.85 (5.44) 28–51 .81 Expressive Vocabulary 7.35 (2.81) 2–15 8.91 (2.45) 4–15 (Max = 54) 2 45 37.16 (6.56) 24–51 33 41.64 (5.88) 32–54 .82 7.33 (2.53) 3–13 9.42 (2.73) 5–15 3 44 39.50 (6.39) 26–51 32 42.06 (4.81) 32–50 .80 - - - -WISC 1 48 25.04 (5.89) 13–41 33 26.73 (6.37) 17–48 .90 Vocabulary Depth 8.90 (2.40) 4–15 9.70 (2.58) 5–18 (Max = 68) 2 45 27.16 (5.91) 18–44 33 28.85 (7.23) 18–51 .88 8.93 (2.28) 5–14 9.94 (2.97) 5–19 3 44 29.86 (6.26) 17–43 32 29.69 (6.24) 21–46 .82 9.11 (2.34) 5–14 9.19 (2.47) 5–15 CELF 1 48 7.00 (2.40) 1–12 33 8.00 (2.89) 3–13 .69 Listening Comprehension 8.29 (2.67) 1–13 9.36 (3.01) 3–14 (Max = 15) 2 47 7.30 (2.42) 4–13 33 8.30 (2.87) 4–14 .67 (Continues) DIXON, THOMSO N & FRICKE
Table 2.(Continued)
Time
EAL Non-EAL
Reliability
N Mean (SD) Range N Mean (SD) Range
7.81 (2.86) 4–14 9.06 (3.27) 4–15 3 44 8.05 (2.23) 4–15 32 7.84 (2.84) 2–14 .56 8.77 (2.66) 4–15 8.50 (3.26) 2–15 CELF 1 48 31.98 (6.99) 18–50 33 35.58 (5.37) 26–46 .60 Expressive Grammar 5.71 (2.58) 1–12 7.39 (2.26) 4–11 (Max = 56) 2 45 39.42 (5.83) 28–51 33 40.76 (6.67) 22–55 .62 7.58 (2.40) 3–13 8.42 (2.56) 2–15 3 44 43.40 (5.01) 31–55 32 45.63 (6.75) 29–56 .67 8.50 (2.23) 4–14 9.75 (2.39) 3–15 CTOPP 1 48 35.92 (7.73) 21–58 33 39.52 (9.81) 25–58 .66 RAN Letters 11.08 (2.17) 7–17 10.30 (2.34) 7–15 2 47 41.28 (8.49) 21–62 33 45.12 (11.13) 29–79 .82 9.77 (2.27) 6–19 9.03 (2.21) 5–13 3 44 37.82 (6.98) 22–57 32 42.63 (11.40) 28–85 .73 9.73 (2.45) 2–18 9.13 (2.37) 5–14 CTOPP 1 48 44.50 (11.08) 26–93 33 46.21 (12.65) 24–70 .58 RAN Digits 9.48 (1.94) 5–16 9.36 (2.40) 6–18 2 47 31.74 (5.67) 19–46 33 33.24 (6.51) 22–43 .78 11.51 (1.91) 8–17 11.09 (2.28) 8–15 3 44 29.02 (5.70) 18–43 32 33.03 (7.28) 21–52 .71 11.95 (2.16) 7–18 10.75 (2.41) 7–16 (Continues) LANGU A GE AND READING DEVELO PMENT IN EAL
Table 2.(Continued)
Time
EAL Non-EAL
Reliability
N Mean (SD) Range N Mean (SD) Range
PhAB 1 48 14.33 (6.36) 1–25 33 17.06 (6.69) 4–30 .75
Spoonerisms 2 46 17.65 (4.94) 7–27 33 19.70 (4.81) 10–27 .76
(Max = 30) 3 44 19.70 (5.17) 8–28 32 21.56 (5.58) 9–29 .73
Note: BPVS = British Picture Vocabulary Scale-III; CELF = Clinical Evaluation of Language Fundamentals-IV (no scaled score available att3); WISC = Wechsler Intelligence Scale for Children-IV; CTOPP = Comprehensive Test of Phonological Processing (RAN measured in seconds); PhAB = Phonological Assessment Battery (no age-standardised scores available). DIXON, THOMSO N & FRICKE
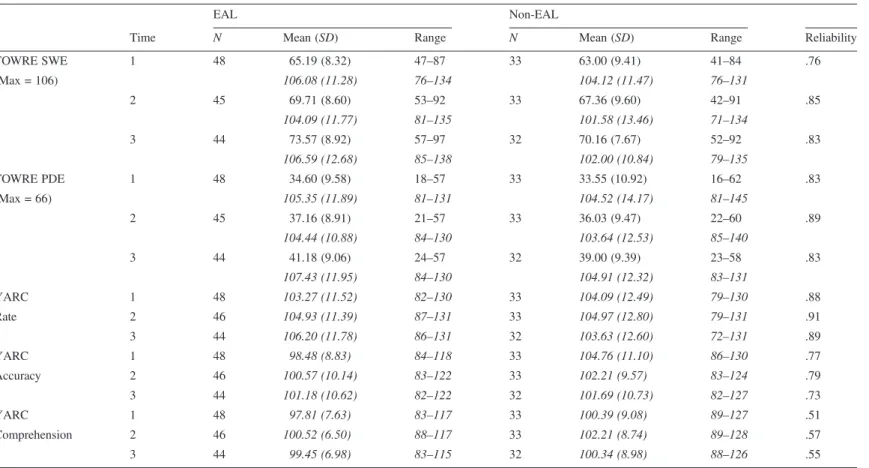
Table 3.Descriptive statistics for single-word and passage-reading variables for both groups at all three time points.
Time
EAL Non-EAL
N Mean (SD) Range N Mean (SD) Range Reliability
TOWRE SWE 1 48 65.19 (8.32) 47–87 33 63.00 (9.41) 41–84 .76 (Max = 106) 106.08 (11.28) 76–134 104.12 (11.47) 76–131 2 45 69.71 (8.60) 53–92 33 67.36 (9.60) 42–91 .85 104.09 (11.77) 81–135 101.58 (13.46) 71–134 3 44 73.57 (8.92) 57–97 32 70.16 (7.67) 52–92 .83 106.59 (12.68) 85–138 102.00 (10.84) 79–135 TOWRE PDE 1 48 34.60 (9.58) 18–57 33 33.55 (10.92) 16–62 .83 (Max = 66) 105.35 (11.89) 81–131 104.52 (14.17) 81–145 2 45 37.16 (8.91) 21–57 33 36.03 (9.47) 22–60 .89 104.44 (10.88) 84–130 103.64 (12.53) 85–140 3 44 41.18 (9.06) 24–57 32 39.00 (9.39) 23–58 .83 107.43 (11.95) 84–130 104.91 (12.32) 83–131 YARC 1 48 103.27 (11.52) 82–130 33 104.09 (12.49) 79–130 .88 Rate 2 46 104.93 (11.39) 87–131 33 104.97 (12.80) 79–131 .91 3 44 106.20 (11.78) 86–131 32 103.63 (12.60) 72–131 .89 YARC 1 48 98.48 (8.83) 84–118 33 104.76 (11.10) 86–130 .77 Accuracy 2 46 100.57 (10.14) 83–122 33 102.21 (9.57) 83–124 .79 3 44 101.18 (10.62) 82–122 32 101.69 (10.73) 82–127 .73 YARC 1 48 97.81 (7.63) 83–117 33 100.39 (9.08) 89–127 .51 Comprehension 2 46 100.52 (6.50) 88–117 33 102.21 (8.74) 89–128 .57 3 44 99.45 (6.98) 83–115 32 100.34 (8.98) 88–126 .55
Note: TOWRE = Test of Word Reading Efficiency-II; SWE = sight-word efficiency; PDE = Phonemic Decoding Efficiency; YARC = York Analysis of Reading for Comprehension-Primary. LANGU A GE AND READING DEVELO PMENT IN EAL
reference to Akaike’s information criterion and chi-square test statistics; West et al. 2007).
Fixed effects oftimeandgroupwere then added, as well as atime× group interaction term.
In the event of lack of significantly improvedfit, interaction terms were removed. Note,
however, thatfixed effects oftimeandgroupwere retained in all models in order to
com-pare developmental trajectories in constructs of interest. Final models were computed using restricted maximum likelihood estimation.
All models werefitted in R (R Core Development Team 2018) using the lme4 package
(Bates et al. 2015). No issues were encountered with nonconvergence of LMMs.
Addi-tional modelfit statistics (pseudoR2) were calculated using the MuMIn package (Bartón
2020), providing proportion of variance accounted for separately by random effects
(mar-ginalR2) and random andfixed effects together (conditionalR2).
The presence of highly influential observations was assessed using the influence.ME
package (Nieuwenhuis et al. 2017); this procedure provides case-deletion diagnostics by
iteratively removing each observation in order to assess effects (if any) on t-values of
model parameters. Data points were removed if their deletion altered the significance of
fixed effect parameters group or time. Raw scores served as dependent variables in all
models, with the exception of CELF-IV understanding spoken paragraphs and the YARC-P. Where not utilised for analysis, scaled and age-standardised scores are also re-ported in italics in descriptive tables for reference.
Results
Descriptive statistics for background cognitive measures are presented in Table 1. Att1,
the two groups did not differ significantly in nonverbal reasoning (WISC-IV matrix
reason-ing,t(79) = 0.59,p= .556,r= .06). Although the non-EAL group did show a small but
statistically significant advantage in CELF-IV number repetition total score at t1,
t(79) = 2.42, p= .018, r = .27, this group difference was no longer significant by t3,
t(74) = 0.51,p= .613, r= .06. Thus, neither group appeared to be advantaged relative
to the other in background cognitive skills att1or across the study, supporting the
appro-priateness of group comparisons on language and reading measures of interest.
Byt3, one child from the non-EAL group and three children from the EAL group no
lon-ger remained in the study, resulting in a sample of 45 EAL and 32 non-EAL children. In-cluding attrition and absences during testing, total missing data were 3.46% across all three time points (non-EAL group 1.09%, EAL group 3.65%). As LMM does not require bal-anced or complete data, all available data were utilised. Descriptive statistics for language
and reading measures are provided in Tables 2 and 3 in which ‘Reliability’ represents
Cronbach’s alpha for the study sample and age-standardised scores are presented in italics.
Linear mixed modelling
Table 4 presents results of LMM for all oral language and reading measures. Each LMM adhered to assumptions including normally distributed residuals and constant variance
acrossfixed effects (West et al. 2007). Following a step-up modelling procedure,fit
statis-tics for each model are presented in terms of change in Akaike’s information criterion
(ΔAIC), where a statistically significant reduction in AIC is interpreted as improvement
in model fit. Where case-deletion diagnostics identified influential observations,
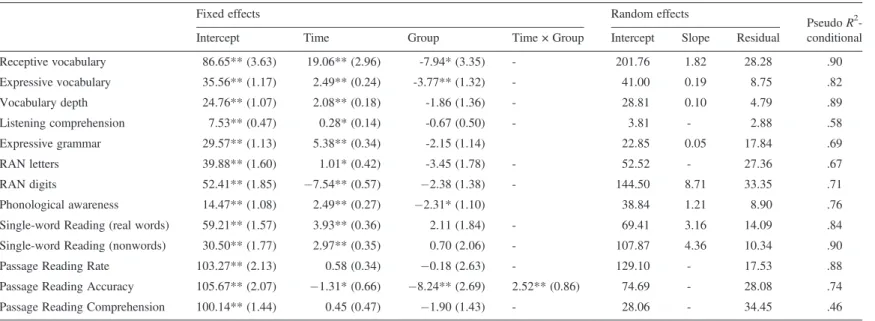
Table 4.Linear mixed modelling of oral language, phonological processing, and word-reading and passage-reading variables.
Fixed effects Random effects
PseudoR2 -conditional Intercept Time Group Time × Group Intercept Slope Residual
Receptive vocabulary 86.65** (3.63) 19.06** (2.96) -7.94* (3.35) - 201.76 1.82 28.28 .90 Expressive vocabulary 35.56** (1.17) 2.49** (0.24) -3.77** (1.32) - 41.00 0.19 8.75 .82 Vocabulary depth 24.76** (1.07) 2.08** (0.18) -1.86 (1.36) - 28.81 0.10 4.79 .89 Listening comprehension 7.53** (0.47) 0.28* (0.14) -0.67 (0.50) - 3.81 - 2.88 .58 Expressive grammar 29.57** (1.13) 5.38** (0.34) -2.15 (1.14) 22.85 0.05 17.84 .69 RAN letters 39.88** (1.60) 1.01* (0.42) -3.45 (1.78) - 52.52 - 27.36 .67 RAN digits 52.41** (1.85) 7.54** (0.57) 2.38 (1.38) - 144.50 8.71 33.35 .71 Phonological awareness 14.47** (1.08) 2.49** (0.27) 2.31* (1.10) 38.84 1.21 8.90 .76 Single-word Reading (real words) 59.21** (1.57) 3.93** (0.36) 2.11 (1.84) - 69.41 3.16 14.09 .84 Single-word Reading (nonwords) 30.50** (1.77) 2.97** (0.35) 0.70 (2.06) - 107.87 4.36 10.34 .90 Passage Reading Rate 103.27** (2.13) 0.58 (0.34) 0.18 (2.63) - 129.10 - 17.53 .88 Passage Reading Accuracy 105.67** (2.07) 1.31* (0.66) 8.24** (2.69) 2.52** (0.86) 74.69 - 28.08 .74 Passage Reading Comprehension 100.14** (1.44) 0.45 (0.47) 1.90 (1.43) - 28.06 - 34.45 .46
Note: Raw values are reported forfixed effects. Standard errors are indicated in parentheses. Variance is reported for random effects. Receptive vocabulary = BPVS-III; Expressive vocabulary = CELF-IV EV; Vocabulary depth = WISC-IV Vocabulary; Listening comprehension = CELF-IV USP (standardised score); Expressive grammar = CELF-IV FS; RAN letters = CTOPP RLN; RAN digits = CTOPP RDN; Phonological awareness = PhAB Spoonerisms; Single-word reading (real words) = TOWRE-II SWE; Single-word reading (nonwords) = TOWRE-II PDE; Passage Reading Rate, Accuracy, and Comprehension = YARC-P (standardised scores).
*p<.05; **p<.001. LANGU A GE AND READING DEVELO PMENT IN EAL
procedures are detailed below. Lack of a significant time × group interaction term is interpreted here as no evidence for convergence or divergence between the two groups over time.
Oral language
Receptive vocabulary (British Picture Vocabulary Scale-III; raw score).The addition of a
random slope term accounted for significantly better model fit in receptive vocabulary,
ΔAIC = 36.51,χ2(2) = 40.51,p<.001, as didfixed effects oftimeandgroupto a
con-siderable degree,ΔAIC = 121.63,χ2(2) = 125.63,p<.001. EAL learners scored
signif-icantly lower than their non-EAL peers in receptive vocabulary,β= 7.94,p= .020. A
time × group interaction term did not significantly improve model fit, ΔAIC = 1.93,
χ2(1) = 0.07,p= .789. In this and subsequent models, nonsignificant interaction terms were
removed from thefinal model in the interests of parsimony.
Expressive vocabulary (Clinical Evaluation of Language Fundamentals-IV; raw score).A
random slope term accounted for significantly better modelfit in expressive vocabulary,
ΔAIC = 13.18, χ2(2) = 17.18, p < .001, as well as the addition of fixed effects,
ΔAIC = 71.31,χ2(2) = 75.31, p<.001. Again, EAL learners performed significantly
lower than their non-EAL peers in expressive vocabulary (β= 3.77, p< .001), and
thetime x groupinteraction term was non-significant,ΔAIC = 1.45,χ2(1) = 0.55,p= .458. Vocabulary depth (Wechsler Intelligence Scale for Children-IV; raw score). A random
slope term accounted for significantly better model fit in vocabulary depth,
ΔAIC = 16.54,χ2(2) = 20.54,p<.001. Thefixed effects oftimeandgroupadditionally
improvedfit,ΔAIC = 77.11,χ2(2) = 81.11,p<.001; however,groupwas not a
signif-icant predictor of performance (β= 1.86,p= .174). Again, the addition of atime×group
interaction term did not improve modelfit,ΔAIC = 0.30,χ2(1) = 1.70,p= .192.
Listening comprehension (Clinical Evaluation of Language Fundamentals-IV; scaled score).A random slope term did not account for significantly better modelfit in listening
comprehension, ΔAIC = 2.03, χ2(2) = 1.97, p = .374, and therefore, an intercept-only
model was assumed. Fixed effects contributed significantly to modelfit,ΔAIC = 2.04,
χ2(2) = 6.04, p = .048, although performance did not differ as a function of group,
β= 0.67,p= .180. Atime×groupinteraction term did not significantly improve model
fit,ΔAIC = 1.64,χ2(1) = 3.65,p= .056.
Expressive grammar (Clinical Evaluation of Language Fundamentals-IV; raw score).
Case-deletion diagnostics revealed one highly influential participant in the non-EAL
group. This child scored at or just under the maximum score of the formulated sentences
subtest att2andt3(note that the influence.ME package identifies both influential
observa-tions and participants and that in this case the combined scores of this participant were
found to exert undue influence on the model). Deletion of this participant altered the
statis-tical significance of thegroupcoefficient (t = 2.16,p= .034 to t= 1.89,p= .063).
Therefore, data from all three time points for this participant were removed from thefinal
model. A random slope term accounted for significantly better model fit in expressive
grammar,ΔAIC = 30.51,χ2(2) = 34.51, p<.001, as well asfixed effects oftimeand
groupto a substantial degree, ΔAIC = 114.62,χ2(2) = 118.62,p<.001. However, as
noted earlier, thegroupcoefficient did not reach significance (β= 2.15,p= .063). Finally,
a time × group interaction did not add meaningfully to the model, ΔAIC = 1.34,
χ2(1) = 0.66,p= .415.
Phonological processing
Rapid automatised naming of letters (Comprehensive Test of Phonological Processing; raw score in seconds).Note that, as performance on RAN subtests is measured in seconds taken to name all stimuli, a higher score indicates slower naming speed. Case-deletion
di-agnostics revealed one influential observation in the non-EAL group at t3, as one child
took 85 seconds to name all 36 stimuli (az-score of 5.44). Removal of this observation
al-tered thegroupcoefficient significantly (fromt= 2.14,p= .035 tot= 1.94,p= .056),
and therefore, this observation was removed from thefinal model. The addition of a
ran-dom slope term did not result in significantly better model fit, ΔAIC = 3.78,
χ2(2) = 0.22,p= .894, and therefore, an intercept-only model was assumed. Fixed effects
oftimeandgroupdid improve modelfit,ΔAIC = 5.46,χ2(2) = 9.46,p= .009, butgroup
was not a significant predictor of performance (β= 3.45,p= .056). Atime×group
in-teraction term did not improve modelfit,ΔAIC = 1.76,χ2(1) = 0.24,p= .623, although
it is interesting to note that both groups became slower in letter naming performance over time (see Table 2).
Rapid automatised naming of digits (Comprehensive Test of Phonological Processing; raw score in seconds).Two observations in the non-EAL group att3exerted a high degree of
influence on the model for RAN of digits (scores of 39 and 52 seconds, respectively).
Re-moval of these data points altered the group coefficient significantly (from t = 2.11,
p= .038 tot= 1.73,p= .088), and these were therefore removed. The addition of a
ran-dom slope term resulted in significantly better modelfit,ΔAIC = 56.56,χ2(2) = 60.56,
p < .001, as well as the addition of fixed effects, ΔAIC = 96.44, χ2(2) = 100.44,
p <.001. As in RAN of letters, group was not a significant predictor of performance
(β = 2.38, p = .088). A time × group interaction term did not improve model fit,
ΔAIC = 1.73,χ2(1) = 0.27,p= .604.
Spoonerisms (Phonological Assessment Battery; raw score). The addition of a random
slope term resulted in significantly better model fit for spoonerism performance,
ΔAIC = 18.6, χ2(2) = 22.61, p < .001, as did fixed effects, ΔAIC = 58.74,
χ2(2) = 62.74,p<.001. EAL learners scored significantly lower than their non-EAL peers
(β= 2.31,p= .039), although atime×groupinteraction term did not contribute
signif-icantly to modelfit,ΔAIC = 1.83,χ2(1) = 0.17,p= .678.
Reading
Sight-word efficiency (Test of Word Reading Efficiency-II; raw score). The addition of a
random slope term contributed to significantly better fit in sight-word efficiency,
ΔAIC = 25.57,χ2(2) = 29.57,p<.001. Fixed effects oftimeandgroupalso contributed
to significantly better modelfit,ΔAIC = 69.67,χ2(2) = 73.66,p<.001, althoughgroup
was not a significant predictor of performance (β= 2.11, p= .257). The two groups
ap-peared to make similar rates of progress over time, as suggested by a nonsignificant
time×groupinteraction,ΔAIC = 1.20,χ2(1) = 0.004,p= .947.
Phonemic decoding efficiency (Test of Word Reading Efficiency-II; raw score).The
addi-tion of a random slope term contributed to significantly betterfit in decoding of nonwords,
ΔAIC = 26.78, χ2(2) = 30.78, p < .001, as did fixed effects, ΔAIC = 46.66,
χ2(2) = 50.67,p<.001. As in sight-word efficiency,groupwas not a significant predictor
of performance in nonword decoding (β= 0.70,p= .737), and atime×groupinteraction
term did not significantly improve modelfit,ΔAIC = 1.95,χ2(1) = 0.05,p= .823.
Passage reading rate (York Assessment of Reading for Comprehension-Primary; age-standardised score). The inclusion of a random slope term did not improve model
fit for passage reading rate,ΔAIC = 3.09,χ2(2) = 0.91,p= .635, and neither did the
addi-tion offixed effects,ΔAIC = 1.05,χ2(2) = 2.95,p= .223. Thus, performance was not
pre-dicted bytime(β= 0.56,p= .088) orgroup(β= 0.18,p= .946). Lack of significant effect
of time is likely a result of the utilisation of age-standardised scores. Atime×group
inter-action also failed to improve modelfit,ΔAIC = 0.26,χ2(1) = 1.74,p= .187.
Passage reading accuracy (York Assessment of Reading for Comprehension-Primary; age-standardised score). The addition of a random slope term, ΔAIC = 2.88,
χ2(2) = 1.12,p= .570, andfixed effects,ΔAIC = 1.39,χ2(2) = 2.61,p= .271, did not
im-prove modelfit for passage reading accuracy. Despite this, performance was predicted by
time(β= 1.31,p= .048) andgroup(β= 8.24,p= .003), with lower performance in
the EAL group. Atime × groupinteraction term did result in significantly improved fit,
ΔAIC = 6.43, χ2(1) = 8.43, p = .004; a result of a cross-over pattern (β = 2.52,
p= .004) in which the age-standardised scores of EAL learners increased while those of
their non-EAL peers decreased.
Passage reading comprehension (York Assessment of Reading for Comprehension-Primary; age-standardised score). Neither a random intercept term,
ΔAIC = 3.68, χ2(2) = 0.32, p = .854, nor fixed effects, ΔAIC = 1.25, χ2(2) = 2.75,
p= .252, improved model fit for passage reading comprehension. Additionally, fit was
not improved by the inclusion of a time × group interaction term, ΔAIC = 1.51,
χ2(1) = 0.49, p = .483. Passage reading comprehension was not predicted by time
(β= 0.45,p= .336) orgroup(β= 1.90,p= .187), suggesting similar performance and
trajectories.
Discussion
Diverse home language learning experiences and differing amounts of exposure to English
mean that many EAL learners begin formal schooling with lower English language profi
-ciency than their monolingual English-speaking peers. Attainment gaps between these two groups of learners are persistent, but little longitudinal work in the United Kingdom has examined developmental trajectories in language and reading skills.
The present study revealed significant group differences in receptive and expressive
vo-cabulary knowledge, spoonerisms and passage reading accuracy. Previous work in England DIXON, THOMSON & FRICKE
also supports the significantly lower performance of EAL learners on measures of
vocab-ulary knowledge (e.g. Burgoyne et al. 2009; Babayiğit 2014) and spoonerisms
(Frederickson & Frith 1998), although similarities with the literature end here. Contrary
to thefindings of previous research, this study did notfind evidence of significant group
differences in expressive grammar, listening comprehension or reading comprehension.
The lack of a significant group difference in depth of vocabulary knowledge as measured
by a definition task is a novelfinding among the EAL literature in England. This is
surpris-ing given contrary findings in the international literature (Droop & Verhoeven 2003;
Lervåg & Aukrust 2010) but may be attributable to the higher amount of English-medium instruction EAL learners had received in this study.
The two groups of children performed similarly on measures of RAN and single-word
reading. The finding that EAL learners performed significantly lower in spoonerisms
may be considered surprising given reported advantages of bilingual children in tasks tap-ping metalinguistic awareness (Campbell & Sais 1995). However, other factors may have played a part here: the Lexical Restructuring Hypothesis (Walley et al. 2003) proposes a
correlation between breadth of vocabulary knowledge and specificity of phonological
rep-resentations, and thus, EAL learners’smaller English vocabulary knowledge may have
re-sulted in lower performance in the manipulation of (sub)lexical strings. Indeed, the
spoonerisms subtest does contain some sophisticated vocabulary (e.g.pricklyandbrute).
Lastly, regarding RAN, thefinding that both groups of children becameslowerover time
in their naming of letters is currently unexplained.
Passage reading skills also produced unexpected results. Specifically, similar
perfor-mance between the two groups in passage reading comprehension but significantly lower
passage reading accuracy of the EAL group contradict previous work in England, which
tends to indicate the opposite pattern (Burgoyne et al. 2009; Babayiğit 2014). However,
a major obstacle to the interpretation of this result lies in the use of age-standardised scores that are less sensitive to change over time and somewhat inappropriate for EAL learners given the characteristics of the norming population of the YARC-P. Despite this caveat, it was interesting to note that both groups of children were performing within the average range for their age, with mean standardised scores around 100. Future work may circum-vent the issues of the YARC-P by holding passages constant to examine growth in raw scores over time.
The characteristics of the sample may go some way to explaining the
smaller-than-expected magnitude (or indeed lack of significant) group differences in measures of
lan-guage and literacy in the present study. Firstly, in order to control for differing amounts of English language exposure, all participants had to have been in receipt of English-medium education since at least Year 1. Furthermore, as indicated by the results of child and parent questionnaires, the majority of EAL learners had been born in the United Kingdom and were being exposed to English in the home. Secondly, schools taking part in the study were located in areas of relatively high socio-economic deprivation, and this may have lowered the performance of the non-EAL group (see age-standardised scores
in Table 2), thus decreasing the apparent‘gap’between the two groups. Therefore, it is
possible that the amount of EAL learners’exposure to English coupled with high levels
of socio-economic deprivation may have reduced the magnitude of group differences.
Although the generalisability of thefindings is limited due to the study’s relatively small
sample size, its longitudinal design and utilisation of LMM can be considered strengths. In particular, the possibility of freely varying intercepts and slopes serves to reduce residual variance and provide a measurement of heterogeneity in development. Results generally LANGUAGE AND READING DEVELOPMENT IN EAL
did not indicate any evidence for convergence or divergence between the groups over time, commensurate with the research literature in England (Hutchinson et al. 2003; Burgoyne et al. 2009).
In conclusion, during the Key Stage 2 phase of primary school education in England (age 7 to 11), EAL learners appear to experience challenges relative to their non-EAL peers in certain English language and reading skills, and such group discrepancies do not appear to narrow over a period of 18 months as a result of regular classroom instruction. Despite
considerable heterogeneity in the English language proficiency of EAL learners across the
country, the finding that the EAL learners in the present study continued to show such
weaknesses after three years of English-medium instruction and despite exposure to
En-glish in the home is a cause for concern. Thesefindings should be interpreted within the
context of recent reductions to school funding and inconsistent training opportunities for teachers (Flynn & Curdt-Christensen 2018) and further justify recommendations for dedi-cated and explicit English oral language support for EAL learners particularly in the
do-main of vocabulary knowledge (Burgoyne et al. 2009; Babayiğit 2014).
Data Availability Statement
The data that support thefindings of this study are available from the corresponding author
upon reasonable request.
Note
1. To be eligible for the intervention, children had to score at least 1SD on two out of the
three vocabulary measures reported in the present study. Intervention participants were taught a total of 20 words in 30-minute sessions once a week for 10 weeks. Linear mixed effects models were rerun without the 12 children who took part in the vocabulary
inter-vention. As a result of this removal,groupcoefficients changed for receptive vocabulary
(fromt = 2.37,p= .020 tot = 1.42,p= .161) and spoonerisms (fromt = 2.31,
p= .039 tot= 1.38,p= .172). No othergroup coefficients were altered. This was
an expected pattern given that these children necessarily had lower levels of vocabulary knowledge than their other EAL peers and also that spoonerism performance is likely to be associated with vocabulary knowledge (see Discussion).
References
August, D. & Shanahan, T. (2008).Developing Reading and Writing in Second-Language Learners: Lessons From the Report of the National Literacy Panel on Language-Minority Children and Youth. Mahway: Lawrence Erlbaum Associates.
Babayiğit, S. (2014). The role of oral language skills in reading and listening comprehension of text: a comparison of monolingual (L1) and bilingual (L2) speakers of English language.Journal of Research in Reading, 37, 22–47. https://doi.org/10.1111/j.1467-9817.2012.01538.x.
Bartón, K. (2020). MuMIn: multi-model inference. Retrieved from https://cran.r-project.org/web/packages/ MuMIn/index.html.
Bates, D.M., Maechler, M., Bolker, B. & Walker, S. (2015). Fitting linear mixed-effects models using lme4. Jour-nal of Statistical Software, 67, 1–48. https://doi.org/10.18637/jss.v067.i01.
Burgoyne, K., Kelly, J.M., Whiteley, H.E. & Spooner, A. (2009). The comprehension skills of children learning English as an additional language.British Journal of Educational Psychology, 79(Pt 4), 735–747. https://doi. org/10.1348/000709909X422530.
Burgoyne, K., Whiteley, H.E. & Hutchinson, J.M. (2011). The development of comprehension and reading-related skills in children learning English as an additional language and their monolingual, English-speaking peers. British Journal of Educational Psychology, 81(Pt 2), 344–354. https://doi.org/ 10.1348/000709910X504122.
Campbell, R. & Sais, E. (1995). Accelerated metalinguistic (phonological) awareness in bilingual children.British Journal of Developmental Psychology, 13, 61–68. https://doi.org/10.1111/j.2044-835X.1995.tb00664.x. Costley, T. (2014). English as an additional language, policy and the teaching and learning of English in England.
Language and Education, 28, 276–292. https://doi.org/10.1080/09500782.2013.836215.
Cunningham, A. & Stanovich, K. (1997). Early reading acquisition and its relation to reading experience and abil-ity ten years later.Developmental Psychology, 33(6), 934–945. https://doi.org/10.1037/0012-1649.33.6.934. Demie, F. (2013). English as an additional language pupils: how long does it take to acquire Englishfluency?
Lan-guage and Education, 27, 59–69. https://doi.org/10.1080/09500782.2012.682580.
Department for Education. (2015). Schools, pupils and their characteristics: January 2015 (Local Authority tables).
Department for Education. (2019). Schools, pupils and their characteristics: January 2019 (National tables). Department for Education and Skills. (2007). Ensuring the attainment of pupils learning EAL. Retrieved from
https://www.naldic.org.uk/Resources/NALDIC/Teaching%20and%20Learning/ks3_ws_eal_mgmt_gd_sch_ strat.pdf
Droop, M. & Verhoeven, L. (2003). Language proficiency and reading ability infirst- and second-language learners.Reading Research Quarterly, 38, 78–103. https://doi.org/10.1598/RRQ.38.1.4.
Dunn, L., Dunn, D. & NFER (2009).British Picture Vocabulary Scale. (Third edn). London: GL Assessment. Flynn, N. & Curdt-Christensen, L. (2018). Intentions versus enactment: making sense of policy and practice for
teaching English as an additional language.Language and Education, 32, 410–427. https://doi.org/10.1080/ 09500782.2018.1475484.
Frederickson, N. & Frith, U. (1998). Identifying dyslexia in bilingual children: a phonological approach with inner London Sylheti speakers. Dyslexia, 4, 119–131. https://doi.org/10.1002/(SICI)1099-0909(199809)4:3% 3C119::AID-DYS112%3E3.0.CO;2-8.
Frederickson, N., Frith, U. & Reason, R. (1997).Phonological Assessment Battery. (Standardised edn). London: NFER-Nelson.
Geva, E. & Farnia, F. (2012). Developmental changes in the nature of language proficiency and readingfluency paint a more complex view of reading comprehension in ELL and EL1. Reading and Writing, 25, 1819–1845. https://doi.org/10.1007/s11145-011-9333-8.
Gough, P.B. & Tunmer, W.E. (1986). Decoding, reading, and reading disability.Remedial and Special Education, 7, 6–10. https://doi.org/10.1177/2F074193258600700104.
Hessel, A. & Murphy, V. (2019). Understanding how timeflies and what it means to be on cloud nine: English as an additional language (EAL) learners’metaphor comprehension.Journal of Child Language, 46(2), 265–291. https://doi.org/10.1017/S0305000918000399.
Hutchinson, J.M., Whiteley, H.E., Smith, C.D. & Connors, L. (2003). The developmental progression of comprehension-related skills in children learning EAL.Journal of Research in Reading, 26, 19–32. https:// doi.org/10.1111/1467-9817.261003.
Karlsen, J., Lyster, S.-A.H. & Lervåg, A. (2017). Vocabulary development in Norwegian L1 and L2 learners in the kindergarten–school transition. Journal of Child Language, 44(2), 402–426. https://doi.org/10.1017/ S0305000916000106.
Lervåg, A. & Aukrust, V.G. (2010). Vocabulary knowledge is a critical determinant of the difference in reading comprehension growth betweenfirst and second language learners.Journal of Child Psychology and Psychia-try, 51(5), 612–620. https://doi.org/10.1111/j.1469-7610.2009.02185.x.
Melby-Lervåg, M. & Lervåg, A. (2014). Reading comprehension and its underlying components in second-language learners: a meta-analysis of studies comparingfirst- and second-language learners. Psycholog-ical Bulletin, 140(2), 409–433. https://doi.org/10.1037/a0033890.
Neale, M. (1997).Neale Analysis of Reading Ability. Windsor: NFER-Nelson.
Nieuwenhuis, R.M., te Grotenhuis, M. & Pelzer, B. (2017). Influence.ME: tools for detecting influential data in mixed effects models.R Journal, 4, 38–47. https://doi.org/10.32614/RJ-2012-011.
Ouellette, G.P. (2006). What’s meaning got to do with it: the role of vocabulary in word reading and reading com-prehension.Journal of Educational Psychology, 98, 554–566. https://doi.org/10.1037/0022-0663.98.3.554. LANGUAGE AND READING DEVELOPMENT IN EAL
R Core Team. (2018). R: a language and environment for statistical computing.
Semel, E., Wiig, E. & Secord, W. (2006).Clinical Evaluation of Language Fundamentals: Fourth U.K. edition. London: Pearson assessment.
Smith, S. & Murphy, V. (2014). Measuring productive elements of multi-word phrase vocabulary knowledge among children with English as an additional or only language. Reading and Writing, 28(3), 347–369. https://doi.org/10.1007/s11145-014-9527-y.
Snowling, M.J., Stothard, S., Clarke, P., Bowyer-Crane, C., Harrington, A., Truelove, E. et al. (2011).York Assess-ment of Reading for Comprehension. London: GL Assessment.
Strand, S., Malmberg, L. & Hall, J. (2015).English as an Additional Language (EAL) and Educational Achieve-ment in England: An Analysis of the National Pupil Database. University of Oxford.
Thomas, W., & Collier, V. (2002). A national study of school effectiveness for language minority students’
long-term academic achievement. Centre for Research on Education, Diversity & Excellence.
Wagner, R., Torgesen, J. & Rashotte, C. (1999a).Comprehensive Test of Phonological Processing. Austin: Pro-ED.
Wagner, R., Torgesen, J. & Rashotte, C. (1999b).Test of Word Reading Efficiency. (Second edn). Austin: Pro-ED. Walley, A., Metsala, J. & Garlock, V. (2003). Spoken vocabulary growth: its role in the development of phoneme awareness and early reading ability.Reading and Writing, 16, 5–20. https://doi.org/10.1023/A:1021789804977. Wechsler, D. (2003).Wechsler Intelligence Scale for Children. (Fourth edn). San Antonio: Harcourt Assessment. West, B.T., Welch, K.B. & Galecki, A. (2007).Linear Mixed Models: A Practical Guide Using Statistical
Soft-ware. London: Chapman & Hall/CRC.
Chris Dixon, BA, MEd, PhD, is a Research Fellow at the University of Leeds.
Jenny Thomson, BMedSci, PhD, MRCSLT, is a Reader in the Department of Human Communica-tion Sciences at the University of Sheffield.
Silke Fricke, MSc, PhD, SLT, is a Senior Lecturer in the Department of Human Communication Sci-ences at the University of Sheffield.
Received 6 May 2019; revised version received 3 April 2020.
Address for correspondence:Chris Dixon, School of Psychology, University of Leeds, Leeds, UK. E-mail: [email protected]