Cigarette taxation has continuously been a source of public, academic and social debate. In fact, the entire idea of a “sin tax” is a topic which economists have focused on for years. The purpose of a sin tax is to force individuals who engage in risky activities to pay for the negative externalities caused by said activities. In the case of cigarette smoking, the notion has been that society as a whole subsidizes the smoking related external expenses through programs such as Medicare, Medicaid and group life and health insurance. The argument is that smokers suffer from medical problems resulting from their habit, and those problems have associated medical costs that society
collectively pays for through high group life and health insurance premiums and high Medicare payments. In other words, non-smokers are helping to defray the costs of a smoker’s medical expenses through these insurance type programs.
Recent debate centered on the “efficient level” of cigarette taxation. Since the class action settlements that forced tobacco companies to pay heavily for the medical problems of former smokers, the taxes on cigarettes have increased. This has only
intensified the debate on the issue of cigarette taxation. As the issue looms, an alternative view on the “efficient tax” level has surfaced. This school of thought examines not only the negative externalities from smoking, but also the net external savings experienced by taxpayers resulting from the choice by some individuals to smoke. At the center of this debate is “Cigarette Taxation and the Social Consequences of Smoking” by W. Kip Viscusi. Viscusi’s paper written in 1995 for the NBER publication Tax Policy and the Economy contains estimates of both the net external costs and benefits of smoking.
This paper will evaluate the confidence level of Viscusi’s external cost and savings estimates and assess the impact of error terms on his conclusions. Section I consists of a brief outline of Viscusi’s paper, containing his thesis, results and their implications. The Second section provides an in depth look at the theory for setting an efficient level of taxation. Included is a discussion of the functions through which Viscusi examines how individuals internalize and externalize the costs of smoking. In addition, the cigarette tax profile of the United States, including figures on the current level of cigarette taxes and cigarette tax revenue is presented. Section III contains detail on the cost estimates Viscusi uses in making his argument and the background for his numbers. Section IV examines the implications of statistical error associated with
Viscusi’s estimates. The particular sensitivity analysis of Viscusi’s cost estimates tests the robustness of his total net external cost figure. His evaluation of the efficient cigarette tax based on total external costs is a point estimate and does not consider the potential for error. Calculating a range of values to account for this error will improve the analysis the cost figures. Section V assesses the implications of such an accounting and gives recommendations for expanding this analysis.
Section I: Through the Smoke Screen
Viscusi’s thesis in “Cigarette Taxation and the Social Consequences of Smoking” has met with some degree of skepticism and concern. This position is that “detailed calculations of the financial externalities of smoking indicate that the financial savings from premature mortality in terms of lower nursing home costs and retirement pensions exceed the higher medical care and life insurance costs generated” (Viscusi, 1995). He numerically supports this proposition through calculations of the insurance externalities of smoking. He estimates the total net external insurance costs per pack of cigarettes. There are seven cost elements Viscusi estimates to calculate the total cost: total medical care costs, sick leave, group life insurance, nursing home care, retirement pension, fires, and taxes on earnings. His conclusion is that the total net cost of the above elements is actually negative, meaning that smoking does not impose a net external cost on society; in fact a net external savings is realized.
In light of his results, the desirability of cigarette taxation to offset the external costs resulting from smokers is brought into question. Consider that several states have brought lawsuits against tobacco companies to recoup state Medicare payments. The current administration has argued for raising the cigarette tax to pay for higher health insurance costs. These arguments rest on the tenant that the individual’s choice to smoke results in an external cost to society. How do tax policies factor in the financial savings from the premature death of smokers? The issue of premature death is central to
Considerable debate has occurred resulting from these conclusions. The inclusion of premature death in these calculations has pioneered what Matthew Miller has dubbed the “lifetime” approach. In his Op/Ed article in the Seattle Times, “Blowing Smoke at the Debate over Tobacco’s True Cost”, Miller discusses both Viscusi’s analysis and prior work along this line. The lifetime approach considers not only the social costs imposed by smokers today, but also the costs and savings over the lifetime of the smoker (Miller, 1997). Miller however quotes MIT economist Jeffrey Harris as saying that the lifetime approach “is not the kind of calculation that a civilized society engages in”. In other words, the gruesome position that premature death from smoking saves money in a lifetime analysis is not the desired mindset for a lawmaking body when debating cigarette taxation issues. Economically speaking however, counting only external costs and ignoring external savings over a lifetime is a shortsighted method for assessing the impact of a risky activity.
Peter VanDoren of the Cato Institute has supported the case of the smokers heavily burdened by government imposed taxes. He also discusses the regressivity of the cigarette tax. He states that smokers bear a heavy financial burden directly through cigarette taxes and then indirectly as the costs of recent liability rulings against the tobacco companies is passed on to the consumer. The cigarette tax, which is admittedly regressive, bears on the segment of society that is the least equipped to handle it.
“Families with less than $30,000 a year in income earn only 16% of total income in the United States, yet they pay about 47% of the federal tobacco taxes” (VanDoren, 1998).
What are the implications of this school of thought on the way cigarette taxation can be analyzed? Does the lifetime approach have merit? Another concept that should not be discounted is that there are several different dynamics at work when tobacco taxation policy is set. Theoretically the tax is set to account for the externalities involved in smoking. More specifically, to account for the costs that a smoker can not or does not internalize. This however, is not the sole decision factor. There is also a great deal of power in the anti-smoking lobby in the United States. Many policy-makers believe that smoking should be discouraged in children and young people.
There are the ideas about the impact of second hand smoke, although the connections to health hazards from second hand smoke are still tenuous at best. Also, the annual tax revenue collected by the government from cigarette taxes is enormous. As such, the ability of policy makers to change direction and perhaps reduce cigarette taxes because of the potential results from the lifetime approach would be difficult.
This paper extends the analysis described above by focusing on the accuracy of Viscusi’s conclusions. Consider that when calculating the appropriate “external cost per pack” from which the efficient tax will be set, the numbers are relatively small. Viscusi estimates that with no discount factor the external cost savings per pack from smoking is $1.57 (Viscusi, 1995). In this scenario, the fluctuation of a few cents has significant implications on total tax revenue collected. The difference between a $.20 per pack tax and a $.22 per pack tax is only two cents per pack. Yet this potentially translates into billions in total tax revenue. How important then does the error term become when calculating the cost elements?
Specifically, the analysis contained herein consists of the following. After the presentation of the cost estimates that Viscusi derives, the history behind his figures is examined. His external insurance cost per pack figures are actually updates of the
Willard Manning et al 1991 RAND work, from The Cost of Poor Health Habits. Here the RAND study’s data collection techniques, original calculations, and relevant assumptions are examined. We then present the case for the inclusion of an error term in Viscusi’s cost element calculations and in the total net external cost per pack estimate. Due to the nature of this data, when an appropriate error term is applied to his cost calculations, the resulting “cost per pack” could vary significantly from his estimate. Differences of a few cents per pack in tax level can have significant implications for the total tax revenue collected. As a result, any figure for external costs per pack should be estimated as a range of values and not as a point estimate. The subsequent data analysis consists of setting probability distribution functions for each cost element, running Monte Carlo simulations to estimate the potential range of values for these cost elements, and
Section II: To Set an Efficient Tax Level
An efficient cigarette tax should address both the welfare loss to smokers who do not adequately estimate the risks of smoking, and the net societal loss caused by smokers. Viscusi maintains the assumption that individuals will likely underestimate the risks of smoking which result in net societal costs. Viscusi focus’s on the individual decision-maker to model the welfare of smokers and non-smokers and how they internalize the costs of smoking.
Consider the following in which an individual decision-maker operates according to the utility function:
L Y W P Y V P Y U π π π − + − > + − ) ( ) ( ) ( ) 1 ( (1)
and the following parameters.
=
) (Y
W Welfare derived from income Y of a non-smoker,
=
P Price of Cigarettes
=
− )
(Y P
U Good health derived by the smoker while smoking
=
− )
(Y P
V Bad health derived by the smoker while smoking
=
π True health risk posed by cigarettes = probability of bad health
=
L Social loss from smoking
If follows from the above that if the individual makes the decision not to smoke they receive a welfare level of W(Y). The individual can purchase cigarettes at price P , and by smoking derive two different health outcomes shown by U(Y −P) and V(Y−P); good and bad health respectively. Note that the true health risk from smoking, π , is not always known by the decision-maker. Also, the social loss from smoking, L , is not part of the smoker’s decision criteria on the left side of the function. If the individual decides that the expected utility from smoking exceeds the welfare from not smoking, then they will make the decision to smoke.
What are the potential flaws in the above outlined decision-making process? One is that accurate information on the risk of smoking, π , may not be known.
The perception of risk may be substantially different from the actual risk. Second, the net social cost is in no way internalized by the smoker. In this situation, when there is no tax to correct for the market shortfall, the individual will make his/her decision on the
probability of poor health from smoking, q . Equation (1) is then transformed to the following: ) ( ) ( ) ( ) 1 ( −q U Y −P +qV Y−P >W Y (2)
In this case, the probability of ill health, q , may differ from the actual risks of smoking,
π . This individual’s decision then is not factoring in the differences in risk perception or the net external cost of smoking. The decision to smoke may be both inefficient from the standpoint of the smoker and society. The question follows, would individual’s decisions to smoke be the same with accurate risk information?
Viscusi defines S as the compensation required to make an individual indifferent to smoking. For smokers, Sis greater than zero. For individuals choosing not to smoke the value of S is negative, which reflects their willingness to pay some positive sum not to smoke. If the true risk of smoking is known, and individuals choose to smoke, than the following condition will hold:
) ( ) ( ) ( ) 1 ( −π U Y +S−P +πV Y +S−P =W Y (3)
Even in the presence of accurate risk information, the decision can still be made to smoke, without considering the external cost to society from the right hand side of Equation (1). Economically then, decision-makers must face a mechanism that will provide sufficient discouragement to smoking, given the societal costs. Theoretically, an appropriate tax on cigarettes could force individuals to internalize the external effects of smoking. The tax may also act in the same manner as efficient risk information, and discourage smoking in some individuals altogether. So ideally, the tax would incorporate
An individual, completing Viscusi’s process, would choose to smoke according to the following function in the presence of a tax T:
) ( ) ( ) ( ) 1 ( −q U Y −P−T +qV Y −P−T >W Y (4)
If the tax is properly set, individuals will be able to make an economically optimal decision even in the presence of imperfect risk information and external social costs.
How has the cigarette tax been applied in the U.S.? Has the tax level been set as to optimally compensate for the imperfections in information? What is the profile of the cigarette tax in the late 1990’s? Viscusi maintains in that cigarettes are the most heavily taxed major category of consumer purchases, relative to the purchase price amount. They are subject to a tax rate relative to price that is higher than alcohol, gasoline and
automobiles. The federal and state governments collect large sums of tax revenue from cigarettes each year. For the fiscal year ending June 30, 1997, the total of federal, state and municipal excise taxes on cigarettes was over $13 billion. This revenue is divided roughly 55% and 45% between state and federal governments respectively. The total federal cigarette tax was raised to $.24 per pack on January 1, 1993. The state and local tax ranged from $.025 to $.84 throughout the country during the same period (Tobacco Institute, 1997).
Due to the composition of smoking Americans, the cigarette tax is regressive in nature. The percentage of smokers declines with higher income levels as depicted in the following table: Table 1: Income 1990 Current Smoker Less than $10,000 31.6% $10,000 to $19,999 29.8% $20,000 to $34,999 26.9% $35,000 to $49,000 23.4% $50,000 or more 19.3%
Income status and smoking prevalence have been correlated for some time, as have levels of education. As a result, the cigarette tax burden is paid disproportionately by the lowest income groups. With this as background to the debate of an efficient cigarette tax,
Section III will provide details of Viscusi’s estimates, and lay out the background data from the Manning research and RAND study.
Section III: The Anatomy of the Cost Estimates
The estimates Viscusi uses to derive his external insurance costs per pack of cigarettes consist of seven cost elements. They are presented below in Table 2 and form the basis for his thesis and the subsequent sensitivity analysis. The cost elements are discussed in the order in which they appear in the table.
Table 2:
External insurance costs
per pack of cigarettes (1993 dollars)
0% Discount Rate Costs
Medical care 0.66
Sick leave 0.003
Group life insurance 0.22
Nursing home care -0.58
Retirement pension -2.66
Fires 0.01
Taxes on earnings 0.77
Total net costs per pack -1.57
The above table contains estimates of external costs per pack of cigarettes for seven cost elements, which when summed yield a total external cost per pack of -$1.57. Total medical care includes medical costs for individuals under the age of 65 and for those 65 years and older. These costs represent additional medical expenses that occur from an individual’s decision to smoke, and are passed on to the non-smoking segment of society in terms of Medicare and Medicaid payments for smoking diseases. Higher group medical insurance premiums are also included in this element.
Sick leave costs per pack are included for the loss in production due to sick leave taken by smokers. The assumption is made that the smoking related illnesses cost society not only the direct expense of treatment, but also due to the amount of missed work relating to those illnesses. While the figure seems negligible at less than $.01 per pack, when multiplied by the number of cigarette packs smoked the value becomes obvious. Smokers also supposedly assert a cost on society by driving up rates for group life insurance plans. Since smoking related illnesses can lead to premature death, the payout potential is increased with the inclusion of smokers in a group plan. As a result, group life premiums are higher for non-smokers as well. This costs taxpayers an estimated $.22 per pack.
Nursing home care factors in as net savings per pack in Viscusi’s analysis. This element is the first of the controversial “lifetime approach” elements discussed in Section I and measures the potential cost saving to society from premature death. This element is estimated to save society -$.58 per pack of cigarettes. The theory behind this is that nursing home care is not completely funded by the individuals. Most facilities are maintained by combination of government payments and individual contributions. As such, any reduction in length of stay in nursing homes would result in financial savings to society. Again using the “lifetime approach”, reduction in length of stay at nursing homes by smokers due to premature death would reduce the public cost of nursing home care. Hence smoking causes net savings to society by reducing nursing home payments.
Similarly, smoker’s premature deaths reduce the amount of time they will collect both Social Security and pension payments. This results in public financial savings by reducing the amount of payout to older Americans. While smokers work during their productive years and pay taxes on earnings into the Social Security fund for instance, they have a shorter retirement and therefore do not collect as large an amount of benefit payments. In effect, they are reducing the payments to retirees by an estimated -$2.66 per pack of cigarettes.
The estimate of $.01 per pack for fires reflect the additional cost imposed by fire. This cost is for insurance costs only due to fire related damages. Again, this is a
negligibly small cost when evaluated on a per pack basis, but it becomes significant when extrapolated over the total number of packs smoked annually. The final element of the total net cost calculation is taxes on earnings. The cost to society for this element is the tax revenue lost from the premature deaths of smokers still in their productive life. $.77 per pack is the amount of taxes that can not be collected on smokers’ potential earnings. Viscusi’s conclusion from these estimates is that smoker’s already pay their own way in terms of compensating for net external costs caused by their decision to smoke. The net external cost savings are due to the premature deaths of smokers resulting in reductions in nursing home costs and Social Security and pension payments. This figure of -$1.57 per pack does not include the cigarette taxes already paid by smokers. If this factor were to be included, there would be both a net savings per pack and additional tax revenues from smokers. Viscusi’s final statement concerning his results in Table 2 is that taken at face value, if the tax amount on cigarettes were to be set according to total net externalities from smoking, cigarette smoking should be subsidized rather than taxed (Viscusi, 1995). As a result, there is not rationale for the current policy of setting cigarette taxes to pay for the insurance related externalities caused by smoking.
Viscusi’s cost estimates above are updated figures of a table from The Costs of Poor Health Habits, by Willard Manning et al. This book, published in 1991, builds the numerical estimates of external costs per pack based on the RAND Corporation’s 1987
“Conducted by the RAND Corporation from 1974 to 1982 under a grant from the U.S. Department of Health and Human Services, the HIE was a large-scale, controlled trial of cost sharing in health insurance” (User’s Guide to HIE Data, 1987). The purpose of the HIE was to assess the effects of different types of insurance on patient health and heath care delivery. The experiment collected data for eight years from 5,800 individuals from the following six sites:
Dayton Ohio;
Seattle, Washington;
Franklin Country and Fitchburg, Massachusetts; Georgetown County and Charleston, South Carolina (User’s guide to HIE Data, 1987).
The majority of the data came from two sources. Some was taken from claims that participants submitted and therefore reflects billed services and expenditures.
Participants also completed an extensive medical history questionnaire from which data was used. The seven cost elements Viscusi uses in his analysis are identical to the
elements in the Manning et al work. The updates Viscusi makes to the Manning et al data consist only of updating to 1993 dollars and accounts for the changing dynamics in medical expenses. What follows, is the development of the Manning et al table, Table 3, which is the basis for Viscusi’s calculations.
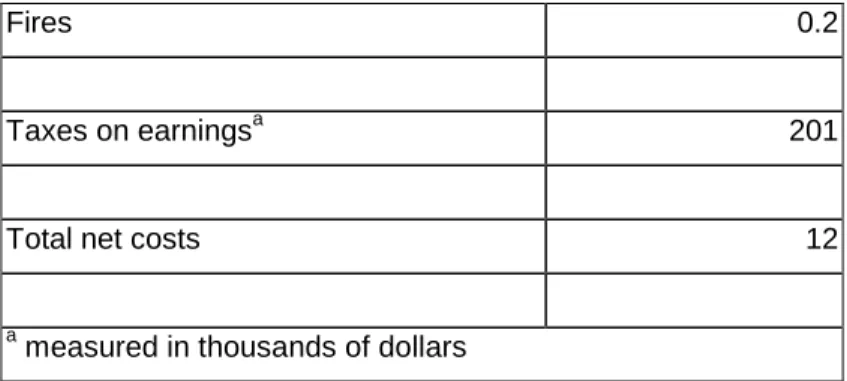
Table 3:
Lifetime external costs of smokers 1986 Dollars
Cost
Number of packs in lifetime 16,300
Life expectancy at age 20 55.5
Costsa
Medical Care 59
Sick Leave 6
Group life insurance 5
Nursing home care 10
Fires 0.2
Taxes on earningsa 201
Total net costs 12
a
measured in thousands of dollars Manning et al, 1991
Table 3 above contains calculations of the average lifetime external costs each cost element category for smokers. The medical costs include all external medical expenses except maternity and well-care and all covered work loss. For older smokers the costs include all medical services and retirement costs. The average number of packs smoked of 16,300 in a smoker’s lifetime is based on the number of packs smoked in 1983 (Manning et al, 1991). Table 4 below, represents similar costs for a category of individuals called non-smoking smokers. This hypothetical group is like the smoker group in every way except that they do not smoke. This group was created in an attempt to account for the fact that smokers supposedly differ from non-smokers in many other ways than simply the habit of smoking. It is believed that smokers are less future oriented and thus develop other risky habits different from non-smokers. These habits, specifically not wearing seatbelts and drinking lead to other external costs not related to smoking. To account for the external costs due to smoking, the study controlled for age, sex, race, education, drinking habits, exercise habits, family size, income, self-assessed measures of physical, mental and general health and seatbelt use. Thus, the calculation of external costs of non-smoking smokers is used to reflect the “external costs of smokers if they had never smoked but had retained all their other characteristics” (Manning et al, 1991). This table represents total lifetime costs to an individual.
Table 4:
Lifetime external costs of nonsmoking smokers 1986 Dollars
Cost
Number of packs 0
Life expectancy at age 20 59.8
Costs
Medical Care 53.00
Sick Leave 6.00
Group life insurance 4.00
Nursing home care 14.00
Retirement pension 163.00
Fires 0.00
Taxes on earnings 211.00
Total net costs per pack 29.00
Manning, 1991
The validity of the non-smoking smoker’s category will be discussed in detail in Section IV. Table 5, presented below, calculates the difference between the external cost of smokers and the external costs of non-smoking smoker’s. It his here that Manning estimates the actual net external costs of smoking, having controlled for all other characteristics of smokers that can lead to external costs.
Table 5:
Difference in lifetime external costs between 1986 Dollars
smokers and nonsmoking smokers
Difference in life expectancy at age 20 (4.30)
Differences in costs
Sick Leave 0.00
Group Life Insurance 1.00
Nursing Home Care -4.00
Retirement Pension -30.00
Fires 0.20
Taxes on earnings -10.00
Differences in total net costs -16.80
Manning et al, 1991
Dividing the external lifetime costs due to smoking by the lifetime number of packs from Table 3 estimates the external costs per pack due to smoking. The resulting values are given in Table 6 below.
Table 6:
External costs per pack of cigarettes 1986 dollars
Costs per pack
Medical Care 0.37
Sick Leave 0.00
Group Life Insurance 0.06
Nursing Home Care -0.25
Retirement Pension -1.84
Fires 0.01
Taxes on earnings (dollars) -0.61
Total net costs per pack -1.03
Viscusi’s estimate as previously discussed are 1993 updates to the above table of values. The data and assumptions that went into the development of the Manning et al estimates are contained in the analysis that follows in Section IV. Also included are discussions of the elements of the calculations and some of the data collection techniques that RAND employed in the HIE. Resulting is the potential for significant errors in the Manning et al results, which are not accounted for in Viscusi’s analysis. Finally, the sensitivity analysis is applied to Viscusi’s figures in which the cost elements are allowed to vary according to appropriate probabilities. Subsequent range estimates are then provided.
Section IV: Evaluating the Potential for Error
There are four major categories through which the potential for error appears to be greatest. It is through these areas that the level of confidence breaks down when evaluating the accuracy of the cost estimates that drive Viscusi’s total net external cost figure. The first area to be discussed is the data collection techniques employed by RAND during the HIE experiment previously described. Second will be the assumptions and manipulations Manning et al employed in calculating Table 5 above. The final two areas will be the issue of the “non-smoking smoker” created in the Manning et al study and omitted relevant variables.
The 5,200 individuals participating in the HIE were randomly selected from the six sites, with the following groups excluded: those with family incomes over $25,000 (1973 dollars), those institutionalized (jail, long-term hospital) and those on active-duty military service or military retirees and their dependents (HIE Study, 1987). In 1970, families with income less than $25,000 represented only 38.1% of all families (Statistical Abstract of the United States, 1993). As a result, a significant portion of Americans was excluded from the study. The second excluded category has many dynamics that could factor into an analysis of the costs of smoking. Consider for instance the prevalence of smoking in American prisons. Second, institutionalized individuals are already imposing a net social cost for their physical care.
All medical care for prison inmates is publicly funded. So 100% of the medical costs for inmates suffering from smoking related illnesses would need to be included in an analysis of the net external costs of smoking. Similarly, active duty and retired military and their dependents are also covered for medical expenses by the federal government. Again, any expenses related to smoking illnesses should be added to the total net external costs from smoking. Since taxpayers are already paying to medically support these two groups they should be included in any comprehensive study of external costs.
The majority of the original data collected by RAND appear in the form of medical history questionnaires and medical claims forms. The medical history questionnaires were given in three versions, determined by age group. The topics covered in the questionnaires include health status, attitudes, habits and specific medical disorders (HIE, 1987). Either the study participant or their parent administered these questionnaires. As a result, the reliability of the data could come into question. The reasons for distorting answers to medical questions both consciously and subconsciously do not need to be detailed at this point. Suffice to say that there could be significant error between the answers found on the medical questionnaires and the actual medical
conditions of the participants.
In the Manning et al book, The Cost of Poor Health Habits, there was significant data manipulation done to arrive at the Table 6 estimates. The most obvious process whereby error should be factored in is in the derivation of the unit of analysis. In this study the unit is a single person. “For our analyses of HIE information, we collapsed multiple years of data for each individual into a single observation. We used the person as the unit of observation because the major determinants of the use of services are individuals rather than familial” (Manning et al, 1991). Each of the seven cost elements which make up the total net external cost are calculated on a per person basis. The level of confidence one has in this point estimate diminishes due to the fact that each cost is taken as an average of the sample and not estimated with any error considerations. The external medical costs are actually the averaged differences between smoker’s medical
The costs associated with work loss are calculated via predicted number of lost work days and average annual salary. Remembering that only individuals with family income not greater than $25,000 (1973 dollars) are included, it is obvious that there could be significant numbers of smokers not incorporated into the analysis. As a result, costs associated with lost work for higher income individuals may not factor into Viscusi’s estimates.
The life insurance externality is calculated only for group life insurance plans. Most individual insurance plans charge higher premiums for individuals who chose to smoke: thereby allowing smokers to internalize the insurance cost. This has not always been the case however for group plans. The group external cost found in Table 6 is calculated based on the average life insurance benefit per worker, collected from Bureau of Labor Statistics survey of employee benefits. Again by using average figures for such a significant cost element in the final calculation results in the potential for error. The confidence level in the final point estimate continues to decline as more averaged figures are incorporated into the calculation without consideration of the error term.
For the nursing home cost element average cost figures are again employed. This figure is derived from the average annual insurance-plus-government payment per
resident in a nursing home in 1984 dollars. There are distinct differences between nursing home facilities that translate into distinct cost differences. To take an average of those costs without considering the error term erodes the confidence level in the
calculation. For the pension calculation a similar methodology is used. Average pension benefits and other social welfare program amounts were taken from the March 1985 Current Population Survey (CPS). These statistics are then summed and averaged for each five-year-age-sex group.
The final cost element is taxes on earnings. For simplicity sake, the Manning et al study assumed that all of the previously discussed costs are solely financed by a constant percentage tax on earnings. Because information on habits such as smoking was not available in the CPS, Manning et al used education differences between smokers and individuals that never smoked to estimate the differences in their earnings. These figures are then averaged over the group.
At this point it is appropriate to reiterate that the purpose of this paper is not to discredit the methods by which data was collected in the HIE study or manipulated in the Manning et al study. Nor is this an attempt to suggest alternative data collection or estimation techniques. Instead, the potential for errors that result from the methods employed suggests including some error estimates in each of the calculations. By factoring in error potential and estimating these figures in ranges, specified by
probabilities, the confidence level of Viscusi’s final point estimate comes into question. The third element through which potential error appears to warrant examination is the hypothetical group in the Manning et al study, the “non-smoking smoker”. The issue raised by Manning et al is that previous studies on this subject attribute all differences in health conditions between smokers and non-smokers to cigarette smoking. They make that case that there are other significant characteristics of smokers and non-smokers that are not controlled for. Therefore, the previous studies have probably overestimated the impact of smoking. As previously mentioned, smokers are assumed to be less future oriented and therefore engage in other risky activities that could lead to adverse medical conditions. These habits include heavy drinking and lack of exercise. To account for these other characteristics, the Manning et al study controlled for the following when creating the “non-smoking smoker”: age, sex, race, education, drinking habits, exercise habits, family size, income, self-assessed measures of physical, mental, and general health, and seat-belt use. This “non-smoking smoker” group is believed to retain all of the characteristics of the smoker, without smoking (Manning et al, 1993). This attempt at evaluating smoking costs exclusive of other “habits” associated with a smoker is valid. However using a process such as this to create a hypothetical group so integral to the results of the study warrants some degree of sensitivity analysis. Again in this case, the confidence in the final number is reduced by not incorporating the potential for error into the analysis.
Finally, the issue of omitted variables in the original RAND data requires consideration as an area for potentially discrediting the cost estimates: specifically the
The HIE study does not include medical costs associated with the exposure to second-hand smoke and maternity costs.
While the impact of second-hand smoke is still a topic of debate, there appears to be evidence that exposure to second-hand smoke for long periods of time could be a factor in several poor health conditions. Maternity costs could impact the cost estimate because of mothers who continue to smoke during pregnancy. The extra costs of neonatal care resulting from smoking related conditions in newborns are significant. In fact, smokers’ likelihood of having low birth-weight babies is twice that of non-smokers (Manning et al, 1991).
As shown in the above analysis, there are significant areas throughout the development of the cost estimates that should include estimates of potential errors. In their absence, each of the seven cost elements will be evaluated with various standard deviations to test the robustness of Viscusi’s total net external costs per pack of cigarettes. No estimate is provided of an appropriate standard deviation for any of the cost elements, either from the Manning et al work or Viscusi’s paper. Hence this paper contains a test of the range of standard deviations and their impact on the net external cost figure. This shows that when different standard deviations are applied to the
estimates, there is the potential for a different result than the conclusion Viscusi reached. The following is a description of the process for this sensitivity analysis. First, each of the seven cost estimates was allowed to vary according to a normal probability distribution function. The normal distribution has been selected for simplicity’s sake, and for the ease in evaluating results from a variety of standard deviations. Using a Monte Carlo Simulation, random numbers for each of the seven cost estimates are
simultaneously generated within the normal distribution at specified standard deviations. As a random number is generated for each cost element the total net external cost figure is recalculated. In effect, a new “what-if” scenario for each randomly generated cost element is simulated.
1,000 simulations for each set of standard deviations are run and the resulting total external costs per pack in a percentile-ranking table are presented. From this an
evaluation can be made on both the range of potential values for this estimate, as well as the confidence level of Viscusi’s point estimate. At that point the ability of his
conclusions to stand up to a reasonable level of potential error is determined.
Each simulation is run with an Excel Add-In program called Crystal Ball. This program expands the capabilities of a spreadsheet by allowing for the simultaneous change of multiple variables. In fact, it allows a forecast based on numerous assumptions in a dynamic environment to be evaluated. Consider Table 2 again. Each of the seven cost elements will now be varied according to several assumed standard deviations and deviate accordingly from Viscusi’s bottom line figure of -$1.57.
Four standard deviations have been used in this analysis: 10%, 15%, 20%, 25% (detailed statistics on the distribution of each cost element along the normal distribution and summary statistics of each simulation are located in the Appendix). The standard deviation therefore is applied proportionately the same to each cost element. The first simulation is run with a standard deviation of 0.1. At that level of standard deviation for each of the seven cost elements, the model generated the following frequency distribution chart with total net external cost per pack on the X-axis:
Frequency Chart .000 .008 .016 .023 .031 0 7.75 15.5 23.25 31 -2.25 -1.88 -1.50 -1.13 -0.75 1,000 Trials 3 Outliers
These results are displayed in a percentile ranking as shown below:
Forecast: Total net costs per pack
Percentile Value (Dollars)
0% -0.84 10% -1.26 20% -1.38 30% -1.46 40% -1.52 50% -1.59 60% -1.65 70% -1.72 80% -1.79 90% -1.89 100% -2.30
At the 10% standard deviation applied for this simulation, there is approximately a 45% probability that actual net external cost is less than –$1.57. In the language of external costs and benefits of smoking, this simulation suggests a roughly 45% probability that the net external savings to society from smokers are actually less than Viscusi estimates in his paper. This conclusion is supported through the earlier
identification of potential areas of error in the data collection and estimation of the total external costs, and the application of a 10% standard deviation to the cost elements along a normal probability distribution. Also of interest in the percentile ranking of total external costs is the range of possible values. By simply allowing the potentially suspect point estimates of each cost element to vary according to a small standard deviation there are a range of potential total external costs savings between -$.84 and -$2.30.
Using the 15% standard deviation the model generates the following frequency distribution chart and percentile ranking:
Forecast: Total net costs per pack
Percentile Value (Dollars)
0% -0.47 10% -1.1 20% -1.28 30% -1.4 40% -1.5 50% -1.6 60% -1.69 70% -1.79 80% -1.89 90% -2.05 100% -2.66
As the standard deviation is increased for each cost element, the resulting range of values for the total external cost increases. This time the range of costs per pack amounts to $2.19. The final two simulations applied standard deviations of 20% and 25% respectively.
Forecast: Total net costs per pack
Percentile Value (Dollars)
0% -0.11 10% -0.94 20% -1.18 30% -1.35 40% -1.47 50% -1.61 60% -1.72 Frequency Chart .000 .008 .016 .024 .032 0 8 16 24 32 -2.75 -2.19 -1.63 -1.06 -0.50 1,000 Trials 1 Outlier
Forecast: Total net costs per pack
Frequency Chart .000 .008 .016 .024 .032 0 8 16 24 32 -3.00 -2.31 -1.63 -0.94 -0.25 1,000 Trials 5 Outliers
At the 20% standard deviation the probability is just above 45%that the potential
“external financial savings” society would enjoy from smokers is less than the -$1.57 per pack that Viscusi estimates. Ideally, appropriate standard deviations would be calculated from direct examination of the originating data. In this case, it would be the RAND costs collected during the HIE. This would allow the model to run simulations with the
derived standard deviations to estimate the total external costs per pack.
The final Monte Carlo Simulation results are presented below for the 25% standard deviation:
Forecast: Total net costs per pack
Percentile Value (Dollars)
0% 0.26 10% -0.78 20% -1.09 30% -1.29 40% -1.45 50% -1.62 60% -1.76 70% -1.94 80% -2.11 90% -2.38 100% -3.39
In this percentile rank, the range of potential costs per pack actually includes positive values. The positive values justify some level of taxation on cigarettes because it represents the actual external costs to society imposed by smokers. The positive values are admittedly at a low level of probability in the above table. However considering the error potential identified through the course of this paper, the 0.25 standard deviation applied to the cost elements may be conservative. Any higher standard deviation will generate successively lower levels of confidence in Viscusi’s results.
Frequency Chart .000 .007 .014 .020 .027 0 6.75 13.5 20.25 27 -3.50 -2.63 -1.75 -0.88 0.00 1,000 Trials 2 Outliers
The focus of the analysis to this point has been to examine the impact of errors on
Viscusi’s estimates of the cost elements. In addition to the already discussed potential for error in the data collection techniques and estimates, the major component of financial savings is composed of the retirement pension element. Viscusi’s estimate of a financial saving of $2.66 per pack is contingent upon Manning et al’s estimate of the reduction in life expectancy of 4.30 years. This estimate is the difference between the life expectancy of a smoker and that of the hypothetical nonsmoking-smoker. How robust is this
estimate in the reduction of life expectancy? At what level of reduced life expectancy does Viscusi’s estimate fall apart? Considering that the retirement savings per pack estimate is the crucial element in Viscusi’s case, an analysis of the reduction in life expectancy is warranted.
By simply multiplying Viscusi’s retirement savings per pack by the number of packs smoked, given as 16,300, the 4.30 years in life expectancy reduction translates into $43,358 in financial savings to society per smoker. This returns an estimated saving of $10,083 per year over the 4.30 years. Using the same model as when forecasting the impact of standard deviations on the cost elements, the life expectancy reduction estimate is forecast according to the normal probability distribution. By setting the minimum reduction in life expectancy at 0 and the maximum at the 4.30 used by Viscusi, and allowing the actual reduction to vary, the model generates the following table:
Forecast: Savings per Pack Percentile Retirement Savings
per pack (Dollars)
0% -0.03 10% -0.54 20% -0.85 30% -1.04 40% -1.21 50% -1.33 60% -1.48
Above, the estimates for retirement savings per pack range from $.03 to $2.66. As is intuitively obvious, as long as there is some measurable reduction in life expectancy from smoking, there will be some degree of retirement savings to society. However, when the total net cost per pack is forecasted along with the differences in life expectancy, the impact of the change in years becomes more apparent. Consider the following table in which the range of total net external costs per pack is included as well:
Percentile Retirement Savings per pack (Dollars)
Total net external cost per pack (Dollars)
0% -0.03 1.06 10% -0.54 0.55 20% -0.85 0.24 30% -1.04 0.05 40% -1.21 -0.12 50% -1.33 -0.24 60% -1.48 -0.39 70% -1.64 -0.55 80% -1.82 -0.73 90% -2.06 -0.97 100% -2.63 -1.54
When the reduction in life expectancy drops from 4.30 years to 1.68 years, the total net external costs from smoking become positive; approximately 35% level of confidence above. In other words, there is no longer a net savings to society from smoking, due to a significant savings in retirement pensions. The model estimates that there is
approximately a 35% level of confidence that the reduction in life expectancy will be small enough to cause Viscusi’s total net “savings” per pack to become a net cost.
Section V: Conclusions and Recommendations
By allowing the potential for error to factor into the cost estimates of external costs per pack, Viscusi’s point estimate of -$1.57 becomes questionable. Significant potential for error exists in the data collection, manipulation and calculation process
leading up to Viscusi’s results. The level of confidence surrounding his estimates would be greater if an attempt to assess measurement error had been factored into his
calculations. As displayed above, when a range of standard deviations is applied to the cost elements according to a normal probability distribution, there exists a range of values for total net external costs per pack. In the presence of potential error in Viscusi’s
analysis, using a point estimate for total external costs likely overlooks significant variation in the actual external costs.
References
Viscusi, Kip. W. (1995). “Cigarette Taxation and the Social Consequences of Smoking.”
Tax Policy and the Economy. Vol. 9. Washington DC: National Bureau of Economic
Research
Miller, Matthew. (1997). “Blowing smoke at debate over tobacco’s true cost.” Wall Street
Journal, July 11, 1997.
Van Doren, Peter (1998). Snuffing the Facts About Smokers (Commentary). The Cato Institute.
Manning, W.G., E.B. Keeler, J.P. Newhouse, E.M. Sloss, and J. Wasserman (1989). “The Costs of Poor Health Habits. Cambridge: Harvard University Press.
Tobacco Institute (1993). The Tax Burden on Tobacco: Historical Compilation 1993, Vol. 28. Washington, DC: Tobacco Institute.
U.S. Department of Commerce (1996). Statistical Abstract of the United States, 1996. Washington DC: U.S. Department of Commerce.
Taylor, d’Arc C., S.M. Polich, C.E. Peterson, E.M. Sloss (1987). Health Insurance
Works Consulted
Barro, Robert J. (1994). “Send Regulations Up in Smoke.” Wall Street Journal, June 3, 1994.
Centers for Disease Control and Prevention, U.S. Department of Health and Human Services (1989). Smoking, Tobacco and Health: A fact book.
U.S. Department of Health and Human Sercices (May 20, 1994). “Cigarette Smoking Among Adults-United States, 1992, and Changes in the Definition of Current Cigarette Smoking.” Morbidity and Mortality Weekly Report.
Viscusi, W.K. (1992b). Smoking: Making the Risky Decision. New York: Oxford University Press.
Appendix
˝
Crystal Ball Report
Simulation started on 4/18/99 at 13:19:57 Simulation stopped on 4/18/99 at 13:20:13 Forecast: Total net costs per pack
Cell: O22 Summary:
Display Range is from -2.25 to -0.75 Entire Range is from -2.30 to -0.84
"After 1,000 Trials, the Std. Error of the Mean is 0.01"
Statistics: Value Trials 1000 Mean -1.58 Median -1.59 Mode ---Standard Deviation 0.24 Variance 0.06 Skewness 0.07 Kurtosis 2.81 Coeff. of Variability -0.15 Range Minimum -2.30 Range Maximum -0.84 Range Width 1.46 Mean Std. Error 0.01
Forecast: Total net costs per pack (cont'd) Cell: O22 Frequency Chart .000 .008 .016 .023 .031 0 7.75 15.5 23.25 31 -2.25 -1.88 -1.50 -1.13 -0.75 1,000 Trials 3 Outliers
20% -1.79 30% -1.72 40% -1.65 50% -1.59 60% -1.52 70% -1.46 80% -1.38 90% -1.26 100% -0.84 End of Forecast Assumptions
Assumption: Medical care Cell: O12
Normal distribution with parameters:
Mean 0.66
Standard Dev. 0.10
Selected range is from -Infinity to +Infinity Mean value in simulation was 0.66
Assumption: Group life insurance Cell: O14
Normal distribution with parameters:
Mean 0.22
Standard Dev. 0.10
Selected range is from -Infinity to +Infinity Mean value in simulation was 0.22
Assumption: Nursing home care Cell: O15
Normal distribution with parameters:
Mean -0.58
Standard Dev. 0.10
Selected range is from -Infinity to +Infinity Mean value in simulation was -0.58
0 .3 6 0 .5 1 0 .6 6 0 .8 1 0 .9 6
M e dic a l c a r e
-0 .0 8 0 .0 7 0 .2 2 0 .3 7 0 .5 2
Gr oup life ins ur a nc e
-0 .8 8 -0 .7 3 -0 .5 8 -0 .4 3 -0 .2 8
Assumption: Retirement pension Cell: O16
Normal distribution with parameters:
Mean -2.66
Standard Dev. 0.10
Selected range is from -Infinity to +Infinity Mean value in simulation was -2.67
Assumption: Fires Cell: O17
Normal distribution with parameters:
Mean 0.01
Standard Dev. 0.10
Selected range is from -Infinity to +Infinity Mean value in simulation was 0.02
Assumption: Taxes on earnings Cell: O19
Normal distribution with parameters:
Mean 0.77
Standard Dev. 0.10
Selected range is from -Infinity to +Infinity Mean value in simulation was 0.77
End of Assumptions -2 .9 6 -2 .8 1 -2 .6 6 -2 .5 1 -2 .3 6 R e tir e m e nt pe ns ion -0 .2 9 -0 .1 4 0 .0 1 0 .1 6 0 .3 1 Fir e s 0 .4 7 0 .6 2 0 .7 7 0 .9 2 1 .0 7 Ta x e s on e a r nings
Crystal Ball Report
Simulation started on 4/18/99 at 13:23:58 Simulation stopped on 4/18/99 at 13:24:13 Forecast: Total net costs per pack
Cell: O22 Summary:
Display Range is from -2.75 to -0.50 Entire Range is from -2.66 to -0.47
"After 1,000 Trials, the Std. Error of the Mean is 0.01"
Statistics: Value Trials 1000 Mean -1.59 Median -1.60 Mode ---Standard Deviation 0.36 Variance 0.13 Skewness 0.07 Kurtosis 2.81 Coeff. of Variability -0.23 Range Minimum -2.66 Range Maximum -0.47 Range Width 2.19 Mean Std. Error 0.01
Forecast: Total net costs per pack (cont'd) Cell: O22 Percentiles: Percentile Value 0% -2.66 10% -2.05 20% -1.89 30% -1.79 Frequency Chart .000 .008 .016 .024 .032 0 8 16 24 32 -2.75 -2.19 -1.63 -1.06 -0.50 1,000 Trials 1 Outlier
40% -1.69 50% -1.60 60% -1.50 70% -1.40 80% -1.28 90% -1.10 100% -0.47 End of Forecast Assumptions
Assumption: Medical care Cell: O12
Normal distribution with parameters:
Mean 0.66
Standard Dev. 0.15
Selected range is from -Infinity to +Infinity Mean value in simulation was 0.66
Assumption: Group life insurance Cell: O14
Normal distribution with parameters:
Mean 0.22
Standard Dev. 0.15
Selected range is from -Infinity to +Infinity Mean value in simulation was 0.22
Assumption: Nursing home care Cell: O15
Normal distribution with parameters:
Mean -0.58
Standard Dev. 0.15
Selected range is from -Infinity to +Infinity
0 .2 1 0 .4 4 0 .6 6 0 .8 9 1 .1 1
M e dic a l c a r e
-0 .2 3 -0 .0 0 0 .2 2 0 .4 5 0 .6 7
Gr oup life ins ur a nc e
-1 .0 3 -0 .8 1 -0 .5 8 -0 .3 6 -0 .1 3
Normal distribution with parameters:
Mean -2.66
Standard Dev. 0.15
Selected range is from -Infinity to +Infinity Mean value in simulation was -2.67
Assumption: Fires Cell: O17
Normal distribution with parameters:
Mean 0.01
Standard Dev. 0.15
Selected range is from -Infinity to +Infinity Mean value in simulation was 0.02
Assumption: Taxes on earnings Cell: O19
Normal distribution with parameters:
Mean 0.77
Standard Dev. 0.15
Selected range is from -Infinity to +Infinity Mean value in simulation was 0.77
End of Assumptions -3 .1 1 -2 .8 9 -2 .6 6 -2 .4 4 -2 .2 1 R e tir e m e nt pe ns ion -0 .4 4 -0 .2 1 0 .0 1 0 .2 4 0 .4 6 Fir e s 0 .3 2 0 .5 5 0 .7 7 1 .0 0 1 .2 2 Ta x e s on e a r nings
Crystal Ball Report
Simulation started on 4/18/99 at 13:25:44 Simulation stopped on 4/18/99 at 13:26:00 Forecast: Total net costs per pack
Cell: O22 Summary:
Display Range is from -3.00 to -0.25 Entire Range is from -3.03 to -0.11
"After 1,000 Trials, the Std. Error of the Mean is 0.02"
Statistics: Value Trials 1000 Mean -1.60 Median -1.61 Mode ---Standard Deviation 0.48 Variance 0.23 Skewness 0.07 Kurtosis 2.81 Coeff. of Variability -0.30 Range Minimum -3.03 Range Maximum -0.11 Range Width 2.92 Mean Std. Error 0.02
Forecast: Total net costs per pack (cont'd) Cell: O22 Percentiles: Frequency Chart .000 .008 .016 .024 .032 0 8 16 24 32 -3.00 -2.31 -1.63 -0.94 -0.25 1,000 Trials 5 Outliers
40% -1.72 50% -1.61 60% -1.47 70% -1.35 80% -1.18 90% -0.94 100% -0.11 End of Forecast Assumptions
Assumption: Medical care Cell: O12
Normal distribution with parameters:
Mean 0.66
Standard Dev. 0.20
Selected range is from -Infinity to +Infinity Mean value in simulation was 0.66
Assumption: Group life insurance Cell: O14
Normal distribution with parameters:
Mean 0.22
Standard Dev. 0.20
Selected range is from -Infinity to +Infinity Mean value in simulation was 0.21
Assumption: Nursing home care Cell: O15
Normal distribution with parameters:
Mean -0.58
Standard Dev. 0.20
Selected range is from -Infinity to +Infinity Mean value in simulation was -0.58
Assumption: Retirement pension Cell: O16
0 .0 6 0 .3 6 0 .6 6 0 .9 6 1 .2 6
M e dic a l c a r e
-0 .3 8 -0 .0 8 0 .2 2 0 .5 2 0 .8 2
Gr oup life ins ur a nc e
-1 .1 8 -0 .8 8 -0 .5 8 -0 .2 8 0 .0 2
Normal distribution with parameters:
Mean -2.66
Standard Dev. 0.20
Selected range is from -Infinity to +Infinity Mean value in simulation was -2.68
Assumption: Fires Cell: O17
Normal distribution with parameters:
Mean 0.01
Standard Dev. 0.20
Selected range is from -Infinity to +Infinity Mean value in simulation was 0.02
Assumption: Taxes on earnings Cell: O19
Normal distribution with parameters:
Mean 0.77
Standard Dev. 0.20
Selected range is from -Infinity to +Infinity Mean value in simulation was 0.77
End of Assumptions -3 .2 6 -2 .9 6 -2 .6 6 -2 .3 6 -2 .0 6 R e tir e m e nt pe ns ion -0 .5 9 -0 .2 9 0 .0 1 0 .3 1 0 .6 1 Fir e s 0 .1 7 0 .4 7 0 .7 7 1 .0 7 1 .3 7 Ta x e s on e a r nings
Crystal Ball Report
Simulation started on 4/18/99 at 13:27:07 Simulation stopped on 4/18/99 at 13:27:23 Forecast: Total net costs per pack
Cell: O22 Summary:
Display Range is from -3.50 to 0.00 Entire Range is from -3.39 to 0.26
"After 1,000 Trials, the Std. Error of the Mean is 0.02"
Statistics: Value Trials 1000 Mean -1.60 Median -1.62 Mode ---Standard Deviation 0.61 Variance 0.37 Skewness 0.07 Kurtosis 2.81 Coeff. of Variability -0.38 Range Minimum -3.39 Range Maximum 0.26 Range Width 3.65 Mean Std. Error 0.02
Forecast: Total net costs per pack (cont'd) Cell: O22 Percentiles: Percentile Value 0% -3.39 10% -2.38 20% -2.11 30% -1.94 Frequency Chart .000 .007 .014 .020 .027 0 6.75 13.5 20.25 27 -3.50 -2.63 -1.75 -0.88 0.00 1,000 Trials 2 Outliers
40% -1.76 50% -1.62 60% -1.45 70% -1.29 80% -1.09 90% -0.78 100% 0.26 End of Forecast Assumptions
Assumption: Medical care Cell: O12
Normal distribution with parameters:
Mean 0.66
Standard Dev. 0.25
Selected range is from -Infinity to +Infinity Mean value in simulation was 0.66
Assumption: Group life insurance Cell: O14
Normal distribution with parameters:
Mean 0.22
Standard Dev. 0.25
Selected range is from -Infinity to +Infinity Mean value in simulation was 0.21
Assumption: Nursing home care Cell: O15
Normal distribution with parameters:
Mean -0.58
Standard Dev. 0.25
Selected range is from -Infinity to +Infinity
-0 .0 9 0 .2 9 0 .6 6 1 .0 4 1 .4 1
M e dic a l c a r e
-0 .5 3 -0 .1 5 0 .2 2 0 .6 0 0 .9 7
Gr oup life ins ur a nc e
-1 .3 3 -0 .9 6 -0 .5 8 -0 .2 1 0 .1 7
Normal distribution with parameters:
Mean -2.66
Standard Dev. 0.25
Selected range is from -Infinity to +Infinity Mean value in simulation was -2.68
Assumption: Fires Cell: O17
Normal distribution with parameters:
Mean 0.01
Standard Dev. 0.25
Selected range is from -Infinity to +Infinity Mean value in simulation was 0.02
Assumption: Taxes on earnings Cell: O19
Normal distribution with parameters:
Mean 0.77
Standard Dev. 0.25
Selected range is from -Infinity to +Infinity Mean value in simulation was 0.76
End of Assumptions -3 .4 1 -3 .0 4 -2 .6 6 -2 .2 9 -1 .9 1 R e tir e m e nt pe ns ion -0 .7 4 -0 .3 6 0 .0 1 0 .3 9 0 .7 6 Fir e s 0 .0 2 0 .4 0 0 .7 7 1 .1 5 1 .5 2 Ta x e s on e a r nings
Crystal Ball Report
Simulation started on 3/24/99 at 18:33:28 Simulation stopped on 3/24/99 at 18:34:03 Forecast: Savings per Pack
Cell: AH13 Summary:
Display Range is from -2.75 to 0.00 Entire Range is from -2.63 to -0.03
"After 1,000 Trials, the Std. Error of the Mean is 0.02"
Statistics: Value Trials 1000 Mean -1.33 Median -1.33 Mode ---Standard Deviation 0.55 Variance 0.31 Skewness 0.08 Kurtosis 2.40 Coeff. of Variability -0.42 Range Minimum -2.63 Range Maximum -0.03 Range Width 2.59 Mean Std. Error 0.02
Forecast: Savings per Pack (cont'd) Cell: AH13 Percentiles: Frequency Chart .000 .007 .013 .020 .026 0 6.5 13 19.5 26 -2.75 -2.06 -1.38 -0.69 0.00 1,000 Trials 0 Outliers
40% -1.48 50% -1.33 60% -1.21 70% -1.04 80% -0.85 90% -0.54 100% -0.03 End of Forecast Assumptions
Assumption: AH11 Cell:
AH11
Triangular distribution with parameters:
Minimum -4.30
Likeliest -2.15
Maximum 0.00
Selected range is from -4.30 to 0.00 Mean value in simulation was -2.15
End of Assumptions
-4 .3 0 -3 .2 3 -2 .1 5 -1 .0 8 0 .0 0
Christopher J. Ensign was born on February 3, 1973 in Red Bank NJ. After graduating from Middletown High School South in Middletown NJ in 1991, he received a BA in Economics from Mary Washington College, Fredericksburg VA in 1995.
In May of 1995 he was employed as a Cost Analyst for Technology, Management and Analysis Corporation, Crystal City, VA. At the time of submitting his thesis in May of 1999, Mr. Ensign was the Financial Analyst for The Personal Communications Industry Association. He received his MA in Economics from Virginia Polytechnic Institute and State University in May of 1999.