University of South Florida
Scholar Commons
Graduate Theses and Dissertations Graduate School
January 2013
Value-Added and Observational Measures Used in
the Teacher Evaluation Process: A Validation Study
Claudia GüerereUniversity of South Florida, [email protected]
Follow this and additional works at:http://scholarcommons.usf.edu/etd Part of theEducational Assessment, Evaluation, and Research Commons
This Dissertation is brought to you for free and open access by the Graduate School at Scholar Commons. It has been accepted for inclusion in Scholar Commons Citation
Güerere, Claudia, "Value-Added and Observational Measures Used in the Teacher Evaluation Process: A Validation Study" (2013). Graduate Theses and Dissertations.
Value-Added and Observational Measures Used in the Teacher Evaluation Process: A Validation Study
by
Claudia Güerere
A dissertation submitted in partial fulfillment of the requirements for the degree of
Doctor of Philosophy
Department of Educational Measurement and Research College of Education
University of South Florida
Major Professor: Robert F. Dedrick, Ph.D. Jeffrey D. Kromrey, Ph.D.
Liliana Rodríguez-Campos, Ph.D. Waynne B. James, Ed.D.
Date of Approval: May 28, 2013
Keywords: Validity, Educational Accountability, Value-Added Scores, Structural Equation Modeling, Teaching Quality, Teaching Effectiveness
Dedication A mi mami y mi papi.
Por haberme apoyado en todo momento, por sus consejos, sus valores, por la
motivaciónconstante que me ha permitido convertirme en quien soy hoy dia. En gran parte gracias a ustedes, hoy puedo ver alcanzada mi meta, ya que siempre estuvieron impulsándome en los momentos más difíciles. Gracias por haber fomentado en mí el deseo de superación, aprendizaje y el anhelo de triunfo en la vida. Mil palabras no bastarían para agradecerles su apoyo, su comprensión y mas que todo, su amor.
For my mom and my dad.
For supporting me at all times, for your advice, your values, and the constant motivation that have allowed me to become who I am today. Largely thanks to you, my goals and dreams are coming to fruition, as you were always pushing me in the most difficult moments. Thank you for having encouraged in me the desire for self-improvement, learning and the desire to achieve in life. One thousand words would not be enough to thank you for your support, understanding and most of all, your love.
Acknowledgments
I thank my professors throughout my educational career and my committee members for taking the time to mentor me, guide me, and understand me. I especially thank Dr. Dedrick for fermenting in me the love for measurement and testing, Dr. Rodríguez-Campos for her solid advice and unwavering support, Dr. Kromrey for providing me calmness and laughter, and Dr. James for making me take that statistics class I did not want to take. I thank all four of you for believing in me. For your patience and dedication to my project I am forever indebted.
To all those who sat next to me while I worked:
Long hours seemed short with you by my side.
To all those who listened, supported and encouraged: Thank you.
Table of Contents
List of Tables ... iv
List of Figures ... vii
List of Equations ... viii
Abstract ... ix
Chapter One: Introduction ... 1
Problem Statement ... 7
Purpose of the Study ... 8
Research Questions ... 9
Significance of the Study ... 10
Limitations of the Study... 10
Definition of Terms... 11
Chapter Two: Literature Review ... 13
Teacher Quality ... 13
Quality/Effectiveness ... 14
Research on quality teachers. ... 15
Teacher education. ... 15
Teacher salary. ... 15
Years of experience... 16
Personal characteristics ... 17
National Board Certification ... 18
Value-Added Modeling ... 19
History... 20
Different Types. ... 22
Advantages. ... 24
Disadvantages. ... 24
Florida value-added model. ... 27
FCAT. ... 27
Development of the model. ... 28
Observational Methods ... 32
Measurement Issues ... 36
Summary ... 39
Chapter Three: Methods ... 41
Participants and Setting... 41
Value-Added Model (VAM) Scores ... 42
The Observational Rubric ... 46
Teacher Quality and Effectiveness Variables ... 49
Design ... 51
Research question one... 54
Dimensionality of the observational rubric... 55
Internal consistency reliability of the observational rubric... 58
Research question two. ... 60
Research question three. ... 65
Summary ... 71
Chapter Four: Results ... 72
Data Source ... 73
Research Question One ... 73
Fit of the five-factor model. ... 74
Reliability of the observational rubric. ... 87
Research Question Two ... 89
Correlations between VAM scores with the standard error applied and observational measures by school. ... 104
Correlations between VAM scores without the standard error applied and observational measures by school. ... 105
Research Question Three ... 107
Observational rubric scores with predictor variables. ... 111
VAM scores with predictor variables. ... 116
Chapter Five: Discussion ... 118
Summary of the Study ... 118
Discussion of the Results ... 120
Question One. ... 120
Question Two. ... 125
Question Three. ... 131
Conclusion ... 134
Implications of the Study ... 135
Recommendations for Future Research ... 136
Closing Remarks ... 140
References ... 142
Appendices ... 156
Appendix A. Florida Course Codes Used in the Value-Added Model ... 157 Table 1. Course Codes Used in the Mathematics Value-Added
Table 2. Course Codes Used in the Reading Value-Added Model ... 158 Appendix B. Description of the Covariates in the Value-Added Model ... 159 Appendix C. Correlations By School With Each of the Factors Underlying
List of Tables
Table 1 List of Covariates in Florida Value-Added Formula ...7 Table 2 Relevant Standards for Instrument Development and Interpretation of
Scores ...38 Table 3 Demographics for Teachers in the District, Separated by Types of Scores ...43 Table 4 Examples of Indicators Used in the Teacher Observational Rubric ...48 Table 5 Cronbach Alpha Values for the Pilot Administration by Construct
(2010-11 School Year) ...50 Table 6 Teacher Variables Used for Validity Evidence ...52 Table 7 Timeline for Variable Collection ...53 Table 8 Descriptive Statistics for Items From the Observational Rubric for All
Teachers With a Score in the District ...75 Table 9 Descriptive Statistics for Items From the Observational Rubric for All
Teachers With a Score in the District who Also Received a VAM Score
From the State ...76 Table 10 Confirmatory Factor Analysis: Fit Indices for the Five-Factor Model
Underlying Administrators‟ Observational Ratings of Teachers for Sample With Only Observational Scores and Sample of Teachers With
Observational Score and VAM Scores ...81 Table 11 Confirmatory Factor Analysis: Unstandardized Factor Loadings,
Residual Variances and R2 for the Five-Factor Model Underlying
Administrators‟ Observational Ratings of Teachers ...82 Table 12 Factor Variances/Covariance and Correlations for the Five-Factor Model
Underlying Administrators‟ Observational Ratings of Teachers for all
Teachers With Observational Rubric Scores ...84 Table 13 Factor Variances/Covariance and Correlations for the Five-Factor Model
Underlying Administrators‟ Observational Ratings of Teachers for Sample
Table 14 Confirmatory Factor Analysis: Fit Indices for the Five-Factor Model Underlying Administrators‟ Observational Ratings of Teachers for Sample With Only Observational Scores and Sample of Teachers With
Observational Score and VAM Scores With Correlated Errors for Items
I12H and I12I ...86 Table 15 Second-Order Confirmatory Factor Analysis: Fit Indices for the Total
and the Five-Factor Model Underlying Administrators‟ Observational Ratings of Teachers for Sample With Only Observational Scores and Sample of Teachers With Observational Score and VAM Scores With
Correlated Errors for Items I12H and I12I ...86 Table 16 Second-Order Confirmatory Factor Analysis: Unstandardized Factor
Loadings, Residual Variances and R2 for the Total Score of
Administrators‟ Observational Ratings of Teachers ...88 Table 17 Summary of all Cronbach Alphas by Scales and Total for the
Observational Rubric Completed by Administrators by Sample of All Teachers in the District as Well as Teachers With a Score on the
Observational Rubric and a VAM Score From the State ...89 Table 18 Descriptive Statistics for the Two Types of VAM Scores Used ...90 Table 19 Fit Indices for the Model: Observational Rubric With VAM Scores With
and Without Standard Error (SE) ...94 Table 20 Correlations for the Five Factors Underlying the Administrators‟
Observational Ratings of Teachers and VAM Scores With and Without SE
Applied ...95 Table 21 Correlations for the Five Factors Underlying the Administrators‟
Observational Ratings of Teachers and VAM Scores With and Without SE
Applied by School Level ...96 Table 22 Correlations for the Five Factors Underlying the Administrators‟
Observational Ratings of Teachers and VAM Scores With SE Applied as
the Lower end of the Confidence Band ...98 Table 23 Fit Indices for the Second-Order Model: Total Score for the
Observational Rubric With VAM Scores With and Without SE ...98 Table 24 Maximum and Minimum Correlations for VAM and Observational
Scores ...100 Table 25 Number and Percentage of Schools With Strong Positive or Negative
Table 26 Descriptive Statistics for Item Characteristics Used in This Study ...109 Table 27 Fit Indices for Predictor Variables for the Observational Rubric ...110 Table 28 Standardized Factor Loadings for the Model With the Observational
Rubric ...112 Table 29 Standardized Regression Coefficients (Beta) for the Predictor Variables
of the Observational Rubric Factors ...113 Table 30 Fit Indices for the Second-Order Model with Predictors of the Total
Score for the Observational Rubric ...115 Table 31 Standardized Regression Coefficients for the Predictor Variables of the
Total Score from the Observational Rubric ...116 Table 32 Standardized Regression Coefficients for the Model With the VAM
List of Figures
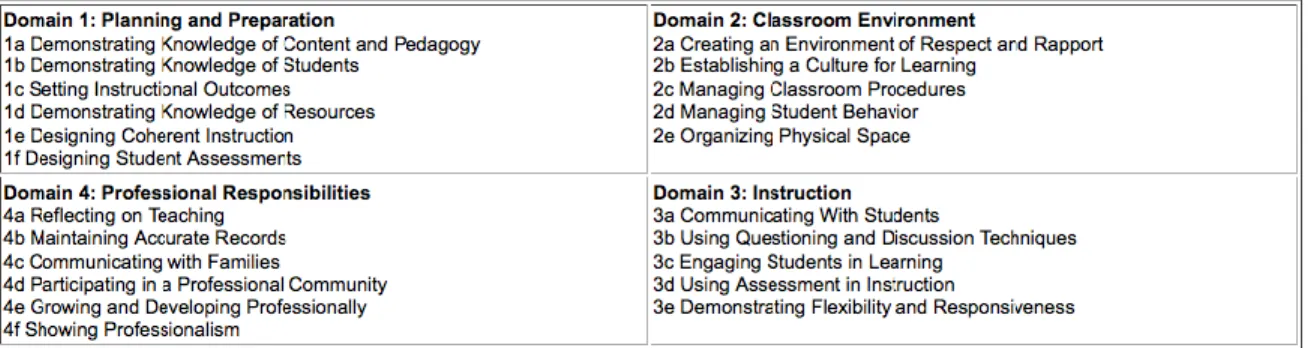
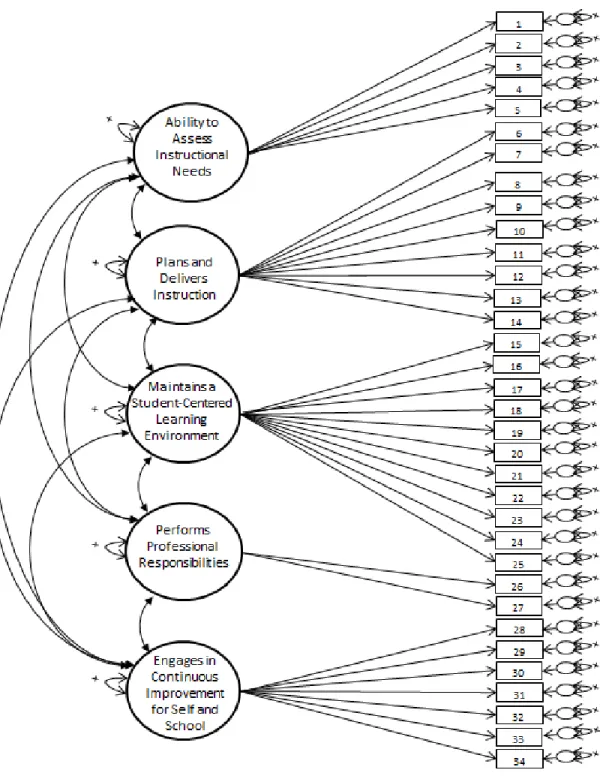
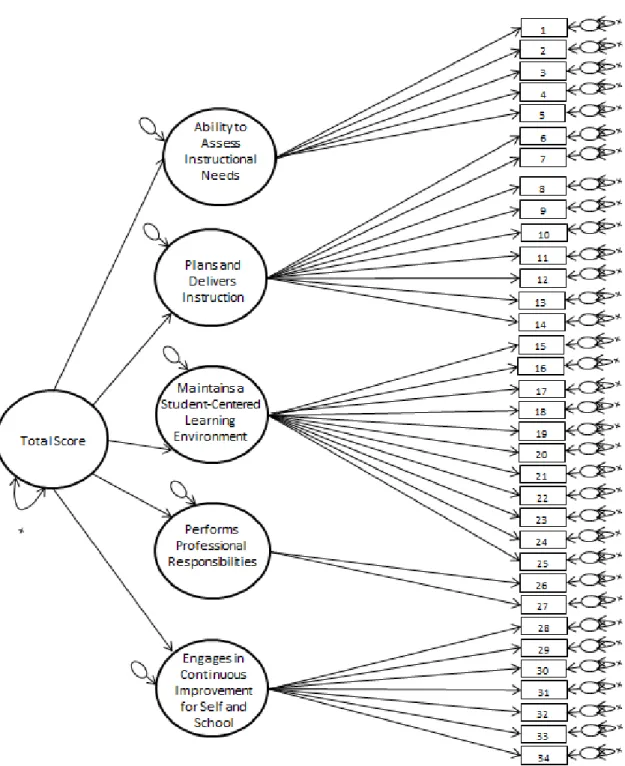
Figure 1. Danielson Framework for teaching (n.d.). ...36 Figure 2. Factor model of the observational evaluation instrument. ...57 Figure 3. Second-order factor model of the observational evaluation instrument. ...59 Figure 4. Relationship between VAM scores and the subscale scores from the
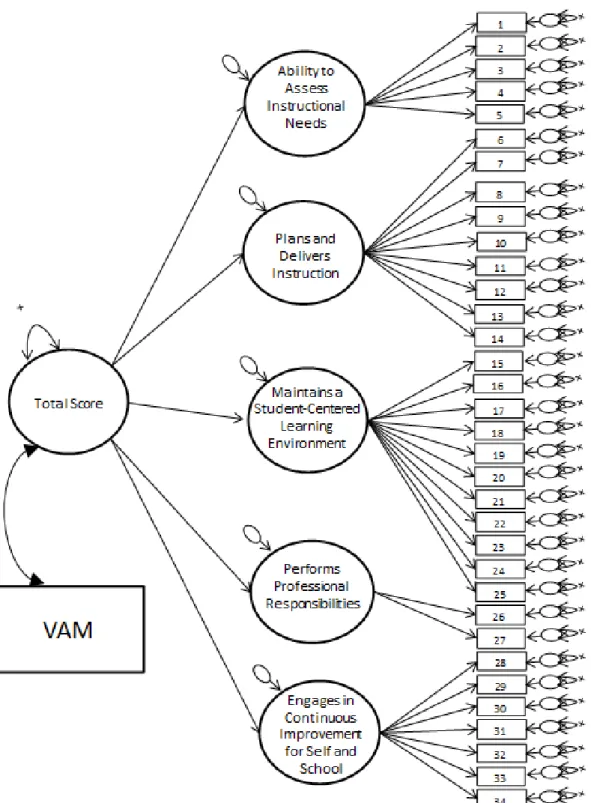
observational rubric (all factors are correlated with each other). ...63 Figure 5. Relationship between VAM scores and the second-order scores from
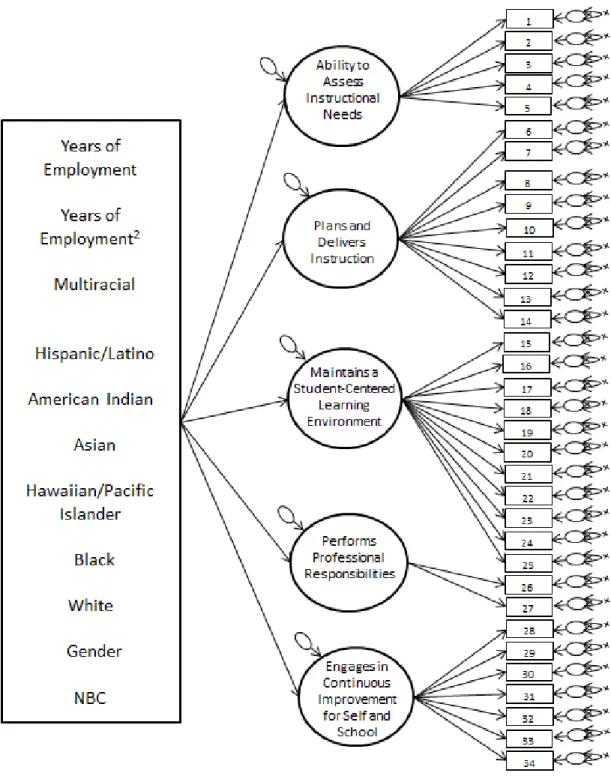
the observational rubric...64 Figure 6. Relationship between predictor variables and the observational rubric
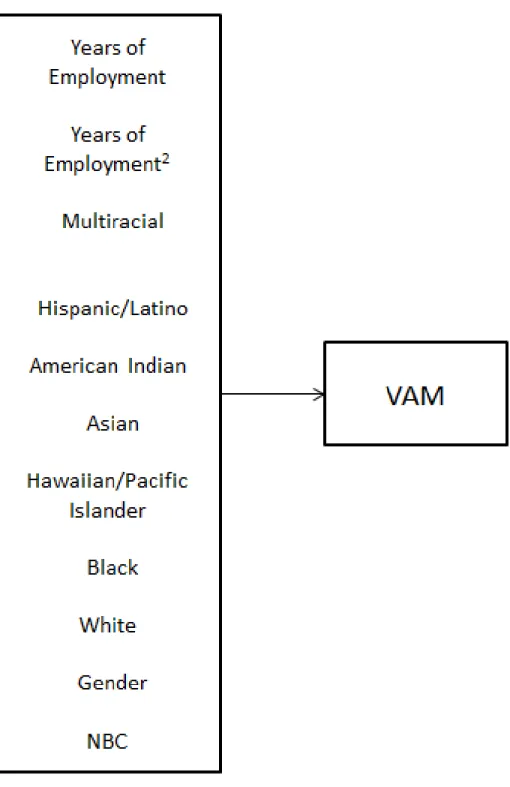
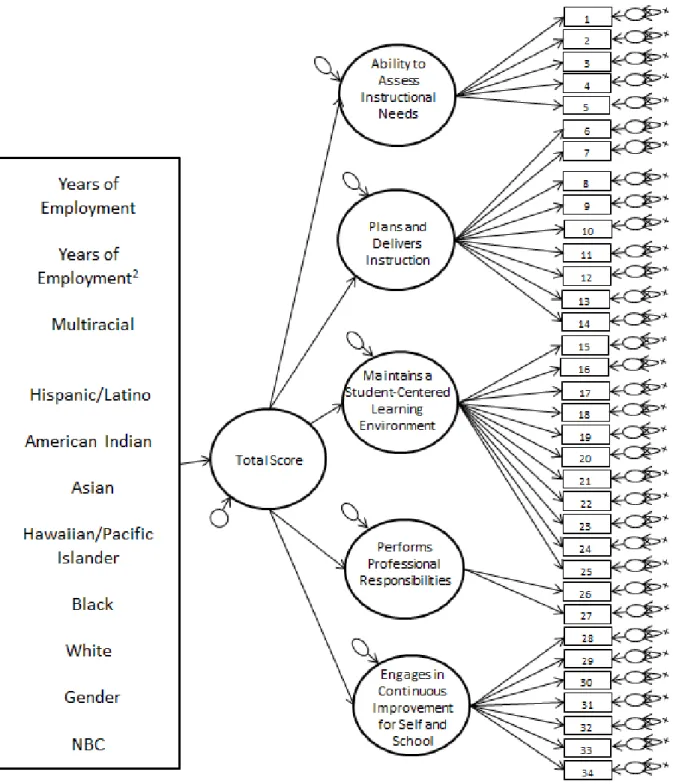
scores (all factors are correlated with each other). ...68 Figure 7. Relationship between predictor variables and VAM scores...69 Figure 8. Relationship between predictor variables and the second-order total
score of the observational rubric scores. ...70 Figure 9. Box and whisker plots for the five subscale scores of the observational
rubric (N=6441).. ...78 Figure 10. Box and whisker plots for the five subscale scores of the observational
rubric (N=2385).. ...80 Figure 11. Histogram of VAM scores with standard error applied. ...91 Figure 12. Histogram of VAM scores without standard error applied. ...92 Figure 13. Scatterplot of VAM scores with total score on the administrative
review. ...99 Figure 14. Stem-and-leaf plot of correlations between observational scores and
VAM scores without the standard error applied by school. ...101 Figure 15. Stem-and-leaf plot of correlations between observational scores and
List of Equations
- - (1) ... 29
(2) ... 30
Teacher Value-Added Score (3).. ... 44
Abstract
Scores from value-added models (VAMs), as used for educational accountability, represent the educational effect teachers have on their students. The use of these scores in teacher evaluations for high-stakes decision making is new for the State of
Florida. Validity evidence that supports or questions the use of these scores is critically needed. This research, using data from 2385 teachers from 104 schools in one school district in Florida, examined the validity of the value-added scores by correlating these scores with scores from an observational rubric used in the teacher evaluation
process. The VAM scores also were examined in relation to several variables that the literature had identified as correlates of quality teaching as well as variables that were theoretically independent of teacher performance.
The observational rubric used in the validation process was based on Marzano‟s
and Danielson‟s framework and consisted of 34 items and five factors (Ability to Assess
Instructional Needs, Plans and Delivers Instruction, Maintains a Student-Centered Learning Environment, Performs Professional Responsibilities, Engages in Continuous Improvement for Self and School). Analyses of the psychometric properties of the observational rubric using confirmatory factor analysis supported the fit of the five-factor structure underlying the rubric. Internal consistency reliabilities for the five
The relationships between the observational rubric scores and VAM scores (with and without the standard error of measurement (SE) applied to the VAM score) were generally weak for the overall sample (range of correlations = .05 to .09 for the five observational scales and VAM with SE; .14 to .18 for the five observational scales and VAM without SE). Inspection of the relationship between the VAM and total
observational scores within each of the 104 schools revealed that while some schools had a strong relationship, the majority of the schools revealed little to no relationship between the two measures that represent a quality/effective teacher.
The last part of this research investigated the relationship of the VAM scores and scores from the observational rubric with variables that had been identified in the
literature as correlates of quality teaching. In addition, relationships between variables that the literature had shown to be independent of quality teaching were also
examined. Results indicated that VAM scores were not significantly related to any of the predictor variables (e.g., National Board Certification, years of experience, gender, etc.). The observational rubric, on the other hand, had significant relations with National Board Certification, years of experience, and gender.
The validity evidence provided in this research calls for caution when
using VAM scores in teacher evaluations for high-stakes decision making. The weak relations between the observational scores of teachers‟ performance and teachers‟ value-added scores suggest that these measures are representing different dimensions of the multidimensional construct of teaching quality. Ongoing research is needed to better understand the strengths and limitations of both the observational and VAM measures
and the reasons why these measures do not often converge. In addition, teacher factors (e.g., grade level) that can account for variation in both the VAM and observational scores need to be identified.
Chapter One: Introduction
Research has demonstrated that the quality of a teacher has a very strong influence on student achievement (Ferguson, 1998; Hanushek, Kain, & Rivkin, 1999; Hanushek, 1992; Kyriakides & Creemers, 2008; Rivkin, Hanushek, & Kain, 2005;
Rowan, Correnti, & Miller, 2002; Sanders, 1998; Wright, Horn & Sanders, 1997). For this reason several attempts have recently been made to create more accountability for teachers in the classroom. For example, in an effort to focus on teacher accountability, President Obama signed a law in February 2009 that provided money to the Race to the Top Fund (RTTT). The goal of this fund was to provide incentives for states to adopt pay for performance standards and implement ways to tie teachers‟ pay to how well their students were doing in the classroom (Race to the Top Fund, 2011).
Individual states have also begun passing laws that ask for more accountability for teachers in the educational system. This accountability requirement is fulfilled, in part, by mandating that teachers be paid for their performance rather than by years of service and the qualifications obtained (Koedel & Betts, 2011), criteria that historically have been used in compensation formulas. A specific example is the State of Florida. Early in 2011 the State of Florida passed Senate Bill 736 (SB736), which stipulated that all
teachers be paid for their performance in part by measures of their students‟ success (Senate Bill 0736, n.d.). This Bill further provided greater accountability for the educational system as a whole by including teachers in the measurement process.
Measures of teacher accountability are also present at the district level. One common measure that is part of the teacher accountability process involves the use of observational rubrics. Using these observational rubrics, administrators decide if the teachers are doing a good job in their teaching efforts and reward them accordingly. Although these observational measures are grounded in many years of empirical research (Danielson, 2011; Marzano, 2007) and have many benefits (e.g., observing what occurs in a classroom), as with all measurement approaches, this method also contains some limitations (Jacob & Lefgren, 2008; Murnane et al., 1991), which include potential bias from the observer/evaluator (e.g., initial impressions or personal opinions) (Strong, 2011). Further, the observer/evaluator may not be an expert in the topic or grade level being taught, thus limiting the understanding of what is being observed.
A benefit of using multiple measurement approaches is that usually not all methods have the same weaknesses. Because of the imperfections of an observational method of teacher evaluation, a push has developed to add new approaches to the evaluations of teachers. This new type of evaluation system falls under the label of Value-Added Modeling (VAM). Value-added models represent a variety of
mathematical models that can differ in terms of the components of the model (e.g., presence or absence of covariates or control variables) or the assumptions and
interpretations (e.g., the persistence of prior teacher effects on future outcomes) that can
be made from them (Tekwe et al., 2004). These models use the results of students‟ test
scores to mathematically estimate the effect a teacher has on the academic achievement of the teacher‟s students keeping in mind that different effects can be found using
different subject areas (reading or mathematics). A VAM score for a teacher represents how much that teacher was able to add to students‟ knowledge while he or she instructed them. With the use of these scores, teachers can be ranked by how effective they were in producing student test scores that were higher than were predicted for them.
There is a strong momentum to add VAM scores to teachers‟ yearly reviews because some policy makers argue that rewarding teachers on their results will
incentivize better performance (Hanushek, 2007; Schacter & Thum, 2004). Further, there is strong momentum to accurately understand the effect teachers have on their students. The proposal to add VAM scores into the evaluation process takes away some of the idiosyncrasies of principal administered observations by focusing the evaluation on measureable constructs.
The use of VAM in teacher evaluations seems to hold an advantage over
observational methods of evaluation. A reason for the advantage is that VAMs tend to be an equalizer of several factors that may affect teachers that are out of their control. Examples of factors that could be equalized include any special needs of a student, or whether English is the student‟s native language. The goal of VAM is to avoid unfairly penalizing or rewarding teachers in their evaluations because of the characteristics of the students in their classroom. Equalization of these factors is done statistically and not through the interpretation of an administrator.
But, like other measures of accountability, VAM is not free of flaws. The most troubling is that research has found the reliability of the scores derived from the models to be less than ideal, possibly indicating that there is much error in the teacher VAM
scores (Koedel & Betts, 2007; Lockwood, Louis, & McCaffrey, 2002; McCaffrey, Sass, Lockwood, & Mihaly, 2009). This puts in question the ability to replicate the scores and to have trust that the score produced are an accurate representation of the effectiveness of a teacher.
Because of their imperfections, teacher evaluations as accountability systems need
to be evaluated as well as the individual pieces (VAM scores and scores from
observational rubrics) to understand if the results produced are accurate representations of how teachers are performing. Since the purpose of a teacher accountability system is to be able to evaluate the performance of a teacher, if this system is not working properly, the results obtained from it may not be valid. Teacher evaluations are high stakes in the State of Florida (teachers will be retained or let go), and therefore the evaluations need to be an accurate reflection of teacher quality (Senate Bill 0736, n.d.).
The addition of VAM scores in teacher evaluations is new to the State of Florida and to date no validity evidence has been provided for them. The current research aimed to provide validity evidence of VAM scores of teachers in a Florida southeastern district by examining the relation of VAM scores to scores obtained from an observational method. In addition, this study aimed to examine how each of these measures of teacher quality (i.e., VAM scores and observational scores) related to other variables that were hypothesized to be related to quality teaching. Currently there is no “gold standard” for the evaluation of quality teaching, or even a clear definition of traits a quality teacher might possess. Since there is no perfect, or even universally accepted method for identification of quality teaching, inspection of the psychometric qualities of both the
VAM scores and the observational rubric scores is needed. Without inspection of both, even if a relationship is found, there would be no way to discern how meaningful this relation is because either or both measurement approaches could be flawed.
The southeastern district in the U.S. that was used in this study developed the teacher observational rubric to be administered by principals and assistant principals based on suggestions by industry standards (Danielson, 2006; Marzano, 2007). The rubric, which measures five constructs (Ability to Assess Instructional Needs, Plans and Delivers Instruction, Maintains a Student-Centered Learning Environment, Performs Professional Responsibilities, Engages in Continuous Improvement for Self and School), is based on teacher practices that have been empirically documented to enhance student learning. The rubric covers the areas of teacher planning, the environment in the classroom, the actual instruction, and other professional responsibilities a teacher may have (Danielson, 2007).
The value-added scores used in this study are considered by the State of Florida to be measures of students‟ academic achievement gains. The state contracted with an external company, the American Institute for Research (AIR), to develop the value-added model that produced the teacher scores derived from student achievement that were used in the present study. The model that was chosen, now called the Florida model, contains covariates and uses individual data, classroom data, and students‟ scores on the Florida Comprehensive Assessment Test (FCAT).
The Florida VAM scores were derived from an error-in-variable (i.e., x=t+e where a student‟s score is comprised of a true score and error) covariate adjustment
model with 10 predictor variables (Value-Added Model White Paper, n.d.). The
variables that were included in the model per the Value-Added Model White Paper (n.d.) can be seen in Table 1.
Because of the high-stakes decisions that are made from the use of the VAM scores and teacher evaluations as a whole, evidence to support the validity of the model and the scores derived from it is imperative. As stated in the Standards for Educational and Psychological Testing, the term validity “refers to the degree to which evidence and theory support the interpretations of the test” (American Educational Research
Association, American Psychological Association, and National Council on Measurement in Education, 1999, p. 9). Further, they state that a “sound validity argument integrates various strands of evidence into a coherent account of the degree to which existing evidence and theory support the intended interpretation of test scores for a specific use” (American Educational Research Association, American Psychological Association, and National Council on Measurement in Education, 1999, p. 17). Validity evidence of VAM scores could reveal the appropriateness of their use for high-stakes decisions.
There are several types of validity evidence that can be gathered to support the meaningfulness of VAM scores. This evidence includes correlations with other measures of teacher quality, such as those based on observational rubrics (i.e., convergent validity) and correlations with other relevant variables, as defined by a nomological network of teacher quality. The Standards for Educational and Psychological Testing (1999) served as this benchmark throughout the study (American Educational Research Association, American Psychological Association, and National Council on Measurement in
Table 1
List of Covariates in Florida Value-Added Formula
Name of Covariate
The number of subject-relevant courses in which the student is enrolled
Two prior years of achievement scores Students with Disabilities (SWD) status English language learner (ELL) status Gifted status
Attendance
Mobility (number of transitions)
Difference from modal age in grade (as an indicator of retention) Class size
Homogeneity of entering test scores in the class
Education). Based on the standards, test scores used for a new purpose must be validated (Standard 1.4); evidence of the internal structure of the test must be explored (Standard 1.11); reliability and standard errors should be presented for every score and subscore (Standard 2.1); and if subjective judgment is present in the scoring, evidence of inter-rater reliability needs to be provided and sources of error (Standard 2.10 and Standard 14.5) need to be examined.
Problem Statement
Though much research has been conducted on value-added models and how well they function, currently, there is scarce research providing validity evidence of VAM scores in relation to other variables, including scores from an observational rubric. Research designed to examine the relationship between VAM scores and the ratings
2004; Harris & Hill, 2009; Hill, Kapitula, & Umland, 2011; Kupermintz, 2003;
McCaffrey et al., 2004a; Meyer, 1997; Rubin, Stuart, & Zanutto, 2004). Part of the demand arises out of the perceived lack of connection between theory and empirical evidence (Harris & Rutledge, 2010) and another part from the need for demonstrated validity evidence prior to using VAM scores for high-stakes decision-making
(Kupermintz, 2003). Research on how value-added scores relate to accepted empirical evidence of effective teaching is needed to provide evidence to support or question the use of value-added scores in teacher evaluations, especially for high-stakes decisions. Purpose of the Study
The purpose of this study was to examine how value-added scores relate to accepted empirical evidence of effective teaching in order to provide evidence to support or question the use of value-added scores in teacher evaluations. This study examined the validity of the Florida VAM scores and how they relate to the district‟s observational rubric. In addition, this study examined how VAM scores and scores from the
observational rubric related to other established measures of teacher quality. Some of the measures of teacher quality that have been found in the literature to impact student
performance include possession of a National Board Certification and years of experience (Murnane & Phillips, 1981b; Rockoff, 2004; Strong, 2011). Since research demonstrates that the impact of years of experience may peak somewhere between three and 10 years, linear and nonlinear (i.e., quadratic) relations between teachers‟ years of experience and VAM and observational scores were examined (Murnane & Phillips, 1981b; Rockoff,
2004; Strong, 2011). Chapter Two summarizes some of the literature for these variables and their hypothesized relationship to student achievement.
Research Questions
The following research questions were examined:
All of these questions are answered with a sample of teachers from a large southeastern school district.
1a) To what extent are the observational data used to evaluate teachers during the 2011-2012 school year consistent with the five-factor measurement model
(Ability to Assess Instructional Needs, Plans and Delivers Instruction, Maintains a Student-Centered Learning Environment, Performs Professional Responsibilities, Engages in Continuous Improvement for Self and School) underlying the
observational rubric?
1b) For the observational rubric, what is the estimated internal consistency reliability of the scores for the five factors (Ability to Assess Instructional Needs, Plans and Delivers Instruction, Maintains a Student-Centered Learning Environment, Performs Professional Responsibilities, Engages in Continuous Improvement for Self and School) collected through observations obtained during the 2011-2012 school year?
2) Do administrators‟ observational ratings of teachers based on the rubric correlate with teachers‟ value-added scores from the Florida VAM within the 2011-2012 school-year?
3) Do the teachers‟ VAM scores for the 2011-2012 school year and the scores from the observational rubric relate to other theoretically relevant teacher variables (e.g., National Board Certification, years of experience) and not to theoretically unrelated variables (e.g., gender, race and ethnicity)?
Significance of the Study
This study provided several sources of evidence of validity for VAM scores. These sources of evidence included comparing VAM scores to the teacher observational rubric meant to explicate quality teachers, and variables that are correlates of quality teaching. The results provided initial evidence of the relationship between VAM scores and the aforementioned variables. In addition, this study provided evidence of the factorial validity of the five-factor measurement model underlying the observational rubric (Ability to Assess Instructional Needs, Plans and Delivers Instruction, Maintains a Student-Centered Learning Environment, Performs Professional Responsibilities,
Engages in Continuous Improvement for Self and School) used in the validation process for the VAM scores.
Limitations of the Study
This study was based on a teacher sample from one school district only in Florida. Because of the nature of VAM scores being calculated at the State level (not district level) and the fact that each district has the ability to choose the components that make up the observational rubric, the results would not be generalizable to different districts with different observational methods.
Further, this study was limited to the VAM model already in place in the State of Florida and does not provide evidence of the appropriateness of the model that was developed or the predictor variables that were chosen to be a part of the model. Validity evidence provided in this study relies solely on the scores as they were delivered to the large southeastern school district in Florida, without any modifications to the scores.
Lastly, this study relied on the teacher VAM scores from the Florida model as developed by AIR for the 2011-2012 school year. Any future modifications to the model itself may not create the same scores and may also change the score value each individual teacher receives. A change in value-added scores from year to year or through the use of a different value-added model might reveal different results of validity evidence
Definition of Terms
Confirmatory Factor Analysis: inspects the correlations among a set of variables using a relatively small number of underlying factors with the factor structures specified in advance (Brennan, 2006).
Nomological Network: can be viewed as an “interlocking system of laws which constitute a theory” (Cronbach & Meehl, 1955, p. 290). The nomological network aims to look at the relationships between constructs as specified by some theory.
Observational Rubrics: a common evaluation measure where administrators use a set of indicators to rate teacher classroom performance.
Structural Equation Modeling: a statistical method to inspect the relationships of
constructs that are part of a conceptual or theoretical framework (Benson, 1998; Benson & Hagtvet, 1996; Brennan, 2006; Graham, 2008; McDonald, 1999).
Validity: According to the Standards for Educational and Psychological Testing, the term validity “refers to the degree to which evidence and theory support the
interpretations of the test” (American Educational Research Association, American Psychological Association, and National Council on Measurement in Education, 1999, p. 9).
Value-Added Models for Teachers: statistical models for the evaluation of teachers representing the contribution in a given year teachers make on their students by comparing current school year test scores of their students to the scores of those same students in the previous school year, as well as to the scores of other students in the same grade.
Chapter Two: Literature Review
The purpose of this study is to examine how value-added scores relate to accepted empirical evidence of effective teaching, in order to provide validity evidence to support or question the use of value-added scores in teacher evaluations. This review of literature addresses teacher quality including definitions and the difference between quality and effectiveness. A review of predictors of teacher quality and research findings regarding the effect of teacher quality on student achievement is provided. The statistical
foundation underlying value-added models along with the history, types of models, the Florida model, and the problems and benefits of these models are discussed. Teacher observational methods and their role in the teacher evaluation process are discussed. Lastly, the Standards for Educational and Psychological Testing is used as a framework for examining the measurement issues that underlie the teacher observational and value-added scores.
Teacher Quality
A substantial body of research has established that teachers are a valuable component to student success, and better teachers produce better results from their students (Aaronson, Barrow, & Sander, 2007; Goldhaber & Anthony, 2003; Goldhaber,
Brewer, & Anderson, 1999; Goldhaber, & Theobald, 2011; Rivkin, Hanushek, & Kain,
better outcomes from the students that they teach. Because of this knowledge, finding out what makes an effective teacher is crucial to the development of the profession.
The key is identifying what qualities make a teacher better. At this time there is no clear definition, or gold standard, for the qualities a teacher must have to make them quality teachers. There are, though, many assumptions and research on characteristics that may make teachers better in their profession. The initial step in identifying these characteristics includes defining the difference between quality and effectiveness.
Quality/Effectiveness. The terms quality and effectiveness are casually used in the description of a teacher. General understanding, though ambiguous, is that quality and effectiveness are both desired from a teacher. The terms are made even more
ambiguous by being described by different terms such as expert teacher, highly qualified teacher, or even a master teacher.
In the literature, quality can be described, depending on the authors‟ point of view, as characteristics teachers may possess, qualifications they have earned, methods of teaching, or even the results obtained from students (Berliner, 2005; Competencies for Teachers, n.d.; Darling-Hammond, 1997; Kelly, 2012; Strong, 2011). Effectiveness is a part of quality teaching, but it relates to the outcomes achieved by students (Berliner, 1987; Strong, 2011). The understanding of this difference is crucial because value-added models are examples of measures of teacher effectiveness that are based on student outcomes, which in turn are also a part of quality teaching. This review will cover aspects that represent quality teaching, including teacher effectiveness as operationalized using the scores from value-added models.
Research on quality teachers. With the known connection between student achievement and teaching, much research has been conducted on characteristics of teachers and the perceived effect on student outcomes. The following is a review of research on teacher factors that have been examined in relation to student achievement. The variables considered are the most commonly studied.
Teacher education. The educational degree a teacher holds is thought to be a quality trait leading to higher student achievement. It is perceived that if teachers spend time and effort earning a higher degree (e.g., master‟s degree), they would be more engaged in their profession and in turn, more engaged with their students. Further, it has been common practice for districts to pay teachers more for a higher educational degree.
Research has found that teacher qualifications are weak predictors of student achievement (Berger & Toma, 1994; Borland & Howsen, 1992; Card & Krueger, 1992; Ehrenberg & Brewer, 1994; Goldhaber & Brewer, 2000; Hanushek 1986, 1992, 1997; Harnisch, 1987; Harris & Saas, 2009; Miller, McKenna, & McKenna, 1996;
Montmarquette & Mahseredjian, 1989). This variable was found in research to have mixed effects, or insignificant positive or negative effects on student achievement. These inconsistent results have been replicated over the years in numerous studies.
Teacher salary. A variable that is commonly researched for its connection to student achievement is the amount of money teachers are compensated for the work they do. This variable has produced mixed results in research as it relates to student
achievement. Many empirical studies found a positive effect of teacher salary on student achievement (Butler & McNertney, 1991; Card & Krueger, 1992; Dolan & Schmidt,
1987; Hanushek, 1997; Sanders, 1993; Stern, 1989). These studies indicated that the higher the teacher‟s salary, the higher the scores on student assessments. Research for this question was conducted across several geographic areas and over several decades. The findings of all studies are not homogenous in regard to the effect of teacher salary on student achievement. Other studies have found a negative effect between teachers‟ salaries and student achievement (Borland & Howsen, 1992; Kurth, 1987). This inverse relationship was explained by the authors of the research as a potential ceiling effect on salary. Regardless of the positive or negative finding of the research studies, all authors mentioned that higher salaries usually imply more years in teaching and thus more experience. The number of years of experience a teacher has is also an important variable that has much research.
Years of experience. The longer a person remains at the same employment, the more time he or she has to master the skills involved. Research studies have found a positive relationship between years of experience of a teacher and student achievement (Bosshardt & Watts, 1990; Card & Krueger, 1992; Ehrenberg & Brewer, 1994; Grimes & Register, 1990; Hanushek, 1992, 1997; Montmarquette & Mahseredjian, 1989; Murnane & Phillips, 1981ab). Because of these positive finding there is reason to believe teachers‟ years of experience could affect how well they perform their job duties (Harris &
Rutledge, 2010). These findings stress the fact that the longer teachers remain as teachers, the more effective they become, and in turn the better the results they obtain from the students in their classroom.
Though positive effects of years of experience on student achievement were found in almost all studies, there also appears to be an indication that there is a learning curve to becoming an effective teacher. This learning period might take several years (Murnane, Willett, & Levy, 1995). This learning curve might further be an indication of the positive relationship between teachers‟ experience and student achievement, yet this effect tends to attenuate at a certain point in the teacher‟s career.
Personal characteristics (Race/Ethnicity and Gender). Evidence for or against having a teacher from the same ethnic background as his or her students is limited and the effects may be more indirect in that a student can see a role model, which may then affect student achievement (Strong, 2011). Studies have suggested that having teachers of the same ethnic background as their students can have a positive effect on student
achievement, though only in certain subjects (Dee, 2004; Hanushek, 1971). In general results of these studies have been mixed (Ferguson, 1998). Further, these studies only inspected the relationships between White and African American students and teachers, without much inspection of other races.
The role a teacher‟s gender has on student educational outcomes has also been investigated. Though not much research has been conducted, studies have found a slightly positive to no relationship between the teacher-student match on gender and how successful the student is in completing his or her schooling career (Dee, 2004, 2005; Ehrenberg & Brewer, 1994; Nixon & Robinson, 1999). Overall, these teacher characteristics seem to have little effect on student achievement.
National Board Certification
A certificate can be obtained from the National Board for Professional Teaching Standards that designates a teacher as National Board Certified (NBC). This certification can be acquired as a supplement to state requirements and identifies teachers
knowledgeable in their content area, and able teachers in K-12th grades (National Board, 2013). This certification lasts for 10 years at which time renewal of the application is needed.
This certification can be procured through a rigorous process that demonstrates an individual‟s teaching practice through assessments and portfolios (National Board, 2013). The possession of this designation attests to the teacher‟s leadership skills and ability to enhance students‟ education, and results in an increase in the teacher‟s salary (National Board, 2013).
Much research has been conducted on the relationship between teachers who hold this designation and student achievement. Large studies have found a positive
relationship between teachers who are NBC and student achievement. This means that students of teachers who have achieved NBC certification have higher outcomes on standardized assessments than students of other teachers at the elementary levels (Card & Krueger, 1996; Goldhaber & Anthony, 2007; Vandevoort, Amrein-Beardsley, & Berliner, 2004). These achievement level differences were not always statistically significant.
Other studies have looked into what having this designation actually means. Several studies have understood this certification to imply a more effective teacher (Cavalluzzo, 2004; Sato, Chung, & Darling-Hammond, 2008; Smith, Gordon, Colby, &
Wang, 2005; Vandevoort, Amrein-Beardsley, & Berliner, 2004). A more effective teacher is one who can obtain better results from his or her students in regards to achievement.
As demonstrated by these studies, there seems to be an important effect of possessing certification from the National Board and student achievement. This
relationship appears to be a positive effect. Other variables, such as value-added scores, which are also meant to measure teacher effectiveness, should have a positive
relationship with this certification. Teachers who obtain a NBC should have a higher VAM score than other teachers.
Value-Added Modeling
Growth modeling has become an increasingly popular tool in the educational setting because it aims to predict whether a student has progressed academically with the use of previous years‟ data. Value-added modeling, specifically, is now used in many districts and states throughout the U.S. as a measure of student growth. The popularity of VAM has arisen from the ability of these measures to look at students‟ growth over time as opposed to simply seeing a single data point in a student‟s career (Schaeffer, 2004). VAM informs not just if a student was proficient in a subject, but further provides information about the degree of proficiency. The increase in the amount of information that can be determined by a student‟s test scores over time has led to advancements of VAM use for teacher accountability models.
Value-added models are normative in nature. The State of Florida uses all the teachers in the state to create these scores. Teachers who teach the courses listed in
Appendix A are included in this pool. Individual districts will have teachers who fall somewhere in the distribution of scores, made up of all teachers in the state.
There are many reasons that the focus has moved toward the use of VAM in teacher accountability models. According to Hanushek and Rivkin (2010), research supports that this measure can quantify the differences in effectiveness of teachers, even of teachers within the same schools. This tool can assist in properly identifying teachers with regard to their ability to have students make learning gains.
This section will provide information regarding the history of value-added models, the different types of models, and the advantages and disadvantages of using value-added models for rating teachers. The last part of this section explains the Florida value-added model and includes how it was developed and the predictor variables in the model.
History. The history of VAM loosely begins in the 1840s in the U.S. when the city of Boston implemented an assessment to rate the academic differences amongst a large group of students, between classrooms and different schools (Resnick, 1982). This preliminary step to modern VAM methods was intended to observe and compare the differences between students in different school settings, thus stressing the importance of measurement to understand students and inform decisions.
In the 1960s, with the Soviet Union‟s ability to launch a rocket into outer space (Sputnik), the U.S. began several efforts to ensure that students were being held
accountable including the beginning of the National Assessment of Educational
progress to be measured at certain intervals in time. This allowed the country to examine and keep track of student growth.
Another initiative implemented as a result of Sputnik was the Equality of Educational Opportunity Survey, which culminated in the Coleman Report (Glaser & Silver, 1994). This report found that there were large variations in achievement levels across the country (Coleman et al., 1966). Because there was now a clear finding that not every student had the same knowledge upon graduation, more actions were taken.
Because there was a belief that something was wrong with the U.S. educational system, a report was initiated to examine the type of education students were receiving (Gardner, Larsen, & Baker, 1983). This report provided the foundations of what courses students in high school needed to take; asked high schools and universities to be more rigorous; and asked for changes in teachers‟ salaries and work contracts (Gardner,
Larsen, & Baker, 1983). All of these changes were meant to bring more accountability to the educational system as a whole, and to the teachers who were a part of this system.
In 1994 Goals 2000, which was made law by President Clinton, attempted to have states develop standards and create assessments to test student knowledge on those standards (Superfine, 2005). This program was not successful for multiple reasons. It was followed by the No Child Left Behind Act (NCLB).
The next notable action that focused attention towards testing was the passing of the No Child Left Behind (NCLB) Act in 2001, and implemented in 2002, which demanded accountability of teachers in the classroom (Public Law 107-110) (U.S. Department of Education). This act refocused the nation‟s attention towards testing and
it further placed emphasis on tying teacher performance expectations to student scores on assessments.
Though for years states have been looking at students‟ achievement by assessing whether they reach a certain level of proficiency, such as Adequate Yearly Progress (AYP), this method is not ideal as it groups student performance into broad categories (Koretz, 2003). Simply stated, by not keeping all of the information from a particular score a child may have received on an assessment, it is impossible to determine the actual amount of proficiency, and the only thing that can be determined is if proficiency was observed. For this reason, attempts were made to develop measures for use in
accountability that would maintain as much information from the test scores as possible. One method currently in place that can be used for accountability purposes and which uses information of students‟ scores over time (as opposed to a snapshot in time) involves the use of value-added models. Since research has demonstrated that teachers do in fact have an effect on the students they teach, value-added models have been introduced as a way to estimate the effect a teacher has on academic achievement of a student (Hill, Kapitula, & Umland, 2011). These statistical methods provide individual teachers with a score that takes into account several predictor variables, and which include current and previous test scores of the students in their class. This VAM score can then be used to compare teachers based on their levels of student effectiveness, and be used in pay-for-performance plans.
Different Types. There are several types of value-added models currently in existence. One of the reasons for the several models is that teachers and students change
over time, thus a simple hierarchical linear model would not be adequate to understand the effects of a teacher on students (e.g., McCaffrey et al., 2004b; Raudenbush & Bryk, 2002). Thus many attempts have been made to identify the most effective method to measure the effect of teachers on student achievement. VAMs can be different in several ways including the model itself as well as the statistical assumptions underlying the models (Tekwe et al., 2004).
Three main types of value-added models include the covariate adjustment model, the one year gains model, and the cross-classification model (Raudenbush & Bryk, 2002). Briefly, the covariate adjustment model uses scores from previous years and includes covariates (predictor variables); the one year gains model subtracts the current year score from the previous year‟s score and still includes covariates; the complex cross-classified model uses random effects with the outcome differences being test scores or test score gains (McCaffrey et al., 2004b; Rubin, Stuart, & Zanutto, 2004). These different models are currently in place for several pay-for-performance plans across the United States.
For example, the Tennessee value-added model monitors the gains that students make through time on state assessments but does not include demographic predictor variables (i.e., covariates) (Sanders et al., 2002). On the other hand, the Florida model includes many predictor variables. Each state has the autonomy to decide the model that best suits its needs. Yet, even if states chose the same type of value-added model to use for the calculation of teacher effect on students, each state or district has the liberty to make individual modifications to the model.
Advantages. Growth modeling is now considered a better model for inspecting true differences between teachers and schools than the previously established methods, such as AYP (Linn, 2006; Meyer, 2000; Raudenbush, 2004). Research has demonstrated that value-added modeling can be a meaningful measure of teacher effects on student achievement (Jacob & Lefgren, 2005; Kane & Staiger, 2008). For these reasons, there is an increase in the use of value-added modeling for pay-for performance plans.
One of the main advantages of using value-added modeling is that it tends to be an equalizer of several factors that affect teachers and are out of their control, in turn reducing systematic error (Harris, 2011). For instance, teachers will not be penalized or rewarded unfairly for the individual characteristics of the students they teach (Ballou, 2002; McCaffrey et al., 2004b). For these reasons, scores from value-added models make it possible to compare teachers who have students who differ on demographics, socio-economic status, or abilities.
Growth models further have the ability to take into account the differences that existed prior to the current years test score (Linn, 2008). VAMs rely on several predictor variables that are measured over time, as opposed to a single measure, thus increasing the possibility of identifying a trend (Amrein-Beardsley, 2008). This in turn ensures that the scores measure student gains and make it fairer for teachers and schools.
Disadvantages. A primary disadvantage to using value-added modeling is related to the lack of transparency of the models used for pay-for-performance. Because of proprietary information, the models have generally not been open for peer review (Amrein-Beardsley, 2008; Kupermintz, 2003). Consequentially, it is impossible to obtain
the opinions of experts from across the country with regard to the models or for the statistical community to provide suggestions for improvement.
Another disadvantage of using value-added models for pay-for-performance plans is that research on existing models has found causes for concern in using these models. Reliabilities of the scores derived from these models have been modest to low (Koedel & Betts, 2007; Lockwood, Louis, & McCaffrey, 2002; McCaffrey, Sass, Lockwood, & Mihaly, 2009). This fact is not reassuring when the possibility of using these scores for continual employment exists.
Another problematic aspect of scores from a value-added model is that research has found different results depending on the assessment used in the model (Lockwood et al., 2007; Papay, 2011). Since different assessments are used to calculate value-added scores in different states, the same teacher could potentially receive a better score in Florida than in Tennessee, and vice-versa. This is not desirable because the models are supposed to be stable enough to detect teacher effects regardless of external conditions.
Several studies have also compared value-added outcome scores to teacher evaluations completed by principals. The correlations of those scores have been low to moderate (Gallagher, 2004; Kimball, White, & Milanowski, 2004; Milanowski, 2004).
Milanowski (2004) compared VAM scores for teachers in Cincinnati to the
Cincinnati teacher evaluation rubric (Teacher N=212) for reading, mathematics, and
science (teachers were analyzed in multiple categories). A composite score based on four domains from the observational rubric was used in this study. This study used about 66% of the students who qualified for analyses in the computation of VAM scores as extreme
student scores, based on the scale score of the state and district assessments, were removed from the sample. Results were presented by grade and by subject with
correlations in reading from grades 3 to 8 ranging from .03 to .45, mathematics from .20 to .56, and science from -.01 to .33. Results combined over grade level produced
correlations in reading of .32 (95% confidence interval = .18 to .45), mathematics of .43 (95% confidence interval= .29 to .55), and science of .27 (95% confidence interval = .09 to .46) (Milanowski, 2004).
Kimball, White, and Milanowski (2004) inspected the relationship between VAM scores and scores from an observational rubric, based on the work of Charlotte
Danielson, in a county in Nevada. Analysis was based on 328 teachers (123 teaching 3rd
grade, 87 teaching 4th grade, and 118 teaching fifth grade) (Kimball, White, &
Milanowski, 2004). The empirical Bayes estimates resulting from the VAM were then correlated with the observational rubric in the district. The resulting correlations were
very weak to weak (3rd grade reading and mathematics, r=.10; 4th grade reading, r=.28;
4th grade mathematics, r=.07; 5th grade reading, r=.28; 5th grade mathematics r=.37) (Kimball, White, & Milanowski, 2004).
Another study by Gallagher (2004) inspected the relationship between VAM scores and teacher evaluation scores based on an observational rubric. One Los Angeles
elementary school was chosen for this research and based on 34 5th grade teachers the
correlations between the VAM scores were low to moderate by subject (reading r=.50;
mathematics r=.21; language arts r=.18; composite r=.36) (Gallagher, 2004). Thus, this
correlations between the VAM scores and scores from an observational rubric. Sample size was very small for this study.
In general, though there are several positive aspects about value-added modeling there also several drawbacks to using the models. All research inspected suggests caution when using value-added modeling for high-stakes decision-making; several researchers have noted that VAM scores should not be used in isolation but should be one part of a comprehensive evaluation of teachers‟ performance. These previous results underscore the need for validity studies on these measures.
Florida value-added model. The State of Florida has attempted for many years to pay teachers based on their performance. The first attempts occurred during the 1990s and 2000s but the results of the attempts obtained mixed reviews at best (Hill, Kapitula, & Umland, 2011). Efforts to create a method to pay teachers based on their effects on student achievement were not a top priority for several years given previous results. Race to the Top funds have made the State of Florida again invested in creating a pay for performance plan that can be appropriately implemented.
In the State of Florida, the resulting scores from value-added models are derived in part from student scores on the Florida Comprehensive Achievement Test (FCAT). Since the results of this assessment are a large component of the covariates in the Florida value-added model, an understanding of the standardized statewide test is essential to understanding the Florida model.
FCAT. As stated in the Florida Department of Education website, the FCAT began its implementation in 1998 (Florida Department of Education, n.d. a). The FCAT
is a “criterion-referenced test in mathematics, reading, science, and writing, which measure student progress toward meeting the Sunshine State Standards (SSS)
benchmarks” (Florida Department of Education, n.d. a). The test was constructed using rigorous industry accepted standards and has been equated, from year to year, taking into account grade level differences.
The FCAT student results are presented in Developmental Scale Scores (DSS). This form of score, which ranges from 0-3000, was developed to “track student progress over time and across grade levels to indicate student „growth,‟ or „learning gains‟ (Florida Department of Education, n.d. b, para. 25). The school year 2010-2011 was the last year that the FCAT was used for testing purposes continuously through the tenth grade. The State of Florida is now moving towards end of course exams (EOC‟s), which will replace portions of the FCAT (Ash, n.d.) and future years VAM scores will be developed from these measures.
Development of the model. To determine teacher value-added scores, the State of Florida contracted with an external company, The American Institute for Research (AIR). Because of proprietary reasons, there is only limited information on the actual model this company has created. Though there is insufficient information regarding the details of the model, there is a plethora of information regarding how the model was constructed.
The American Institute for Research cooperated with a committee made up of community stakeholders to design and implement the model for the State of Florida. The committee, called the Student Growth Implementation Committee (SGIC), working
closely with AIR, made a recommendation for a covariate adjustment model with eight predictor variables that was accepted by the State of Florida (Value-added model White Paper, n.d.). The covariate model uses scores from the current year test as the outcome variable while prior year test scores and other variables are used as covariates; the model treats teachers and schools as coming from a distribution of random effects (American Institute for Research, n.d.).
The final model is a hierarchical linear model with separate levels for the
variation between schools, the variation between teachers within a particular school, and the variation between students in a particular classroom, all computed as orthogonal (uncorrelated) components (American Institute for Research, n.d.). Calculations are done using data from the entire state, not district by district, and therefore, differentiations between the statewide expectation and specific school differentiations (which could be explained by better leadership or assignment of students and teachers) are calculated and become the school component of the equation (American Institute for Research, n.d.). The final score for a teacher is then made up of the particular teacher score adding in half of the school component. The model, in general form, can be found in Equation 1.
∑ ∑ (1)
According to the Florida Value-Added Technical Report
is the observed score at time t for student i, is the model matrix for the student and school level demographic variables, is a vector of coefficients capturing the effect of any demographics included in the model, is the observed lag score at time t-r ( { }), γ is the coefficient vector
each unit in q ( { }) and one row for each student record in the database. The entries in the matrix indicate the association between the test represented in the row and the unit (e.g., school, teacher) represented in the column. We often concatenate the sub-matrices such that { }. is the vector of effects for the units within a level. For example, it might be the vector of school or teacher effects which may be estimated as random or fixed effects. When the vector of effects is treated as random, then we assume
for each level of q. (American Institute for Research, n.d., p. 6)
From the formula the teacher effects can be derived, which are the residual variations at the teacher level once the student and school factors are separated. As previously stated, student expectations (how they are predicted to perform) are calculated in relation to a comparison to other students with similar characteristics and prior test scores. The difference between what is expected of the student, and how the student actually performed is called the residual, and those residuals are then aggregated by teacher using empirical Bayes estimation to calculate the teacher effect (American Institute for Research, n.d.). The formula for the aggregate teacher effect estimates ( ̃ = aggregate for teacher j) can be seen in equation two, “where is the teacher level variance, is the school level variance, is the residual variance, denotes the number of students in class j and the notation (j)i is used to mean that student i in class j” (American Institute for Research, n.d., p. 7).
The variables that were included in the model according to the Value-Added Model White Paper (n.d.) are: the number of subject-relevant courses in which the student is enrolled; two prior years of achievement scores; Students with Disabilities (SWD) status; English language learner (ELL) status; gifted status; attendance; mobility (number of transitions); difference from modal age in grade (as an indicator of retention); class size; and homogeneity of entering test scores in the class. According to SB736, the use of gender, race/ethnicity, and socioeconomic status could not be used as covariates in the value-added model (Senate Bill 0736, n.d.). A table with explanations of these covariates can be seen in Appendix B. These variables were considered to be the most important aspects of teaching in need of statistical control.
The SGIC not only decided what covariates to include, but also made business rules to be used while processing the data. “Business rules consist of decisions about student attribution to teachers, how duplicate or missing data are managed, how growth expectations for students taking multiple courses or having multiple teachers are
determined, etc.” (Value-added model White Paper, n.d., p. 5). The same document also states that more specific details for these business rules would be provided in the
Technical Report, however, review of said report (American Institute for Research, n.d.) revealed that it does not address the business rules.
The final model is considered an error-in-variable (i.e., x=t+e where a student‟s score is comprised of a true score and error) covariate model (McCaffrey et al., 2004b). In order to account for higher errors at the extremes of the conditional standard errors of measurement (CSEM), and because there is heteroscedasticity in the error term, the
error-in-variable regression model was chosen by the committee as the most appropriate way to derive the VAM scores using empirical Bayes estimation (American Institute for
Research, n.d.).
Ultimately, a “teacher‟s value-added scorereflects the average amount of learning growth of the teacher‟s students above or below the expected learning growth of similar students in the state, using the variables accounted for in the model” (Value-Added Model White Paper, n.d., p. 2). This model further includes past test scores of students in order to properly calculate their expected gains. The resulting scores can then be used to compare teachers to one another.
Though the Value-Added Model White Paper (n.d.) states that the technical manual will include all information necessary to replicate the model, the presenters of the model at the state conference held in Orlando on August 1 and 2, 2011, constantly
reminded the public that replication was impossible at the district level because they had used the entire state data to calculate the VAM scores (Webcast, 2011). Scores could be replicated if scores from every district in the state were available and AIR explained that any change in an individual teacher‟s population of students would create a change in every teachers‟ scores. Insufficient time has passed for research and reports to be available on the Florida VAM. For this reason it is imperative that a validity analysis be conducted to better understand the scores that come from this model.
Observational Methods
Currently there is extensive research and literature on methods to evaluate teachers through observation. This literature can be divided into two categories:
administrator decisions and observational rubrics based on specific standards. Specifically, this research is based on practices that effective teachers employ in the classroom to increase student achievement.
Research on administrative review of teachers, specifically by principals, has demonstrated the benefits and flaws of this type of evaluation and how scores from these observations relate to student educational achievement (Anderson, 1954; Armor et al., 1976; Brookover, 1945; Gotham, 1945; Hill, 1921; Jacob & Lefgren, 2005, 2008; Manatt & Daniels, 1990; Medley & Coker, 1987; Wilkerson et al., 2000). Studies have found that principals are capable of identifying highly effective and highly ineffective teachers, but are not as adept at identifying the average teacher (Jacob & Lefgren, 2008). Further, teachers have complained about their lack of understanding the reasons why principals assign bonuses to some teachers and not others (Murnane et al., 1991).
Another large body of research involved classroom observations utilizing frameworks that are meant to depict actions and activities effective teachers should engage in (Gallagher, 2004; Holtzapple, 2003; Kimball, White, & Milanowski, 2004; Milanowski, 2004; Schacter & Thum, 2004). This can also be referred to as standards based evaluations as the frameworks are composed of standards. Standards have been developed and compiled by organizations such as the National Board for Professional Teaching Standards, The Bill and Melinda Gates Foundation, and the Interstate New Teacher Assessment and Support Consortium, and these standards incorporate classroom evidence into teacher evaluations (Darling-Hammond et al., 2012).