ESRC project ES/M010953: WP 23: Bennett, van Lieshout, and Schürer: Missing in the Census 1851-1911, Cambridge University.
Missing in the Census 1851-1911: The ‘lost’, ‘missing’, and ‘gaps’ in I-CeM
and BBCE, with weights to adjust RSD populations
Robert J. Bennett, Carry van Lieshout and Kevin Schürer
[email protected] [email protected] [email protected]
Working Paper 23:
Working paper series from ESRC project ES/M010953:
Drivers of Entrepreneurship and Small Businesses
University of Cambridge, Cambridge Group for the History of Population and Social Structure, Downing Place, Cambridge, CB2 3EN, UK.
February 2020
Comments are welcomed on this paper: contact the authors as above.
© Bob Bennett and Carry van Lieshout University of Cambridge, and Kevin Schürer, University of Leicester, members of the Cambridge Group for the History of Population and Social Structure assert their legal and moral rights to be identified as the authors of this paper; it may be referenced provided full acknowledgement is made: Cite (Harvard format):
Bennett, Robert J., van Lieshout Carry and Schürer (2020) Missing in the Census 1851-1911: The ‘lost’, ‘missing’, and ‘gaps’ in I-CeM and BBCE, and weights to adjust RSD populations Working Paper 23: ESRC project ES/M010953: ‘Drivers of Entrepreneurship and Small Businesses’, University of Cambridge, Department of Geography and Cambridge Group for the History of Population and Social Structure.
Keywords: Population, Entrepreneurship, Employers, Self-employment, Census
ESRC project ES/M010953: WP 23: Bennett, van Lieshout, and Schürer: Missing in the Census 1851-1911, Cambridge University. Missing in the Census 1851-1911: The ‘lost’, ‘missing’, and ‘gaps’ in I-CeM and BBCE,
with weights to adjust RSD populations
Robert J. Bennett, Carry van Lieshout and Kevin Schürer
Working Paper 23: Working paper series from ESRC project ES/M010953: Drivers of Entrepreneurship and Small Businesses, University of Cambridge
1. Introduction
This paper assesses the gaps in records that exist in the England and Wales censuses over 1851-1911. These gaps are important to identify for any analysis of census records. As well as being significant for genealogists attempting to find the records of individuals, gaps reduce the total of returns which results in underestimation of the population available from the surviving records, and this can lead to significant under-estimation in a location or in specific demographic or other categories. These gaps need to be understood and if possible compensated for (e.g. by re-weighting the data) when undertaking analysis of census data. Identifying the gaps also indicates locations where individuals will not be found in any genealogical or record-linkage exercise, and hence where alternative sources must be sought, and where compensation may be needed to understand matched sample frequencies. This paper assesses the gaps in England and Wales census records in general to give an overview of the issues that arise and how they can be handled through weighting.
The sources used to assess gaps are the transcripts of the England and Wales census that are now available digitally. These derive from the records created by FindMyPast (FMP) that have been put into an integrated database in I-CeM for 1851-1911 produced by a team at the Universities of Essex and Leicester, deposited at the UK Data Archive/ Data Service (UKDS): The Integrated Census Microdata (I-CeM).1 This provides electronic versions of
1 Schurer, K., Higgs, E. (2014). Integrated Census Microdata (I-CeM): 1851-1911. [data collection]. UK Data
Service. SN: 7481, http://doi.org/10.5255/UKDA-SN-7481-1. A user guide and manual to the I-CeM data is available as E. Higgs, C. Jones, K. Schürer and A. Wilkinson, The Integrated Census Microdata (I-CeM) Guide,
ESRC project ES/M010953: WP 23: Bennett, van Lieshout, and Schürer: Missing in the Census 1851-1911, Cambridge University. transcriptions of the original Census Enumerators Books (CEBs) for 1851-1901 that are held by The National Archives (TNA) and original household schedules for 1911, as well as enhancing the data with various codes for household structure, relationships between people, and occupations.2
Within the census data is information on ‘employment status’. The information on employers and own account is the main subject of research in the Drivers of Entrepreneurship and Small Businesses ESRC-supported project ES/M010953. Although this paper focuses primarily on the impact of gaps in records for general use of the I-CeM data, it also discusses how gaps affect data on employment status. The weights that are constructed can be used in any applications, but were specifically developed for use with the British Census of Entrepreneurs (BBCE) database deposited at UK Data Archive (UKDS).3 A full list of Working Papers is given at the end of this paper.
The paper first outlines the various gaps in census records that occur and how they have arisen. Section 3 discusses sources for identifying lost records. Section 4 outlines the detail of how the gaps can be identified using 1861 as the main example where most missing records now occur. Section 5 extends the discussion to cover the other census years 1851, and 1881-1911. Section 6 of the paper outlines how weightings have been constructed for compensating for gaps. Downloads with this paper give the actual weights which can be used with I-CeM and/or BBCE. Note that in I-CeM there is currently no set of digital records for the 1871 England and Wales census, and no records for 1841, so that assessment of any gaps in these records are only partially covered in the paper. Also note that there are believed to be
no archival gaps, or insignificant missing material, from the archival records for Scotlandso
available from the CeM website at: https://www.essex.ac.uk/history/research/icem/. The creation of the I-CeM database was made possible through funding from the UK Economic and Social Research Council (ESRC), grant number RES-062-23-1629.
The version of the I-CeM data used here is referred to as Provisional I-CeM v. 2, which is to be deposited with the UK Data Service in 2020. This is distinct from an interim enhancement http://doi.org/10.5255/UKDA-SN-7481-2. The future version is further enhanced as the result of work by Schürer, and by Reid, Garrett and Jaadla as part of the ESRC-funded An Atlas of Victorian Fertility Decline project (ES/L015463/1) at Campop; http://www.geog.cam.ac.uk/research/projects/victorianfertilitydecline/. An earlier reference to this version used within Campop and in BBCE working papers was: K. Schürer, E. Higgs, A.M. Reid, E.M Garrett (2016)
Integrated Census Microdata, 1851-1911, version V. 2 (I-CeM.2).
2 e.g. ‘General Instruction’, Census of England and Wales, Householder’s Schedule, 1851.
3 R. J. Bennett, H. Smith, C. van Lieshout, P. Montebruno and G. Newton (2020) The British Business Census
of Entrepreneurs 1851-1911 (BBCE) [data collection]. UK Data Service, SN: pending.User Guide, https://doi.org/10.17863/CAM.47126
ESRC project ES/M010953: WP 23: Bennett, van Lieshout, and Schürer: Missing in the Census 1851-1911, Cambridge University. that this paper is restricted to England and Wales.4 However, there are certainly many of the same issues identified below in the way the current digital records for Scotland have been received in I-CeM which need attention, as discussed briefly in conclusion.5
A distinction of terminology is made throughout this paper between:
(i) ‘Gaps in I-CeM’: a generic term to describe all records lacking in the I-CeM version of the census, as measured against the published records. These derive from the following two causes:
(ii) ‘Lost’: those records that are no longer available from TNA because the originals have been lost or destroyed over the years and hence can never be in I-CeM, BBCE, or other transcripts.
(iii) ‘Missing’ from I-CeM: those records that are not in I-CeM because they are either the ‘lost’, or they are unidentifiable to their location as a result of coding, misallocation, or processing errors deriving from TNA coding, coding by the data supplier (FMP), or the method of construction of I-CeM. A very small number of missing records have been added to BBCE for 1851 (see WP 21). For the remaining ‘missing’ records for a location, some may actually be present in I-CeM and BBCE, and may subsequently be identifiable as a result of further efforts to improve the I-CeM coding, or may become correctly identified as ‘lost’ as a result of further efforts by TNA.
2. The challenge of gaps in census records
The England and Wales census has been taken every 10 years since 1801, with the exception of 1941, and was administered by the General Register Office (GRO). From 1841 onwards, the information collected was at the level of the individual. However, with the exception of the 1911 census, the original household schedules have not been preserved, and any existing historical census records are based on the Census Enumerator Books (CEBs), in which the enumerators copied all information contained in the household schedules. All surviving
4 Specific checks with National Records of Scotland have confirmed to the authors that none of the Scottish
records are known to be ‘lost’, except in 1841. See also: Scotland’s People, Guide to the Census Returns.
5 For example, in 1861 the current I-CeM v.1 at UKDA has 1.5% of Scottish records missing, which is the worst
year. There are also duplicated and spatially misallocated records. Corrections have been made in the BBCE analysis and database deposit: see WP 20.
ESRC project ES/M010953: WP 23: Bennett, van Lieshout, and Schürer: Missing in the Census 1851-1911, Cambridge University. census records are subject to gaps and omissions, whether sourced directly from TNA original paper records, or from the various scanned online resources such as FMP, Ancestry, or S&N, or from the 1881 census transcription by the Genealogical Society of Utah (GSU). The several scanned electronic resources are all based on the original paper records, but non-availability at the time of scanning, and the different transcriptions created to facilitate online searches, have introduced further gaps.
The problem of missing census records has been known for a long time. It is briefly commented on by Higgs, who notes gaps for 1841 in London, Kent and Essex, the loss of almost all ship returns for 1851, and the loss of the Belgravia and Woolwich Arsenal Sub-Districts in 1861.6 However, there has been no previous systematic attempt to assess the general extent of missing records and the numbers involved. A better understanding can now be developed thanks to the availability of I-CeM. The I-CeM database derives from the transcriptions of FMP for all years except 1881 which comes from GSU transcriptions. The Essex and Leicester I-CeM team enriched these data with further coding. The gaps that arise derive from a variety of causes and affect the different stages of creation of the records in different ways. The analysis here uses the UKDS I-CeM v.1 with some enhancements made in the construction of BBCE, as well as significant improvements in the original coding of I-CeM made by Kevin Schürer at Leicester with additional inputs from a Cambridge Population Group team which corrects most anomalies (see footnote 1). This is referred to as: Provisional I-CeM v. 2 (which is distinct from UKDA-SN-7481-2).
2.1. ‘Lost’ original records from TNA.
The original records of some pages of the CEBs have been lost or damaged over the years for a variety of reasons: a few may have been stolen (such as Belgravia), but most ‘lost’ result from water damage, pests, or poor storage conditions (which particularly affected the rooms in which 1851 and 1861 were stored), and probably losses on transfer between storage locations. The storage conditions for the census CEBs were often far from ideal, and some were moved several times over their history with losses in transit the most probable explanation for large batches that are now lost. For example, the 1841 and 1861 CEBs were
ESRC project ES/M010953: WP 23: Bennett, van Lieshout, and Schürer: Missing in the Census 1851-1911, Cambridge University. found in 1904 in the roof of the Houses of Parliament under the responsibility of the Office of Public Works, but with no proper archival storage, and when transferred were found to be disarranged. Higgs describes this process, the reluctance of the GRO census administrators to release the volumes for archival storage, and the confused state of many of the records when received by the predecessor of TNA (the Pubic Record Office (PRO)) in various phases. The 1851 records were passed to the PRO by 1912. The 1861 records were not received by the PRO until 1962, and most of the census records from 1871-1901 were not received until 1974.7
In addition to losses and damage of whole CEBs or blocks of material, the backs and fronts of separate enumerator books were subject to a higher level of loss, meaning that pages towards the start and end of a book are more likely to have been lost than those in the middle.8 A further difficulty is that some of the individual page records that have become detached and appear lost may in fact exist but have become ‘orphaned’ from their ‘parent’ documents. However, they are often either not recognised as orphans, have insufficient information to allow them to be correctly identified and reunited with the parent record, or may have sufficient information but have not yet been reunited.9
Lost front and rear pages, and individual orphans arise in all the census years, for a variety of reasons. But lost and orphaned documents are more prevalent for the earlier censuses (1841 and 1851) because a considerable amount of damage reputedly resulted from the needs to prove pensionable age at the time of the Old Age Pensions Act (1908). Individuals who did not know and/or could not prove their birth date, or had no other evidence of age, could request an attested copy from the General Register Office (GRO) of a previous census that showed their age.10 The process by which the GRO clerks found the relevant CEBs on the
7
Higgs (2005) Making sense of the census revisited, 24-5.
8 The CEBs had covers and summary pages, so this did not always result in the loss of the pages containing the
records of individuals.
9
Reuniting orphans is particularly difficult between the 1861 and 1871 censuses because the original page printing and design for these censuses are identical. As a result an orphaned page cannot be attributed to the right year, except where the information that it contains may allow the location to be deduced and a gap to be identified in an otherwise seemingly continuous records. But often orphaned pages do not contain enough relevant locational information to allow this. As a result a few records in genealogical databases and I-CeM may be attributed to the wrong census year with no way to identify them.
10 The GRO was very reluctant to do this, but were forced to do so. We are grateful to Audrey Collins (TNA) for
pointing out that the Registrar General often declined to allow access to the records. They had always previously been treated as confidential and searches were usually resisted (RG 18/189). For pensions GRO stated that they were 'preserved in a more or less imperfect condition at Queen Ann's Chambers, Tothill Street, SW, and those for 1891 and 1901 are still in this Office' and were not available as proof of age (TNA RG 19/188). However,
ESRC project ES/M010953: WP 23: Bennett, van Lieshout, and Schürer: Missing in the Census 1851-1911, Cambridge University. storage shelves, pulled them off the shelf and returned them to the right location apparently resulted in the cover sheets and the last pages being occasionally detached, dropped, and then misplaced or lost, and the frequent turning of pages could also result in a page being separated from its book, or become damage or torn.11 The detachment of a single page could leave it orphaned if it contained no definitive locational information; the detachment of the cover page could result in the whole CEB being unidentifiable as to its location if the individual pages gave only abbreviated or no locational information (which is quite common). Given the timing and needs of the 1908 Act, these detachments are most common for the censuses 1861-1891.12
The defects in preservation and use for pension and other purposes has resulted in the loss of tiny numbers of records for some census years, but for the first two years ranges up to about 3.7% of records in 1861 and up to 2% in 1851 (as estimated later below). Some partially lost records have been recovered, such as the flood-damaged 1851 CEBs for Manchester, Salford, Oldham, and Ashton-under-Lyne, which have been deciphered and transcribed by the Manchester and Lancashire Family History Society and are available in typescript on FMP, and are included in I-CeM.13 Similarly the records for Sturminster RSD in Dorset were found at the Dorset Record Office, and the records for Wrexham RD were discovered in a bookshop; both have subsequently been transcribed and are in FMP and I-CeM.14 It is unlikely that any further lost records of any scale will be discovered in the future.
2.2. Scanned and transcribed versions of the CEBs.
The TNA records of the CEBs have been scanned and transcribed by providers of genealogical services. The I-CeM records derive from FMP for all years except 1881. For
there are cases where the Registrar General did agree to produce records, but this was usually in response to an enquiry via an official agency or representative; the Registrar General also agreed to send the Scottish records to Scotland, but advised they should not be released.
11
Information on this process is derived from TNA staff reported by Eddy Higgs.
12 The pension was paid from 1 January 1909. To prove eligibility individuals had to be over 70, a British
subject for at least 20 years, and resident in the UK. The process started at the end of September 1908, with forms returned to the postmaster of the Post Office that would pay the benefit. A rush of demand for proof of eligibility in the short time available doubtless increased pressure on GRO clerks. Once submitted, applications were processed by Local Pension Committees administered by county councils (see House of Commons Library (2008). By 31 December 1908 a total of 596,038 pensions had been granted, initially mostly to women (The Times (38862), 21 January 1909. p. 10 (quoted in Ibid. p. 10); also Fraser (2003: Chapter 7)).
13 Higgs, Jones, Schürer, and Wilkinson, I-CeM guide, 23. 14
Transcribed by Denbighshire Archives: see ‘Missing from 1841 census: Wrexham’: https://www.nationalarchives.gov.uk/help-with-your-research/research-guides/census-records/
ESRC project ES/M010953: WP 23: Bennett, van Lieshout, and Schürer: Missing in the Census 1851-1911, Cambridge University. 1881 FMP received a copy of GSU from Schürer based on the earlier UKDS deposit.15 FMP then apparently re-keyed the 1881 from originals and checked for differences. As a result it is believed that the 1881 data had a higher level of checking and may be more accurate. For the BBCE and the entrepreneurship project significant gaps and truncations of the FMP transcriptions for 1851 and 1861, and the absence of I-CeM records for England and Wales in 1871, were infilled by inspecting the CEBs, and for 1851 and 1871 using the transcriptions created under special licence from S&N.16 Each of the genealogical bodies worked from the same TNA microfilms or original CEBs. The quality of these varies, with some almost opaque resulting in very poor transcriptions. Over time some original scans, especially those derived from microfilm, have been or are being re-scanned where they have poor resolution and re-transcribed. However, all transcriptions in use for I-CeM derive from the images available up to about 2005-7.
But however accurate these transcriptions, various gaps arise, which in approximate order of frequency of occurrence are as follows:
‘Lost’ or damaged illegible pages in original TNA records. Original pages that had been lost at the time of scanning are the major source of gaps in transcribed census sources, and thus in I-CeM.
Missing pages in scans resulting from errors in the scanning process by the various genealogical suppliers using the TNA records. The number of missing scans is believed to be small, and will differ between suppliers where they have undertaken the scanning by different operatives. Where scanned by different operatives any gaps occur in different places, but it would be a major exercise to detect where different records fill gaps in each other - although this has been done between FMP and S&N for the BBCE database to fill gaps in I-CeM for entrepreneurs (see WP 12). There has been updating of scanning and transcription by the genealogical suppliers as gaps have been detected, and as TNA have found previously missing and orphaned records. The I-CeM data derived from FMP in c. 2005-7 will not contain any subsequent updating of non-missing subsequently found, meaning that there will be more missing people in I-CeM than are missing from TNA or the genealogy providers
15 Schürer, Kevin and Woollard, Matthew (University of Essex) (2000) 1881 Census for England and Wales, the
Channel Islands and the Isle of Man (Enhanced Version) [computer file] UKDA, SN-4177.
ESRC project ES/M010953: WP 23: Bennett, van Lieshout, and Schürer: Missing in the Census 1851-1911, Cambridge University. such as FMP. However, this updating has been fairly limited compared to the total of ‘lost’ census records.
Some individual records were missed by transcribers. These usually relate to individual records for a single line in a CEB rather than blocks of individuals and tend to occur randomly through a batch of processing, although there is some tendency for missed lines to be more frequent towards the end of a CEB batch. Gaps are more frequently truncations or lack of some information that should have been transcribed but was not. This particularly affects the ends of the occupation fields, and had a major effect on the BBCE database before infills. Transcribing was undertaken by different organisations using a range of different transcribers; 1851 is generally recognised as having some of the poorest transcripts because FMP did not fully transcribe 1851 as a whole but rather pieced together transcriptions made by family history societies and others (which were often good) and infilled the gaps (which was often very poorly executed) – this results in a jigsaw of data inputs and quality. The I-CeM team then tried to impose an order on the whole. In contrast, 1881 as noted above (derived from GSU and FMP re-keying) is believed to be the most accurate. Generally, FMP and Ancestry provide the transcription sources for the different census years 1841-1911; but S&N re-transcribed all the censuses (including 1881) giving a useful comparative resource.
2.3. I-CeM coding.
In addition to lost, un-scanned or un-transcribed records, and orphans, these is confusion in detecting gaps arising from the coding in I-CeM. The material received by the Essex and Leicester University teams that created I-CeM had to be coded to geographical units for parishes, RSD, RDs, and counties. Because FMP scanned in batches that were not always in sequence with the GRO piece and folio numbers, and because of orphaned records and other difficulties in the records, it was not always possible for all records to be attributed in I-CeM to the correct geographical location and hence correctly coded. This involved the I-CeM team having to use where possible unstandardized information transcribed from the headings on each page of the enumeration books to try and assign ‘pages’ to parishes, RSDs and RDs. This was further complicated by the fact that, on detailed examination, some (a small number) of pages record data for more than one parish on a single page. UKDS Version 1 of I-CeM contained many misallocations, although that is claimed that these are no more than
ESRC project ES/M010953: WP 23: Bennett, van Lieshout, and Schürer: Missing in the Census 1851-1911, Cambridge University. ±0.5%of all records.17 Considerable effort for the Provisional I-CeM v.2 and preparations for BBCE have resulted in most anomalies being corrected in the data used in this paper. These updates are expected to be available from UKDS in 2020. At RSD level Provisional I-CeM v. 2 reduced locational misallocation errors to minimal levels, and for most years achieved population levels that are within ±5% of published numbers (i.e. the population at risk of being missing or mis-assigned), with almost all RSDs within ±1%. But at parish level a number of inaccuracies remain which are being tackled as work continues. These mainly relate to a few parishes that are attributed a much larger or smaller population compared to the GRO published record. However, almost all of these relate to misallocations between parishes within the same RSD, and mostly in urban areas. Consequently adopting the RSD as the analysis unit in this paper should minimise any remaining effects of I-CeM mis-allocation. Also, because most of the remaining misallocations are between urban parishes in the same town, mapping should lead to relatively few spurious or isolated patterns outside a RSD.
2.4. Other issues influencing estimation of gaps in records.
Finally, several smaller issues result in gaps within the census.
(i) Census recusants: a very small number of people refused to answer the census demand.
(ii) Enumerator errors: These were probably more substantial than recusants, though by the time of the 1851 census this resulted from only a few poor operatives in a few places. Since it will affect the published records as well it cannot be easily detected and can normally be considered as random.
(iii) Absent from census: individuals missing from the census because they were not in the country: those travelling aboard, in the India Service, other colonial service, army, navy or merchant service out of the country or visiting other parts of the UK including Ireland. In addition, those locally resident will not be detected in their residential location if they were visitors elsewhere on census night, or were short-term boarders or lodgers elsewhere; but they should be recorded in the other location.Another category is that in 1851, unlike subsequent
17
Higgs, E., C. Jones, K. Schürer and A. Wilkinson (2015) Integrated Census Microdata (I-CeM) Guide, 2nd ed. 114.
ESRC project ES/M010953: WP 23: Bennett, van Lieshout, and Schürer: Missing in the Census 1851-1911, Cambridge University. years, enumerators were not specifically asked to enumerate those not living in ‘normal’ households. From 1861 enumerators were given specific and explicit instruction to enumerate those in sheds, tents and the like – vagrants and gypsies. Specific counts of these appear in the published records from 1861 but not before. And the geographical variance of these from 1861 suggest that even then they were enumerated to a varying extent across the country – in short vagrants are mostly an invisible population in 1851 and to a greater or lesser degree in subsequent years.
(iv) Errors in clerical analysis: whilst the general level of census preparations by the GRO and clerks for publications is believed to have been very accurate, there would have undoubtedly have been some errors. Errors of counts for an enumeration district were generally minimised or eliminated by the enumerator totalling the CEB entries, which were then checked by GRO clerks. But errors in copying from household schedules to the CEBs, and assignment of CEB records between part parishes and other complexities could easily introduce mis-counts. Clerks had to refer to directories for parish locations, with many detached parts of parishes difficult to track. Subsequent errors could be of a single detached household, or a larger part parish. In preparations of BBCE, for example, it has been found that clerical totalling made a few errors for totals by employment status: despite missing data and any deficient recording by enumerators or responses by householders, there are more employers with large workforces contained in I-CeM than were reported in the GRO published tables for 1851 and farmer tables for all years 1851-81 (see WP 13; and van Lieshout et al., 2020).
2.5. Duplicate records.
A rather different issue results from the existence of duplicate records in the census recording process, although the total number of individuals will be very small. The existence of duplicates makes it more difficult to be sure about the level of any discrepancy between the total of the records in I-CeM for a given spatial unit and the published total, because over-counts occur that mask any lost and missing, and also lead to spurious records in subsequent analysis. Duplicate recording arises from two sources:
(i) Different enumerators covering the same part of an area. The extent of this source of duplication is very limited.
ESRC project ES/M010953: WP 23: Bennett, van Lieshout, and Schürer: Missing in the Census 1851-1911, Cambridge University. (ii) Enumerator error (e.g. by copying records in error and then not deleting the duplicate). Even if deleted these are often scanned as they may be helpful to genealogists, and hence they can remain in I-CeM.
(iii) In addition, more significant duplication derives from the scanning and transcription process. There are some examples of a whole CEB page, or a couple of pages, being scanned twice by FMP. Where this occurs it results in duplicates (in England and Wales) of up to 20 people per page in 1851, 25 people per page in censuses 1861 to 1881, 31 people in 1891 and 1901, and 15 in 1911 (the maximum number of entries on a whole page, if all lines were used; which differed for institutions and Scotland).18 It is unlikely to result in more than 1,000-2,000 duplicate entries in total. This is not usually a concern from a statistical point of view, but leads to minor discrepancies between published and I-CeM records at a local level. In addition there were multiple scans by FMP in the creation of their online database; these were undertaken at different times in response to updates. The updated scans did not always lead to deletion of a previous version of the same CEB pages from the FMP database.
(iv) Finally, but most significantly, the way that the FMP database was stored and passed to Essex and Leicester University teams for the creation of I-CeM resulted in a number of duplicate batches of entries for whole sets of CEBs. This was very substantial for some years, occurs in Scotland as well as England and Wales, and is the main source of duplication in I-CeM. In 1861 it resulted in duplication of a large batch of about 200,000 entries. These duplications differ from the ones identified above in that the records were duplicated after transcription, resulting in entries that were exactly the same. Since the initial UKDS version of I-CeM v.1 was made available most of these duplications have been detected and are corrected in Provisional I-CeM v.2. The analysis here uses a version with the c. 200,000 known duplicate records removed that occur in I-CeM in 1861, and also a few in other years, but they are still in the UKDS I-CeM v. 1. It is also probable that further minor duplication still exists in I-CeM that have not yet been detected because of FMP database structures.For Scotland no corrections to I-CeM for duplication and spatial misallocation had been made other than those listed in WP 20 for the BBCE analysis and data deposit; further work is needed on cleaning the Scottish I-CeM data which is ongoing in 2020.
ESRC project ES/M010953: WP 23: Bennett, van Lieshout, and Schürer: Missing in the Census 1851-1911, Cambridge University. 3. Identifying lost records
The existence of gaps in records from the original CEBs has been known since the archives were publically made available and used by genealogists. When census archives were administered by the PRO at Chancery Lane a number of finding aids were used to help genealogists locate records: mainly indexes of records by folio and piece number, and street indexes by main locations. These paper records were annotated by PRO staff where they themselves detected missing records, or where they were reported by genealogical users and checked by staff. These notes in the old PRO paper finding aids (mainly the street indexes) have been processed by TNA and entered into its catalogue. This catalogue has also been added to by recent experiences of users with the online databases.
This process has been digitised since about 2013, with all the paper-based back-information and new reports of the missing entries now continuously added to the TNA online catalogue, though with some lag to the process. When new missing items are suspected/reported these are manually searched for by TNA checking the online and paper records. If the original records exist, they are then scanned and added to the database via FMP or Ancestry, depending on which census is covered. The missing items are flagged in Discovery (the TNA online catalogue). The new data are passed to FMP or Ancestry for inputting, although there may be a lag of their entry into the online sources ‘by up to 1-2 years’. Lists of missing records are provided on the FMP or Ancestry websites, but these can also lag and hence are not up-to-date guides.
Information on missing census records available on Discovery can be found by searches using the keywords ‘missing’ or ‘wanting’, and restricting the search to the reference for that census; HO 107 for 1841 and 1851, RG 9 for 1861, RG 10 for 1871 and so on, up to RG 14 for 1911.19 This gives information on those parts of parishes or districts that are known by TNA to be missing from their records. This catalogue information in some cases is very incomplete in detail. In some cases it lists the number of missing pages or books; in other cases it has detailed estimates of the number of missing individuals. But many entries just state a census reference as ‘wanting’, ‘missing’ or ‘missing at transfer’ [from GRO to the PRO], or ‘part missing’, with no estimate of numbers.
19
There are instructions for this on the TNA Catalogue https://www.nationalarchives.gov.uk/help-with-your-research/research-guides/census-records/
ESRC project ES/M010953: WP 23: Bennett, van Lieshout, and Schürer: Missing in the Census 1851-1911, Cambridge University. The entries in Discovery derive from four different sources:20
(i) The old paper finding aids from the PRO, which mainly referred to missing folios or pieces; for these almost all have now been entered into Discovery.
(ii) The updating process since 2013 has led to newly identified lost records being entered; these have been checked by TNA staff to give a precise number, or at least some estimate of number of lost (such as ‘missing page’, ‘missing part page’, or ‘fragment’).
(iii) Detailed estimates for some areas have been made as a result of a TNA Records Knowledge Development project on the 1861 census, which was recognised to be the worst year affected by lost records. This project covered 12 counties (2 partially: Monmouthshire and Kent, and 10 more fully: London, Middlesex, Surrey, Sussex, Essex, Hampshire, Hertfordshire, Oxfordshire, Norfolk, and Glamorgan). A mixed method was used: first, in most cases the paper finding aids and other information was used as a starting point to then identify and quantify the extent of lost records, leading to estimated numbers of missing people. Second, a systematic search was made using the original microfilms to identify if the pages on film matched the counts of people in each Enumeration District (ED), or if there was a gap found on the film the original pages were consulted. Counts were made of what existed in surviving records compared with ED summaries to allow the missing to be known/estimated. Some comparison was made against published totals where ED end papers were missing and no population count was contained in the CEBs themselves. However, it was not a systematic check of published population numbers against surviving records. The data from this project are very accurate where detailed information could be obtained. Examples of the missing are: ‘All pages (275 Persons)’ (Welsh St Donats, Cardiff, RG 9/4041, no ED specified, no folios); ‘fragments pages 37-40’ (Hammersmith St. Paul, Kensington, RG 9/0025, ED14, fo. 134-136); ‘9 persons in 2 caravans’ (Great Bookham, Epsom, Surrey: RG 9/0420, ED 9, fo. 146-155).
20
Based on discussions with TNA staff and the brief guide at: http://blog.nationalarchives.gov.uk/blog/missing-from-the-census/
ESRC project ES/M010953: WP 23: Bennett, van Lieshout, and Schürer: Missing in the Census 1851-1911, Cambridge University. This project is of enormous help since it gives, where possible and where inspected by TNA, precise numbers, or estimates of numbers missing. Unfortunately, its utility is limited in several respects. First, many parishes are given in an undifferentiated way, especially in London. For example, several parishes are included under an undifferentiated title such as ‘Paddington’ or ‘Kensington’ within the RD of Kensington, or ‘Hackney’ within the RD of Hackney, or ‘Bethnal Green’ within the RD of Bethnal Green. Fortunately, it includes the piece numbers, which in most cases allows correct allocation to RSDs. Second, although the TNA project aimed to make a full assessment of all entries in the 10 counties (and two more partially), it is clear that this was not always achieved. It appears that in many locations the main focus was on the reported lost sections already known from the paper finding aids since the resulting counts of surviving records do not always match the published.
(iv) Finally, some minor further checking has been made by TNA for areas with suspected gaps. For example, in Yorkshire a process was followed that when a page or a RSD was reported missing, the whole RSD was checked, but this has not be used in other areas in the county; and in Yorkshire only two RSDs were fully checked. This process is now extended by TNA staff to other areas when missing information is found. In addition, since 2017, some checks have been made as a result of exchange with the authors of this paper (in Staffordshire).
It was believed by TNA that it is unlikely that any whole ED or whole parish that is missing has not now been detected. However, the analysis below suggests that this is not the case. The estimates below suggest that there are many lost records still to be identified and catalogued in Discovery. It is hoped that this paper will help to fill these gaps.
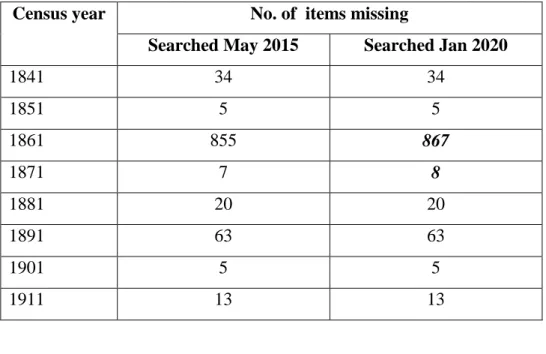
The known lost areas listed in Discovery can be output as a spreadsheet for each year. A total of items gives some indication of the relative scale of missing information between different census years. But this is only a very rough guide since an ‘item’ can mean anything from a page up to a whole parish or even a whole RSD. As clear from Table 1, the largest number of missing items by far is for 1861, with 1891 the next worst year. However, if the percentage of missing population counts in I-CeM is compared with the published figures, after 1861, it is 1901 and 1851 that come out worse, then 1891. The 5 missing items identified by TNA in 1851 are large areas (see below). Quite a number of small items missing relate to ships. The
ESRC project ES/M010953: WP 23: Bennett, van Lieshout, and Schürer: Missing in the Census 1851-1911, Cambridge University. 20 missing pieces identified by TNA for 1881, for instance, all relate to people on vessels with the majority of these relating to fewer than 50 people each.
Census year No. of items missing
Searched May 2015 Searched Jan 2020
1841 34 34 1851 5 5 1861 855 867 1871 7 8 1881 20 20 1891 63 63 1901 5 5 1911 13 13
Table 1. Count of ‘items’ in Discovery related to ‘missing’ and ‘wanting’ by census year
(Source: catalogue searches in 2015 and 2020; changed totals highlighted).
These items may themselves be inaccurate, since of the five items identified for the 1851 Sturminster in Dorset, and the water-damaged 1851 records in the Manchester area are now in FMP and I-CeM. The remaining 3 items in 1851 list an RD that is missing in its entirety: Dunmow in Essex, and 2 RSDs in Newmarket in Cambridgeshire, which are completely missing. However, a comparison between the total I-CeM numbers and the published figures for 1851 shows that an additional 8 RSDs are missing completely (1 in Surrey, 1 in Buckinghamshire, 1 in Somerset, 1 in Durham, 1 in Denbighshire, 1 in the West Riding of Yorkshire, and 2 in the North Riding of Yorkshire), none of which have been identified as having any missing records in the Discovery catalogue. Maps of the missing areas for each year are given below.
As noted, the TNA Discovery catalogue is continually updated with new information when received, but this process is slow as it relies on people discovering and reporting missing items which they may not be aware are missing rather than just unfindable in genealogy searches. Once reported, there is then further delay as FMP and TNA check the records. To give an idea of the speed of this updating process Table 1 includes a comparison of the
ESRC project ES/M010953: WP 23: Bennett, van Lieshout, and Schürer: Missing in the Census 1851-1911, Cambridge University. entries changed in n the TNA Discovery catalogue between May 2015 and January 2020: 4.5 years. As shown in Table 1 updates for only two years have occurred, for 1861 and 1871, which have added 13 ‘items’ in total. For 1861 an additional 12 pieces have been added with about 1730 people known to be ‘missing’ in 1861, and for 1871 one piece with up to about 120 people (using actual counts or allowing for 24 individuals on the pages that have space for 25 entries). For 1861 the additions are as follows, quoted in the format of the TNA catalogue entries:
Staffordshire, RSD 2 Tipton, Parish: Tipton, missing pages: ED 4; 39-44 (117 persons);
ED 5?; 17-24, unknown number of pages 39-end. ED 10; 37-38, 41-44 (127 persons).
ED 16; Title page only, ED 20; 37-40 (93 persons); ED21; Title page only. ED 26; 61 (20 persons).
Staffordshire, RSD 3 Kingswinford. Parish: Kingswinford (Staffs), missing pages: ED22: Pages 49-50
Lancashire, RSD 1 St Martin. Parish: Liverpool Ward: Scotland, missing pages: ED 29; 61-63 (60 persons).
ED 37A 1-6, 8, 13-14 (several pages damaged)
ED 40 45-46, 49-53 (161 persons); from unidentified ED 1-6. ED 44; 58-65 (191 persons).
ED 52; 75 (20 persons). ED 56; 35-44 (240 persons).
Lancashire, RSD 5 St Thomas. Parish: Liverpool Ward: Pitt Street and Great George. ED 1 pages 1-28 missing.
Cardiganshire, RSD 4 Rheidol, part missing:
Parishes: Llanfinhangelycroyddin, Llanafan, and Llanbadarnfawr (part) (Divided between RG 9/4195-4200); Hamlet: Upper Llanbadarnycroyddin; Hamlet: Lower Llanbadarnycroyddin (reported missing, April 2017).
For 1871 the one additional missing item added was:
Monmouthshire, RSD 3 Rock Bedwellty, Civil Parish Ishlawrcoed: missing pages: ED 5: 5-10
ESRC project ES/M010953: WP 23: Bennett, van Lieshout, and Schürer: Missing in the Census 1851-1911, Cambridge University. This rate of improvement of identification of the missing is very small compared to the number of missing that still remain to be identified, as shown below.
The rest of this paper initially focuses on gaps in the 1861 census as this is the year with the largest deficiency. Then each of the other years is assessed: for 1851, then 1881, 1891, 1901 and 1991. Data for 1871 are not assessed as this census year is unavailable in I-CeM,21 and 1841 is also not yet available in I-CeM.
4. Estimating census gaps in 1861
The 1861 England and Wales census was particularly badly affected by losses at the stage of storage of the original CEBs.22 When the records were moved from their previous storage to TNA, some pieces and parts of pieces were never delivered, while others were partially damaged. Since these records were never scanned, they were never transcribed into FMP and hence never made it into I-CeM or BBCE. TNA believed that for the 1861 census around 3-5% of household records were affected by this, a number that is similar to our calculations of 3.7% missing data in I-CeM. These gaps in coverage are geographically concentrated, with the majority in London and Wales.
This section seeks to estimate the numbers of individuals in the 1861 I-CeM records, combining the information from TNA catalogue lost entries with analysis of the I-CeM database and published information on population numbers by location. The I-CeM numbers used here are based on Provisional I-CeM v. 2, with an additional patch to reallocate miss-assigned items found in Bethnal Green.23 The chosen level of analysis is the Registration Sub Districts (RSDs), which are compared against the published numbers given by GRO census reports, before any records were lost.
The following are constraints on the analysis:
21
As noted earlier, BBCE only includes entrepreneurs in 1871, which prevents assessment of missing data in the entire population.
22 The I-CeM documentation indicates 1851 was particularly badly affected. This was probably a result of the
ca. 200,000 duplicate records identified in the I-CeM v. 1 for 1861, which masked its missing records and made that year seem better than it was.
23
Provisional I-CeM v. 2 removed the ca. 200,000 duplicate records occurring in the UKDA I-CeM v. 1 for 1861.
ESRC project ES/M010953: WP 23: Bennett, van Lieshout, and Schürer: Missing in the Census 1851-1911, Cambridge University. (i) Provisional I-CeM v. 2 still contains some misallocations at parish level, and small discrepancies from the published tables at RSD level. The corrections to I-CeM between versions 1 and 2 were aimed to be correct to within ±5% of the published population of RSDs. Although corrections were also made at parish level, it is recognised that these do not always achieve an accuracy of ±5%. This makes detection of actually missing records uncertain for some parishes, and possible only to the level of ±5% at RSD level, though in practice almost all RSD totals are now within ±1% of published totals.
(ii) The I-CeM data were derived from FMP in circa 2005-7 and therefore do not contain any of the more recent TNA/FMP updating of information on lost records. However, the updating by FMP since 2005-7 has been small, certainly when compared to the amount of actually lost census records.
(iii) The TNA catalogue identifies some of the pages or pieces that have been lost, sometimes with an exact estimation number of the number of missing people, sometimes with pages, and sometimes just a note that part was missing. Where exact numbers are not given by TNA an estimate has been used here which assumes that there are 24 entries per page.24
Of these constraints the most important is likely to be discrepancies left in the data that arise from I-CeM coding and attribution errors.
4.1. ‘Lost’ vs ‘Missing in I-CeM’
It is important to make a distinction of the ‘gaps in I-CeM’ between the records that were lost before the scans were made of the TNA records, and those records that exist at TNA but are missing or mis-attributed through FMP and I-CeM processes. The former are irrecoverable: the ‘lost’. The latter exist in the original TNA records but not in I-CeM as currently specified: referred to here as ‘missing in I-CeM’. For these latter, they may actually exist in I-CeM but cannot be allocated to the correct location because there is insufficient information on the image pages of the CEB, or are otherwise unidentifiable by RSD location. It is important to
24 The 1861 CEBs had space for 25 people on a page. However, an examination of enumerator summary sheets
shows that rarely more than half of all schedules in an ED were fully filled up. Sheets with 24 or 23 names were the most frequent filling, as enumerators allowed for gaps between households, or accommodated longer occupational strings. Hence 24 was used as a normal maximum entries per page.
ESRC project ES/M010953: WP 23: Bennett, van Lieshout, and Schürer: Missing in the Census 1851-1911, Cambridge University. know the extent of these latter missing records, and also to assess if it may be possible to reassign people between parishes or RSDs to fit their proper spatial location for some of the ‘missing in I-CeM’. This section first presents the total gaps as they appear in I-CeM when compared with published; then assesses those within this total that are ‘lost’. This then allows assessment of those within the total that are ‘missing in I-CeM’.
4.2. Comparison of total gaps: I-CeM vs. published
The total numbers of population in each RSD can be compared with the numbers published by GRO before any records were lost. This comparison is shown in Figure 1 and summarised in Tables in section 5. The comparison shows that 5 RSDs are missing in their entirety; two in London, and one each in three counties:
London: Belgrave (55,113 people, including Buckingham Palace)
London: Woolwich Arsenal (18,776 people)
Cambridgeshire: Ely (7,919 people)
Oxfordshire: Woodstock (7,778 people)
Denbighshire: Llanelidan (2,684 people)
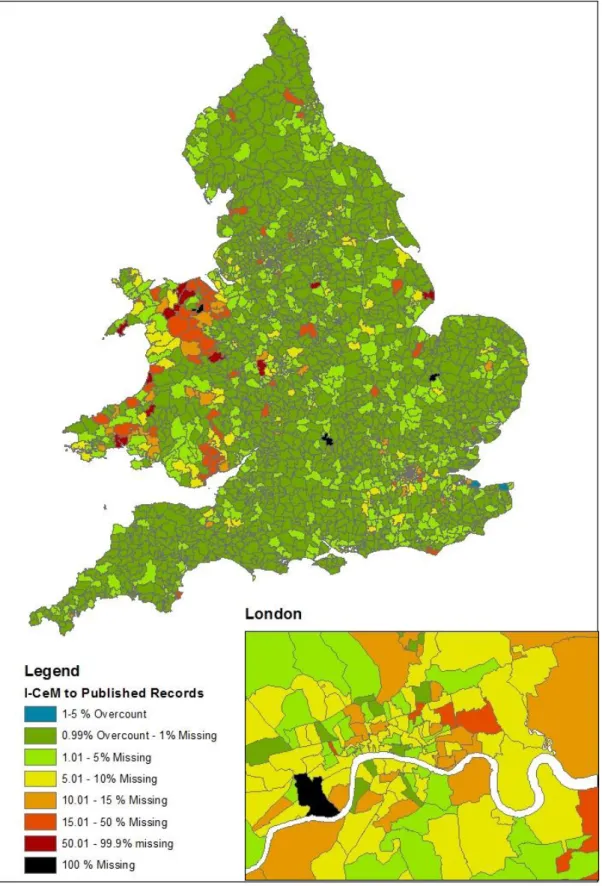
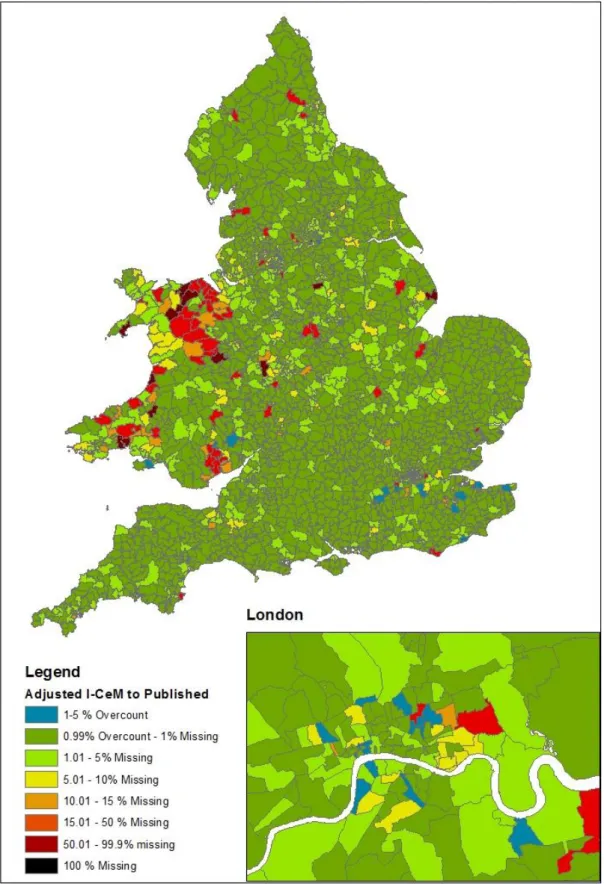
Apart for these five RSDs, an important result is that in Provisional I-CeM v. 2 the vast majority of RSDs have the correct or very close numbers to those in GRO published reports: 1,362 RSDs (62%) fall within ±1% of their published totals, with a further 528 (24%) up to the 5% of the published total. This leaves 300 RSDs (14%) that have 5% or more of their published populations missing. About half (140) of these have 10% or over missing, with 17 of those missing more than half of their population, while a few have over-counts. The patterns are mapped in Figure 1. It is in 140-300 RSDs where we expect most of the ‘lost’ records to be concentrated.
Although the overall match of I-CeM and published records is close for most RSDs, a few RSDs in I-CeM contain more people than they should according to the published records, but only four contain more than 1% over their published estimate. These are Eastchurch in Kent (41 or 2.6% too many), Lady Wood in Birmingham (483 or 1.4%), Minster in Kent (48 or 1.3% over), and St Paul in Bristol (175 or 1.1% too many). These are all small numbers that represent RSDs that either (i) have high percentage over-estimates in I-CeM because they are
ESRC project ES/M010953: WP 23: Bennett, van Lieshout, and Schürer: Missing in the Census 1851-1911, Cambridge University. very small RSDs, resulting in one or two misallocated or duplicated pages having a disproportionate effect on the percentage comparisons; (ii) or they are urban areas where boundary issues are complex and it is quite possible for the match of the census coding in I-CeM to be imperfect against the micro-detail of local civil and ecclesiastical parishes, poor law unions and so on used by the census. While these over-counts could explain some of the missing records in the RSDs surrounding them, in none of these RSDs would this make a significant impact.25 As a result, these RSDs are not a concern for the overall comparisons in this paper, but must be borne in mind when interpreting I-CeM for 1861.
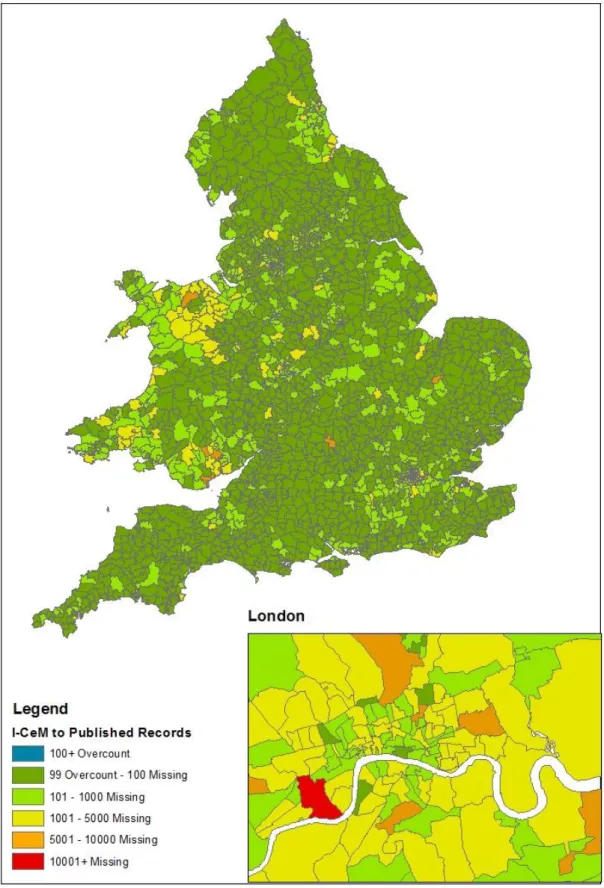
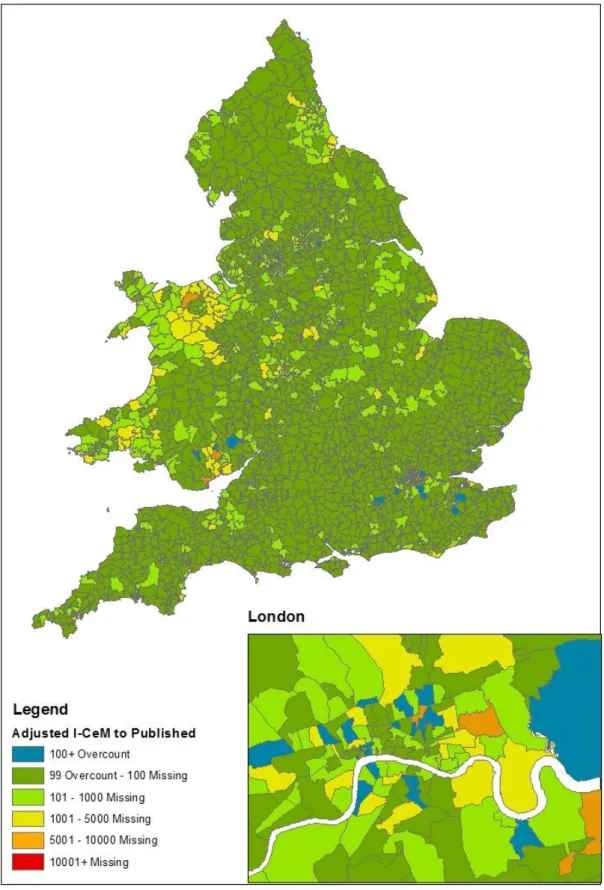
It is also important to bear in mind that the size of RSDs varies, and those in rural areas often have much lower populations than those in urban areas. So the large areas of the Figure 1 in North and West Wales with gaps in data are of less significance than their spatial area suggests. Figure 2 shows the same mapping of gaps for total numbers rather than percentages. This indicatesthat there are only two RSDs where more than 10,000 people are missing, both are the London RSDs that are missing as a whole. A further 15 RSDs have between 5,000 and 10,000 missing people, these include 2 of the other missing RSDs, as well as 6 other London RSDs. The majority of RSDs with undercounts have under 100 people missing; to put this in context, this amounts to 4 CEB pages.
25 For all 4 cases, an analysis was run in which the surplus number was added to each of the neighbouring RSDs.
None of the missing percentage changed by more than a few decimal points, and none of the RSDs would change their category as depicted in figure 1.
ESRC project ES/M010953: WP 23: Bennett, van Lieshout, and Schürer: Missing in the Census 1851-1911, Cambridge University.
Figure 1: 1861 percentage differences of I-CeM population counts compared to the
ESRC project ES/M010953: WP 23: Bennett, van Lieshout, and Schürer: Missing in the Census 1851-1911, Cambridge University.
Figure 2: 1861 differences in absolute numbers between I-CeM population counts and the
ESRC project ES/M010953: WP 23: Bennett, van Lieshout, and Schürer: Missing in the Census 1851-1911, Cambridge University.
4.3. ‘Lost’ records
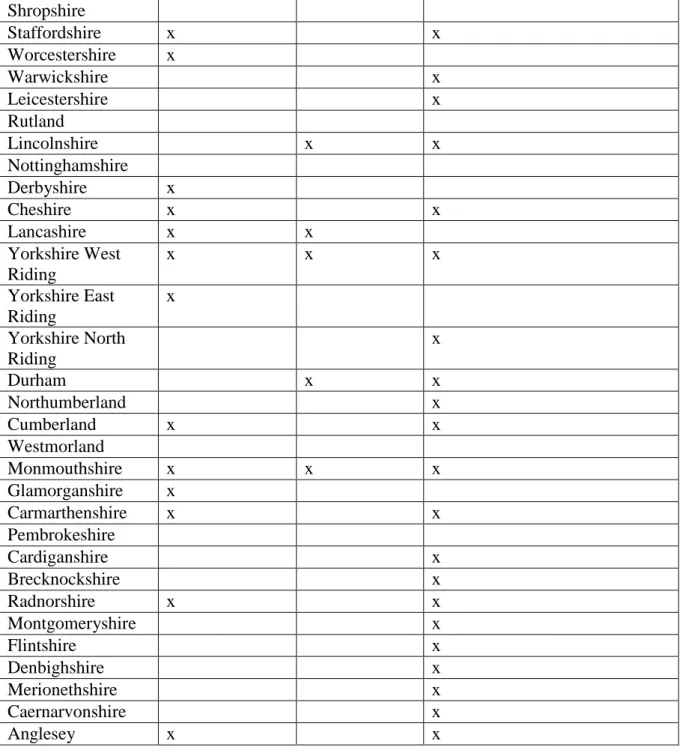
As shown in Table 1, the TNA Catalogue lists 857 items which are completely or partially missing for the 1861 census. In some cases these items provide exact numbers, in others cases they are specified as missing pages, whilst others are just noted as ‘missing partially or in whole’. Where exact numbers are given TNA based them on the surviving pages compared to the totals given for the Enumerator District at the end of each ED book in the CEB. If that page was missing there was nothing to compare the population numbers with, and TNA resorted to only giving the number of missing pages. Some of these catalogues entries are based on the TNA Records Knowledge Development project of 12 counties (which covers almost all of the exact numbers given), while the remainder derive solely from listing the previous paper finding aids and subsequent updating from user comments. Table 2 lists areas where exact numbers are known, areas where only ranges are given, and areas that are mixed. It also shows the areas, most notably south-west England, where no lost records have been detected at all.
County Exact numbers Page numbers ‘Missing partially or in whole’
London x x Surrey x Kent x x x Sussex x Hampshire x x x Berkshire x Middlesex x Hertford x Buckinghamshire x x Oxfordshire x x Northamptonshire x Huntingdonshire Bedfordshire Cambridgeshire x Essex x Suffolk x Norfolk x Wiltshire Dorset Devon Cornwall Somerset Gloucestershire Herefordshire
ESRC project ES/M010953: WP 23: Bennett, van Lieshout, and Schürer: Missing in the Census 1851-1911, Cambridge University. Shropshire Staffordshire x x Worcestershire x Warwickshire x Leicestershire x Rutland Lincolnshire x x Nottinghamshire Derbyshire x Cheshire x x Lancashire x x Yorkshire West Riding x x x Yorkshire East Riding x Yorkshire North Riding x Durham x x Northumberland x Cumberland x x Westmorland Monmouthshire x x x Glamorganshire x Carmarthenshire x x Pembrokeshire Cardiganshire x Brecknockshire x Radnorshire x x Montgomeryshire x Flintshire x Denbighshire x Merionethshire x Caernarvonshire x Anglesey x x
Table 2. Comparison of TNA catalogue entries with the data given on the missing by TNA
on exact numbers, ranges, or mixed.
The TNA 12-counties project covered 10 counties fully:
London, Middlesex, Surrey, Sussex, Essex, Hampshire, Hertfordshire, Oxfordshire, Norfolk, and Glamorgan
and 2 counties partially:
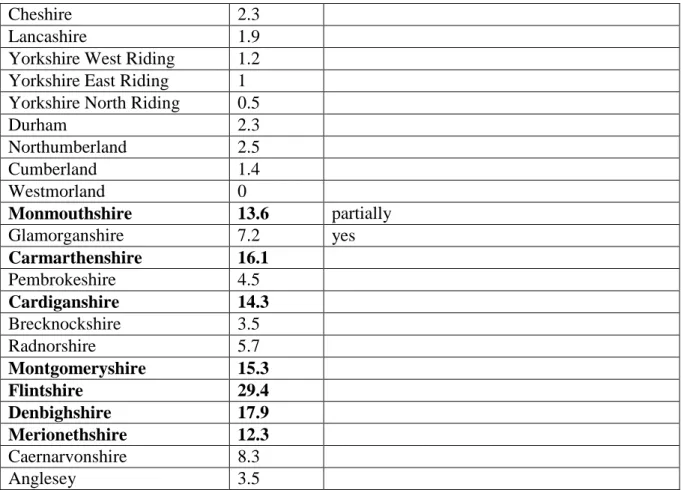
ESRC project ES/M010953: WP 23: Bennett, van Lieshout, and Schürer: Missing in the Census 1851-1911, Cambridge University. Unfortunately it appears that, although an intention was for the 12-counties TNA Records Knowledge Development project to focus on the worst areas of missing records in 1861, they only cover the worst areas in part. Table 3 lists the percentage missing for each county and those included in the TNA Records Knowledge Development project. TNA seem to have worked from London outwards, with the addition of southern Wales. This means that some of the worst affected areas, such as North Wales (which has particularly high rates of missing), other parts of South Wales, Staffordshire, Shropshire, Cambridgeshire, and N.E. England, were not included.
County %Missing Included in TNA 12-counties project
London 9.6 yes Surrey 3.7 yes Kent 1.8 partially Sussex 3.5 yes Hampshire 1.4 yes Berkshire 0.9 Middlesex 1.1 yes Hertford 1.2 yes Buckinghamshire 0.3 Oxfordshire 5.2 yes Northamptonshire 1.6 Huntingdonshire 0.7 Bedfordshire 0.5 Cambridgeshire 3.3 Essex 1.8 yes Suffolk 0.7 Norfolk 0.9 yes Wiltshire 0.2 Dorset 0.4 Devon 0.9 Cornwall 1 Somerset 1.2 Gloucestershire 1 Herefordshire 0.5 Shropshire 2.9 Staffordshire 3.7 Worcestershire 1.6 Warwickshire 1.1 Leicestershire 1 Rutland 1.8 Lincolnshire 1.7 Nottinghamshire 0.5 Derbyshire 1.8
ESRC project ES/M010953: WP 23: Bennett, van Lieshout, and Schürer: Missing in the Census 1851-1911, Cambridge University.
Cheshire 2.3
Lancashire 1.9
Yorkshire West Riding 1.2
Yorkshire East Riding 1
Yorkshire North Riding 0.5
Durham 2.3 Northumberland 2.5 Cumberland 1.4 Westmorland 0 Monmouthshire 13.6 partially Glamorganshire 7.2 yes Carmarthenshire 16.1 Pembrokeshire 4.5 Cardiganshire 14.3 Brecknockshire 3.5 Radnorshire 5.7 Montgomeryshire 15.3 Flintshire 29.4 Denbighshire 17.9 Merionethshire 12.3 Caernarvonshire 8.3 Anglesey 3.5
Table 3. Comparison of percentage missing for each county, and those included in the TNA
project.
For the comparisons made here, the ‘lost’ records identified by TNA have to be located to their correct parish and RSD spatial location as coded in I-CeM. The data from the TNA catalogue entries and the TNA Records Knowledge Development project are available by RD, RSD, administrate piece number, often Enumeration District, and parish name. These catalogue entries were parsed into fields, and then locational names or other identifiers used to match the equivalent locations coded in I-CeM by parish (PARID). Some lost records covered multiple RSDs, and when it was unclear where the ‘lost’ records belonged, they were assigned to the RSD from which most people were missing. Similarly, some TNA catalogue entries referring to EDs were split in I-CeM and were allocated between the different units. As a result, some approximations have to be accepted from this matching exercise. The TNA descriptions of missing entries were then translated into estimates of missing population according to the information available:
ESRC project ES/M010953: WP 23: Bennett, van Lieshout, and Schürer: Missing in the Census 1851-1911, Cambridge University. (ii) Page numbers identified by TNA, reinterpreted as numbers of individuals using a
multiplier x 24 for a full page missing in 1861, and an estimate of 6 people for partially missing pages or ‘fragments’,
(iii) Unspecified numbers known to be missing. These numbers are sometimes known to be the whole of one ED, but with the varying sizes of EDs these cannot be readily converted into pages/individuals. In some cases, unspecified numbers were known to be missing in addition to a known number missing in a certain RSD, but in the majority of cases all that was known about an RSD was that there was some data missing.
The resulting estimate of ‘lost’ people for the 1861 census is mapped in Figure 3. This shows a much more concentrated pattern than for the total match of I-CeM and published (Figure 2).
ESRC project ES/M010953: WP 23: Bennett, van Lieshout, and Schürer: Missing in the Census 1851-1911, Cambridge University.
ESRC project ES/M010953: WP 23: Bennett, van Lieshout, and Schürer: Missing in the Census 1851-1911, Cambridge University.
4.4. ‘Missing in I-CeM’
The estimation of the known ‘lost’ records allows a test of the rest of the records in I-CeM to determine which areas are subject to remaining gaps. Subtracting the total of the estimated numbers of known ‘lost’ from the people that are not recorded in I-CeM for each RSD yields the estimate of the ‘missing in I-CeM’ for 1861. This also introduces new over-counts in some areas where the identified lost records added to the records assigned to that RSD exceed the published record. These indicate some possibly misallocated populations in the I-CeM process, although all are within the 5% range used by I-CeM. The ‘missing in I-CeM’ for 1861 are shown in Figure 4. The main concentration of missing is still as shown in Figures 1 and 2: in North Wales, Monmouthshire, scattered areas in London (which has many of the newly introduced over-counts), Staffordshire, Derbyshire, and a few other areas. However, the use of the TNA data on known ‘lost’ indicates that many of the gaps in I-CeM are explained by lost records, with 1,997 RSDs now within the 5% range of their published numbers, an improvement of 107.
However, this analysis has shown that the main areas where there are remaining discrepancies between I-CeM totals and published numbers are still quite numerous and it is likely that many of these are ‘lost’ from TNA records but have not yet been identified as such. Although there are remaining misallocations in I-CeM, particularly in London, given that these use FMP records from 2005-7 that have had only a small number of people subsequently added, the I-CeM gaps cannot be large enough to account for all the discrepancies shown in Figures 4 and 5. The results indicate that a much more detailed examination is needed of TNA records to identify records that must be ‘lost’ in North Wales, Monmouthshire, Staffordshire, Derbyshire, and some other scattered RSDs mainly in the north of England, Midlands, and West Wales. For the moment, however, we cannot be sure how many of these discrepancies are definitely ‘lost’ or arise from issues in the FMP and I-CeM coding processes (though it is suspected that the majority are truly ‘lost’).
ESRC project ES/M010953: WP 23: Bennett, van Lieshout, and Schürer: Missing in the Census 1851-1911, Cambridge University.
ESRC project ES/M010953: WP 23: Bennett, van Lieshout, and Schürer: Missing in the Census 1851-1911, Cambridge University.
ESRC project ES/M010953: WP 23: Bennett, van Lieshout, and Schürer: Missing in the Census 1851-1911, Cambridge University.
5.Estimating census gaps in 1851, and 1881-1911
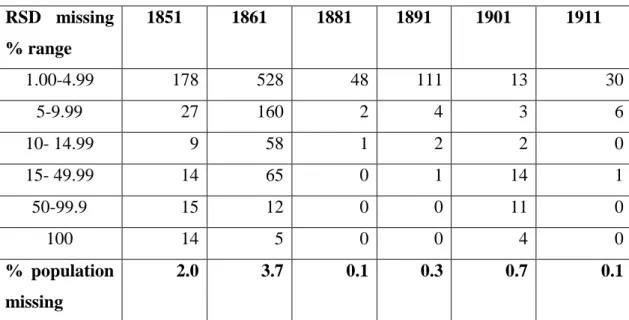
The same methods can in principle be applied to estimating ‘lost’ records, and ‘missing in I-CeM’ for the other years. This is done for each of the other censuses below (except for 1871, which is not in I-CeM). The numbers lost by RSD are summarised in Table 4.
RSD missing % range 1851 1861 1881 1891 1901 1911 1.00-4.99 178 528 48 111 13 30 5-9.99 27 160 2 4 3 6 10- 14.99 9 58 1 2 2 0 15- 49.99 14 65 0 1 14 1 50-99.9 15 12 0 0 11 0 100 14 5 0 0 4 0 % population missing 2.0 3.7 0.1 0.3 0.7 0.1
Table 4. Number of RSDs with missing population, and total missing population 1851-1911
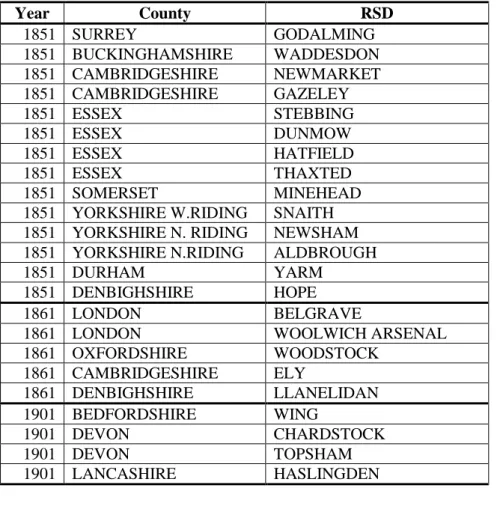
Tables 5 and 6 list RSDs by year that have missing records. Table 5 contains the RSDs which are wholly missing, and Table 6 those with 50-99% missing records. The rest of the RSDs with between 5 and 49.9% missing are listed in Table 7. This shows that there is a major gap between those RSDs that are relatively badly affected by missing data and those that have only 5% or less records potentially missing. The way that I-CeM is coded, and the tolerance level of 5% used in I-CeM processing as a signal of potential spatial misallocations, suggests that all those RSDs below the 5% level have few if any missing data, though some minor misallocations may still apply at parish and even RSD level. But for those at the next level up, shown in Table 7, the gaps are much larger: a minimum of 15% in 1851 and 1861, 21% in 1891, 16% in 1901, and 31% in 1911. Moreover the smallest gaps are mostly in RSDs with large populations where a large percentage error is less likely to occur purely from a few parishes or individuals misallocated by I-CeM coding. For this reason we believe that all these RSDs have genuine large numbers of records that are lost from TNA records. Their
ESRC project ES/M010953: WP 23: Bennett, van Lieshout, and Schürer: Missing in the Census 1851-1911, Cambridge University. identification here provides an opportunity for TNA to implement a targeted search strategy to check for those that are truly missing.
Year County RSD 1851 SURREY GODALMING 1851 BUCKINGHAMSHIRE WADDESDON 1851 CAMBRIDGESHIRE NEWMARKET 1851 CAMBRIDGESHIRE GAZELEY 1851 ESSEX STEBBING 1851 ESSEX DUNMOW 1851 ESSEX HATFIELD 1851 ESSEX THAXTED 1851 SOMERSET MINEHEAD
1851 YORKSHIRE W.RIDING SNAITH 1851 YORKSHIRE N. RIDING NEWSHAM 1851 YORKSHIRE N.RIDING ALDBROUGH
1851 DURHAM YARM
1851 DENBIGHSHIRE HOPE
1861 LONDON BELGRAVE
1861 LONDON WOOLWICH ARSENAL
1861 OXFORDSHIRE WOODSTOCK 1861 CAMBRIDGESHIRE ELY 1861 DENBIGHSHIRE LLANELIDAN 1901 BEDFORDSHIRE WING 1901 DEVON CHARDSTOCK 1901 DEVON TOPSHAM 1901 LANCASHIRE HASLINGDEN
Table 5. RSDs with 100% missing population by year .
Year County RSD %
Missing
1851 LANCASHIRE ARDWICK 55.20
1851 YORKSHIRE W.RIDING LIVERSEDGE 60.58
1851 YORKSHIRE W. RIDING GOOLE 60.69
1851 CARMARTHENSHIRE ST CLEARS 61.19
1851 SOMERSET DUNSTER 67.85
1851 YORKSHIRE E.RIDING POCKLINGTON 71.70
1851 BERKSHIRE EGHAM 71.88
1851 LANCASHIRE WIGAN 80.71
1851 WARWICKSHIRE WARWICK 80.88
1851 YORKSHIRE W.RIDING BILTON 82.27
1851 GLOUCESTERSHIRE ST PAUL 82.87 1851 PEMBROKESHIRE ST.DAVIDS 83.44 1851 SOMERSET BATHEASTON 87.17 1851 NOTTINGHAMSHIRE KNEESAL 90.62 1851 DURHAM WOLSINGHAM 99.17 1861 DENBIGHSHIRE YSPYTTY 50.02 1861 CARMARTHENSHIRE ST. CLEARS 51.92
ESRC project ES/M010953: WP 23: Bennett, van Lieshout, and Schürer: Missing in the Census 1851-1911, Cambridge University. 1861 LINCOLNSHIRE BURGH 52.96 1861 CARNARVONSHIRE PWLLHELI 54.20 1861 CARDIGANSHIRE ABERYSTWITH 56.26 1861 MONTGOMERYSHIRE CHIRBURY 58.51 1861 DENBIGHSHIRE ABERGELE 59.42 1861 SHROPSHIRE WORFIELD 59.72 1861 DENBIGHSHIRE DENBIGH 60.39 1861 DERBYSHIRE DRONFIELD 67.59
1861 YORKSHIRE W.RIDING SOOTHILL 74.62
1861 CARDIGANSHIRE PENCARREG 91.59
1901 BEDFORDSHIRE BIGGLESWADE 50.72
1901 LANCASHIRE STANDISH 55.15
1901 SUSSEX ORE 61.59
1901 LANCASHIRE HEATON 64.79
1901 DEVON OTTERY ST MARY 69.47
1901 DEVON HONITON 77.44
1901 DEVON COLYTON 77.76
1901 DEVON EXMOUTH 78.86
1901 DEVON AXMINSTER 82.97
1901 KENT DEAL 90.04
1901 YORKSHIRE W. RIDING ELLAND 97.86
Table 6. RSDs with over half population missing by year
Year County RSD %
Missing
1851 CORNWALL PENRYN 15.03
1851 LANCASHIRE ASHTON TOWN 16.68
1851 DURHAM DARLINGTON 16.83
1851 YORKSHIRE E. RIDING MYTON 21.25
1851 LANCASHIRE OLDHAM BELOW TOWN 21.79
1851 MONMOUTHSHIRE ROCK BEDWELTY 21.94
1851 DURHAM AYCLIFFE 22.07
1851 MONTGOMERYSHIRE CHIRBURY 24.35
1851 LONDON ST PAUL DEPTFORD 28.24
1851 BUCKINGHAMSHIRE ASTON-CLINTON 30.58
1851 LANCASHIRE PENDLETON 33.01
1851 PEMBROKESHIRE PEMBROKE 34.73
1851 NORTHUMBERLAND WESTGATE 35.62
1851 LANCASHIRE HOWARD STREET 49.86
1861 DENBIGHSHIRE ST ASAPH 15.20 1861 LONDON ELTHAM 15.25 1861 WORCESTERSHIRE HANLEY 15.60 1861 FLINTSHIRE WHITFORD 15.77 1861 DENBIGHSHIRE RUTHIN 15.82 1861 CARMARTHENSHIRE CONWIL 15.95 1861 GLAMORGANSHIRE CARDIFF 15.98 1861 LANCASHIRE ELLEL 16.09
1861 HAMPSHIRE PORTSEA TOWN 16.20
1861 LONDON TOWN 16.21
1861 MONTGOMERYSHIRE POOL 16.58