Louisiana State University
LSU Digital Commons
LSU Doctoral Dissertations Graduate School
2016
Molecular Genetics of Salinity Tolerance in Rice
(Oryza sativa L.)
Teresa Bermejo De Leon
Louisiana State University and Agricultural and Mechanical College, tdeleon@lsu.edu
Follow this and additional works at:https://digitalcommons.lsu.edu/gradschool_dissertations
Part of thePlant Sciences Commons
This Dissertation is brought to you for free and open access by the Graduate School at LSU Digital Commons. It has been accepted for inclusion in LSU Doctoral Dissertations by an authorized graduate school editor of LSU Digital Commons. For more information, please contactgradetd@lsu.edu. Recommended Citation
De Leon, Teresa Bermejo, "Molecular Genetics of Salinity Tolerance in Rice (Oryza sativa L.)" (2016).LSU Doctoral Dissertations. 4426.
MOLECULAR GENETICS OF SALINITY TOLERANCE IN RICE (ORYZA SATIVA L.)
A Dissertation
Submitted to the Graduate Faculty of the Louisiana State University and Agricultural and Mechanical College
in partial fulfillment of the requirements for the degree of
Doctor of Philosophy in
The School of Plant, Environmental, & Soil Sciences
by
Teresa Bermejo De Leon
B.S. University of the Philippines Los Baños, 2000 M.S. University of the Philippines Los Baños, 2007
ACKNOWLEDGMENTS
I would like to thank my advisor Dr. Prasanta K. Subudhi, who has helped me and guided me in this entire time of my degree program. He has given me the opportunities to equip myself and advance my career development. I would like to thank Dr. Stephen Harrison; he has taught us essential and practical things in plant breeding that inspired me to be a plant breeder in the future. I would also like to thank my committee members Dr. James Oard, and Dr. Dong-Ha Oh. They had given me advice and guidance that helped me throughout this process. Additionally, I would like to thank Dr. Brian Irving for serving as Dean’s Representative in my doctoral committee.
I would like to thank Dr. Brenda Tubaña and Dr. Lewis Gaston for allowing me to use their laboratories for plant digestion and analysis. I would also like to thank Anna Borjas, Marisol Orellana, and Haley Miller for assisting me in my hydroponics experiments, plant measurements, and laboratory work in exchange of learning something. My greenhouse experiments during summers would not have been easier without the help of Anna, my husband and kids, Althea and Hannah. They have helped me in watering my plants, tagging for flowering dates, data
collection, and harvesting. I sincerely would like to thank Dennis Alcalde for his patience in weighing and counting the filled and unfilled grains of my plants. I certainly would not have been able to do three chapter-experiments and more without his love, help and support. Lastly, I would like to thank my mother, families and friends in the Philippines and in Baton Rouge for all the support and encouragement all this time.
TABLE OF CONTENTS
ACKNOWLEDGMENTS ... ii
LIST OF TABLES ... vi
LIST OF FIGURES ... viii
LIST OF ABBREVIATIONS ... ix
ABSTRACT... xii
CHAPTER 1. IN TRODUCTION ... 1
1.1 Rice: importance and production ... 1
1.2 Salinity stress and effects on rice plants ... 2
1.3 Mechanisms of salinity tolerance... 3
1.4 Genetics and QTL mapping of salinity tolerance ... 4
1.5 Rationale for research ... 5
1.6 References ... 6
CHAPTER 2. GENETIC VARIATION IN SOUTHERN USA RICE GENOTYPES FOR SEEDLING SALINITY TOLERANCE* ... 9
2.1 Introduction ... 9
2.2 Materials and methods ... 10
2.2.1 Plant materials... 10
2.2.2 Screening for salinity tolerance at seedling stage ... 13
2.2.3 Statistical analyses ... 15
2.2.4 Genetic diversity analysis ... 16
2.3 Results ... 17
2.3.1 Phenotypic response to salinity stress ... 17
2.3.2 Correlation of traits related to salinity tolerance ... 20
2.3.3 Classification of 49 rice genotypes for salinity tolerance ... 20
2.3.4 Differentiation of salinity groups by canonical discriminant function and MANOVA ... 23
2.3.5 Genetic diversity of 49 rice genotypes... 26
2.4 Discussion ... 28
2.5 Conclusion ... 34
2.6 References ... 35
CHAPTER 3. MOLECULAR DISSECTION OF SEEDLING SALINITY TOLERANCE OF RICE (ORYZA SATIVA L.) USING A HIGH-DENSITY GBS-BASED SNP LINKAGE MAP* ... 40
3.1 Introduction ... 40
3.2 Materials and methods ... 42
3.2.1 Plant materials and population development ... 42
3.2.3 Measurement of Na+ and K+ concentration in shoot... 44
3.2.4 Statistical analyses ... 44
3.2.5 Genotyping-by-sequencing of Bengal, Pokkali, and RIL population ... 45
3.2.6 Construction of linkage map and QTL analysis ... 45
3.2.7 Candidate gene prediction... 47
3.3 Results ... 48
3.3.1 Phenotypic characterization under salt stress ... 48
3.3.2 Correlation of traits ... 49
3.3.3 Linkage mapping... 52
3.3.4 Identification of additive and di-genic epistatic QTLs for traits related to salinity tolerance ... 52
3.3.5 Quality and accuracy of Q TL mapping... 64
3.3.6 Identification of candidate genes in the Q TL regions ... 66
3.4 Discussion ... 69
3.5 Conclusion ... 80
3.6 References ... 80
CHAPTER 4. IDENTIFICATION AND VALIDATION OF STABLE QTLS FOR SEEDLING SALINITY TOLERANCE IN INTROGRESSION LINES (ILS) OF POKKALI IN BENGAL BACKGROUND ... 86
4.1 Introduction ... 86
4.2 Materials and methods ... 88
4.2.1 Plant material and evaluation for salt tolerance ... 88
4.2.2 Statistical analyses ... 89
4.2.3 Genotyping of ILs using SSR and SNP markers ... 89
4.2.4 Estimation of genome composition and QTL analysis for traits related to salinity tolerance ... 90
4.3 Results ... 91
4.3.1 Phenotypic evaluations ... 91
4.3.2 Evaluation of genome composition and construction of ILs by SSR markers ... 93
4.3.3 Evaluation of genome composition and construction of ILs by GBS-SNP markers .. 98
4.3.4 QTL analysis for traits related to salinity tolerance ... 99
4.3.5 Comparison of QTLs in ILs and RILs ... 118
4.3.6 Analysis of tolerant ILs... 120
4.4 Discussion ... 121
4.4.1 Phenotypic response of ILs under salinity stress ... 123
4.4.2 Genome composition of ILs by SSR and SNP markers ... 124
4.4.3 QTLs for traits related to seedling salinity tolerance ... 125
4.4.4 Important QTLs and ILs ... 129
4.5 Conclusion ... 130
4.6 References ... 130
CHAPTER 5. CONCLUSIONS ... 135 APPENDIX A: PERMIT TO REPRINT CONTENT OF DE LEON, T.B., LINSCOMBE, S., GREGORIO, G., AND SUBUDHI, P.K. (2015). GENETIC VARIATION IN SOUTHERN
USA RICE GENOTYPES FOR SEEDLING SALINITY TOLERANCE.
FRONT. PLANT SCI. 6:374. DOI:10.3389/FPLS.2015.00374 ... 138
APPENDIX B: SUPPORTING TABLES TO CHAPTER 2 ... 141
B.1 Mean trait values of rice genotypes in salinity characterization. ... 141
B.2 List of SSR markers and allele variations across 49 rice genotypes ... 143
B.3 Posterior probability of membership in salinity groupings by linear discriminant analysis... 147
B.4 Canonical discriminant analysis between salinity grouping and trait responses to salinity stress ... 148
B.5 Total canonical structure of canonical discriminant function and class means of salinity group to canonical discriminant function ... 149
B.6 P-value for pairwise comparison of LS means between salinity groups (i/j) ... 149
APPENDIX C: PERMIT TO REPRINT CONTENT OF DE LEON, T.B., LINSCOMBE, S., AND SUBUDHI, P.K. (2016). MOLECULAR DISSECTION OF SEEDLING SALINITY TOLERANCE IN RICE (ORYZA SATIVA L.) USING A HIGH-DENSITY GBS-BASED SNP LINKAGE MAP. RICE 9: 52. DOI: 10.1186/S12284-016-0125-2 ... 150
APPENDIX D: SUPPORTING TABLE TO CHAPTER 3 ... 152
D.1 Di-genic epistatic QTLs for traits related to salt tolerance at seedling stage in Bengal/Pokkali F6 RIL population identified by interval mapping. ... 152
D.2 Comparison of 38 SNP calls by GBS and resequencing data ... 154
APPENDIX E: SUPPORTING TABLES TO CHAPTER 4 ... 155
E.1 List of SSR markers used in IL mapping ... 155
E.2 Phenotypic mean performance of ILs in nine traits under salinity stress 12dSm-1 ... 157
E.3 Genome statistics of 72 ILs covering the rice genome by SSR markers ... 164
E.4 Genome statistics of 88 ILs by SNP markers ... 165
E.5 Phenotypic attributes and genome composition of tolerant ILs. ... 168
LIST OF TABLES
Table 2.1. List of genotypes used in the experiment, their source, and some key agronomic attributes... 11 Table 2.2. Pearson correlation matrix of seedling traits in response to salt stress at 12 dSm-1 in rice genotypes. ... 21 Table 2.3. Least square (LS) means of salinity groups in six parameters. ... 26 Table 2.4. Summary of analysis of molecular variance (AMOVA). ... 27 Table 2.5. Genetic differentiation between population clusters of rice genotypes by 146 SSR markers... 28 Table 3.1. Phenotypic response of parents and F6 RIL population for traits related to salt
tolerance at seedling stage... 48 Table 3.2. Pearson correlation matrix of traits measured in response to salt stress at 12dSm-1 in Bengal/Pokkali F6 RIL population at seedling stage. ... 51
Table 3.3. Summary distribution, coverage, and intervals of SNP markers in the Bengal/Pokkali RIL linkage map. ... 54 Table 3.4. Additive QTLs for traits related to seedling-stage salt tolerance in Bengal/Pokkali F6 RIL population identified by IM and ICIM methods. ... 56
Table 3.5. Interval mapping of segregation distortion loci (SDLs) in Bengal/Pokkali F6 RIL
population... 65 Table 3.6. Summary of additive QTLs co- localizing to previously reported QTLs. ... 67 Table 4.1. Mean phenotypic response of parents and 292 ILs (BC4F4) in traits under
salt stress. ... 92 Table 4.2. Pearson correlation matrix of traits under seedling salinity stress in 292 ILs. ... 95 Table 4.3. Basic statistics of Pokkali segments in introgression lines using SSR and SNP
markers... 96 Table 4.4. Q TLs detected in ILs by SMA and LRT using SSR markers. ... 100 Table 4.5. Q TLs detected in ILs by SMA and LRT using 6797 SNP markers. ... 105 Table 4.6. List of significant QTLs detected in Bengal x Pokkali IL (BC4F4) and F6 RIL
LIST OF FIGURES
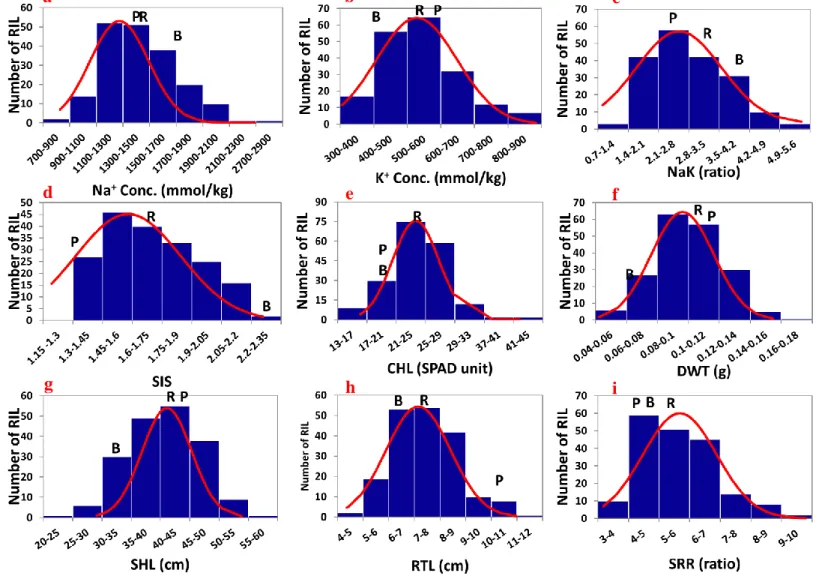
Figure 2.1. Clustering of forty-nine genotypes by UPGMA based on Euclidean distance of six morphological and physiological trait responses to salinity stress. ... 23 Figure 2.2. Population structure of 49 rice genotypes by canonical discriminant analysis of morphological and physiological trait responses to salt stress. ... 25 Figure 2.3. Genotypic clustering by unweighted neighbor-joining tree showing the genetic relationship among the 49 rice genotypes based on 146 SSR markers.. ... 27 Figure 3.1. Frequency distribution of Bengal/Pokkali F6 RIL population for traits related to
seedling salinity tolerance.. ... 50 Figure 3.2. Molecular genetic map showing the positions of QTLs for nine traits
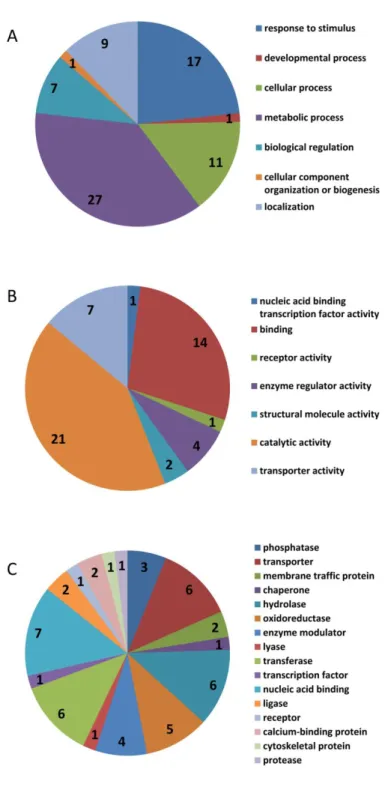
investigated under salt stress... 53 Figure 3.3 Functional classification of annotated candidate genes delimited by additive QTLs for salinity tolerance.. ... 68 Figure 4.1. Frequency distribution of 292 ILs (BP BC4F4) for nine traits investigated
under salt stress (EC=12dSm-1). ... 94 Figure 4.2. Graphical genotypes of 72 ILs developed from Bengal x Pokkali cross.. ... 97 Figure 4.3. Frequency distribution of introgressed Pokkali segments in the selected introgression lines using SSR (A) and SNP (B) markers. ... 98 Figure 4.4. Comparison of salinity-tolerance QTLs detected in Pokkali introgression lines by SMA and LRT using SSR markers (A), SNP markers (B), and common QTLs
LIST OF ABBREVIATIONS
µl Microliter
AFLP Amplified fragment length polymorphism
AMOVA Analysis of molecular variance
ANOVA Analysis of variance
Ave Average
B Bengal
Can1 Canonical discriminant function 1
Can2 Canonical discriminant function 2
CHL Chlorophyll content
Chl_R % Chlorophyll reduction
cM centi-Morgan
conc Concentration
CORR Correlation
CTAB Cetyl trimethylammonium bromide
Ctr Control
df Degree of freedom
DNA Deoxyribonucleic acid
dNTPs Deoxyribonucleotide triphosphates
DPS Days post salinization
DWT Dry weight
F6 6th filial generation
FLDA Fisher linear discriminant analysis
GBS Genotyping-by-sequencing
GRIN Germplasm Resources Information Network
H Broad sense heritability computed on family mean basis
Ha Hectare
HKT High-affinity K+ transporter
HS Highly sensitive
HT Highly tolerant
ICIM-ADD Inclusive composite interval mapping for additive QTLs
ILs Introgression lines
IM-ADD Interval mapping for additive QTLs
Ion_leak Index of injury by ion leakage
IRRI International Rice Research Institute
K+ Potassium concentration
Kb Kilobase
LOD Logarithm of the odds
LRT Stepwise regression-based likelihood ratio test
LS Least square M Million Max Maximum Mb Megabase Min Minimum ml Milliliter
mM Millimolar
MS Mean square
MT Moderately tolerant
Na+ Sodium concentration
NaK Ratio of the shoot sodium and shoot potassium content
NHX Na+/H+ transporters
P (rand perm.999) Significance of genetic distance at 999 random permutations
P Pokkali
PCR Polymerase chain reaction
PhiPT Estimate of genetic distance among populations
PVE Percent variance explained
qCHL QTL for chlorophyll content
QDA Quadratic discriminant analysis
qDWT QTL for dry weight
qK QTL for shoot potassium concentration
qNa QTL for shoot sodium concentration
qNaK QTL for ratio of the shoot sodium and shoot potassium content
qRTL QTL for root length
qSHL QTL for shoot length
qSIS QTL for salt injury score
qSKC1 QTL for shoot K+ concentration on chromosome 1
qSRR QTL for shoot length to root length ratio
QTLs Quantitative trait loci
R RIL
RFLP Restriction fragment length polymorphism
RILs Recombinant inbred lines
Ro Ion leakage in control treatment
Rt Ion leakage in saline treatment
Rt_Na Sodium concentration in root
Rt_Na/K Na/K ratio in root
RTL Root length
RtL_R % root length reduction
S Sensitive
Sal Saline treatment
Saltol QTL for salt tolerance
SDLs Segregation distortion loci
SFR Super fine resolution
Sh_K Shoot potassium concentration (mmol/kg)
Sh_Na Shoot sodium concentration (mmol/kg)
Sh_Na/K Na+/K+ ratio in shoot
SHL Shoot length
ShL_R % Shoot length reduction
SIS Salt injury score
SMA Single marker analysis
SNP Single nucleotide polymorphism
SS Sum of squares
SSR Simple sequence repeats
T Tolerant
Taq Thermus aquaticus
ABSTRACT
Due to the threat of salinity stress to Louisiana rice production, an effort was made to understand the molecular genetics of salinity tolerance with the overall goal of developing salt tolerant varieties. The objectives of this study were to 1) determine if salinity tolerance exist in the US rice varieties, 2) map the additive and epistatic QTLs for traits related to seedling salinity tolerance in recombinant inbred lines (RILs) using genotyping-by-sequencing (GBS)-derived SNP markers, and 3) identify and validate stable QTLs and their effects in introgression lines (ILs) of Pokkali in Bengal background. All experiments for phenotypic characterization were conducted in hydroponics at salinity level of 12dSm-1 in the greenhouse. Among the thirty Southern US rice varieties characterized under salt stress, LAH10, R609, and Cheniere were tolerant. Additionally, CL162, Jupiter, Jazzman, Templeton, Cypress, Neptune, and Caffey were identified as moderately tolerant based on clustering and discriminant analyses using the linear combination of six traits. On the other hand, clustering based on DNA profiles did not
correspond to the varietal grouping based on salinity responses. Nona Bokra, Pokkali, and Pokkali-derived lines remained the donors of choice for highest salt tolerance. Alternatively, TCCP266, Geumgangbyeo, and R609 with few undesirable agronomic traits were recommended as donors for rice improvement. For QTL mapping, 189 lines of F6 RIL population were
phenotyped and characterized by GBS. A total of 9303 SNP markers were used for construction of genetic map. Eighty-five QTLs with small and large effects were identified for nine traits. Of which, 11 QTLs co-localized with 14 reported QTLs. Epistatic QTLs were also mapped and indicated the complexity of salinity tolerance. Based on the annotation of candidate genes within QTL intervals, ion transporters, osmotic regulators, transcription factors, and protein kinases may play important roles in salinity tolerance. On the other hand, at least 14 QTLs in RILs were
validated in the IL population. Our study emphasized the importance of salt injury score (SIS) and seedling vigor-QTLs for salinity tolerance. Based on tolerant ILs, the probable mechanisms of tolerance are Na+ dilution in leaves, Na+ ion compartmentation, and by synthesis of
compatible solutes. The tolerant ILs will serve as improved variety of Bengal or donor breeding lines for transferring salinity tolerance to other US elite varieties.
CHAPTER 1. INTRODUCTION 1.1 Rice: importance and production
Rice (Oryza sativa) is one of the most important crops in the world. It is a staple food for more than half of the world’s population. It is planted and produced in 77 countries worldwide. This year, the world’s rice production is about 713.8 million (M) tons harvested from 161 M hectares (ha). China, India, and Indonesia are the three largest producers and consumers of rice. These three countries alone account for the 60% of the world rice production and consumption. China, Nigeria, and the Philippines are the top three importers of rice while Thailand, India, and Vietnam are the largest exporters. The USA ranks 11th in production and consumption of rice, with a total of 7.3 M tons of milled rice produced on 1.2 M ha (USDA, 2016). Additionally, the USA is the fifth largest exporter, with about 50% of its rice being exported to Latin America, Asia, Europe, Middle East, and Africa (USARice, 2016). Among the rice-producing states, Louisiana is the third largest producer of rice, with 1.46 M tons of rice harvested from 170, 000 ha of land (USDA, 2016).
There are about 27 species of Oryza that are annual or perennial, diploid or tetraploid, and with genome composition grouped in AA, BB, CC, DD, EE, FF, GG, HH, JJ, KK, LL and combinations of these (GRiSP, 2013). However, there are only two widely cultivated rice species, the Oryza sativa that originated in Asia and Oryza glaberrima from Africa. Under O. sativa, there are two subspecies, the japonica and indica type. O. sativa is diplod with two sets of 12 chromosomes (2n=24) (Izawa and Shimamoto, 1996). In 2002, rice genomes were sequenced, with a genome size of 430 Mb and 460 Mb for japonica and indica, repectively (Goff et al., 2002; Yu et al., 2002). Since then, numerous genomic studies followed. More molecular markers were developed and more QTL mapping studies were conducted. Sequence variations between
cultivated and wild species of rice were compared, and more gene cloning and transformation studies were conducted for the development of more resilient rice (Jackson, 2016).
1.2 Salinity stress and effects on rice plants
There are several constraints to rice production. Among the abiotic stresses, water and soil salinity is a worldwide problem in both irrigated and non-irrigated crop production. Salinity is a condition in which the soil or water has a concentration greater than 4dSm-1 of soluble salts, predominantly by sodium. According to the Food and Agriculture Organization of the United Nations (FAO), there are about 397 M ha of land affected by salinity worldwide. Among the 230 M ha of irrigated land used in crop production, 20% (45M ha) were affected by salinity, leading to an estimated cost of about USD 11billion yr-1 (Thomas and Morini, 2005).
Natural climatic factors are usually the cause of salinity problem. In the coastal areas, sea water intrusion may contaminate rivers and aquifers. In the arid and semi-arid regions, weathering of basalt rocks releases various types of soluble salts and accumulates over time causing elevated salinity. Secondary salinization, on the other hand, occurs due to irrigation using salt-rich water and poor drainage system (Yadav et al., 2011).
During salinity stress, the high concentration of Na+ ions in soil reduces the ability of plants to take up water and nutrients (osmotic stress). Later on, plants affected by excessive salt
concentration often show reduced growth, leaf damage, necrosis, and eventual death of the crop (ionic stress), resulting to significant yield loss (Flowers, 2004; Munns and Tester, 2008). Among the economically important cereals, rice is most sensitive to salinity stress (Munns and Tester, 2008). Seedlings die at salt level of 10dSm-1 (Munns et al., 2006), and yield loss can be as high as ninety percent at 3.5 dSm-1 salt stress during the reproductive stage (Asch et al., 2000).
1.3 Mechanisms of salinity tolerance
Plants experience osmotic and ionic stress during salinity stress. Under osmotic stress, the availability of water and nutrients to the plants is limited due to low water potential caused by higher concentration of salts in water or soil surrounding the roots. The mechanism of tolerance under this condition is called osmotic tolerance which is speculated to be regulated by long-distance signaling and perception of salts (Munns and Tester, 2008; Roy et al., 2014). Plants respond to osmotic stress by stomal closure to conserve water and reduced transpiration stream that drives Na+ ion influx from roots to the shoots of plants (Flowers and Flowers, 2005). At the cellular level, water and low molecular weight compounds enter the plant cells through
membrane proteins called aquaporins. Down regulation and over expression of genes encoding aquaporins suggests important role of membrane proteins in water homeostasis during osmotic stress. Additionally, plants accumulate compatible solutes like sucrose, glycine betaine,
mannitol, and proline for cellular osmotic adjustment, and for restoration of water uptake to prevent dehydration (Horie et al., 2012).
Ionic stress or Na+ accumulation in leaves is toxic to plants. The increased accumulation of Na+ ions was correlated to reduced survival of plants under salinity stress (Yeo et al., 1990). There is no Na+-selective membrane channel identified in plants. Na+ ions are believed to be taken up into cells by the same K+ transporters or nonselective cation channels (Flowers and Flowers, 2005; Demidchik and Maathius, 2007). For this reason, membrane channels and transporters that reduced the accumulation of Na+ ions in leaves were involved in salinity
tolerance by ion exclusion (Negrão et al., 2011). High-affinity K+ transporters or HKT family is one of the most studied transporters associated to salinity tolerance. In Arabidopsis, at high concentration of Na+, AtHKT1;1 was shown to be selectively permeable to Na+ ions and helped
in the removal and recirculation of Na+ from leaves to roots (Sunarpi et al., 2005). Similarly, Ren et al. (2005) reported OsHKT1;5 gene in rice with the same function for Na+/K+ homeostasis. Both genes were reported to mediate Na+ exclusion in shoots by unloading Na+ ions from xylem sap and then reloading them into phloem for transport to the roots. However, recirculation model of Na+ ions from shoots to roots were not validated using radioactive tracer 22Na+, and thus, raised controversy on the role of HKT in unloading Na+ ions from the shoot (Davenport et al., 2007; Munns and Tester, 2008).
Another well known mechanism of salinity tolerance is by compartmentation of Na+ ions in vacuoles which is considered as tissue tolerance. Na+/H+ transporters (NHX) in tonoplast were responsible for selective sequestration Na+ ions in vacuoles (Negrão et al., 2011). Together with this process is the coordinated cytosolic increased accumulation of K+ ions and other compatible solutes to balance the osmotic pressure of ions in the vacuoles (Munns and Tester, 2008).
Additionally, secretion of Na+ ions in leaves through specialized modified cells were observed in halophytes (Flowers and Flowers, 2005). In wild relatives of rice, the Oryza coarctata, a
tetraploid with KKLL genome, was found highly tolerant to salinity stress due to its characteric trichomes (salt hairs) that burst for salt excretion (Bal and Dutt, 1986).
1.4 Genetics and QTL mapping of salinity tolerance
With the variety of plant’s responses to salinity stress, it is not surprising to expect the complexity of salinity tolerance. Phenotypic charaterization of mapping populations in rice for morphological and physiological traits under salt stress showed continuous distribution, presence of transgressive segregants, and significant interaction of genotype with the environment. All of these are indications of a quantitative trait and polygenic nature of salinity tolerance (Gregorio and Senadhira, 1993; Koyama et al., 2001; Flowers, 2004). Additionally, QTL mapping for
salinity tolerance-related traits indicated the presence of many small-effect QTLs and very few large-effect QTLs. The list of QTLs for salinity-related traits in rice are available in
www.gramene.org. To date, there are around 80 reported QTLs for Na+, K+ concentrations, Na+/K+ ratio, salt injury score, survival rate, root and shoot lengths, and chlorophyll content under salinity stress. A QTL on chromosome 1 was consistently reported for shoot K+
concentration. The QTL was named qSKC1 and was located between 9.82 and13.30 Mb region
(Koyama et al., 2001; Lin et al., 2002; Thomson et al., 2010; Wang et al., 2012) from which, an HKT1;5 gene was cloned from Nona Bokra for salinity tolerance (Ren et al., 2005). In a separate study using Pokkali as a salinity tolerance donor, the same locus was associated with low Na+/K+ ratio and was named Saltol (Gregorio, 1997; Bonilla et al., 2002). For other traits, QTLs were detected on chromosomes 2, 3, 4, 6, 7, 9, 11, 12 and no QTLs were reported yet on chromosomes 5, 8, and 10.
1.5 Rationale for research
While good farming and integrated management practices can be applied, the use of salt tolerant rice varieties is another option to address the problem of salinity. Several traditional rice genotypes were salt tolerant and may provide opportunities to improve salt tolerance of rice through breeding (Gregorio et al., 2002). However, with many factors contributing to salt tolerance, understanding the molecular genetics, physiology, and mechanisms of salinity tolerance are thus essential for the development of salt tolerant rice varieties. Since the
magnitude of salinity stress and adaptation of rice vary with different environments, breeding for salt tolerance should be targeted to the growing environments. In this study, the specific
1. To characterize the thirty Southern USA rice varieties for salinity tolerance along with 19 donor genotypes of varying levels of salt tolerance;
2. To map the additive and epistatic QTLs for traits related to seedling salinity tolerance in recombinant inbred lines (RILs) using genotyping-by-sequencing (GBS)-derived SNP markers; and
3. To identify and validate stable QTLs and their effects in introgression lines (ILs) of Pokkali in Bengal background.
1.6 References
Asch, F., Dingkuhn, M., Dorffling, K., and Miezan, K. (2000). Leaf K/Na ratio predicts salinity induced yield loss in irrigated rice. Euphytica 113, 109-118.
Bal, A.R., and Dutt, S.K. (1986). Mechanism of salt tolerance in wild rice (Oryza coarctata
Roxb). Plant and Soil 92, 399-404.
Bonilla, P., Dvorak, J., Mackill, D., Deal, K., and Gregorio, G. (2002). RFLP and SSLP mapping of salinity tolerance genes in chromosome 1 of rice (Oryza sativa L.) using recombinant inbred lines. Philip. Agric. Sci. 85, 68-76.
Davenport, R.J., Munoz-Mayor, A., Jha, D., Essah, P.A., Rus, A., and Tester, M. (2007). The Na+ transporter AtHKT1;1 controls retrieval of Na+ from the xylem in Arabidopsis. Plant Cell Environ. 30, 497-507.
Demidchik, V., and Maathius, F. (2007). Physiological roles of nonselective cation channels in plants: from salt stress to signalling and development. New Phytol. 175, 387-404.
Flowers, T.J. (2004). Improving crop salt tolerance. J. Exp. Bot. 55, 307-319.
Flowers, T.J., and Flowers, S.A. (2005). Why do salinity pose such a difficult problem for plant breeders? Agric. Water Manag. 78, 15-24.
Goff, S.A., Ricke, D., Presting, G., Wang, R., Dunn, M., et al. (2002). A draft sequence of the rice genome (Oryza sativa L. ssp. japonica). Science 296, 92-100.
Gregorio, G.B., and Senadhira, D. (1993). Genetic analysis of salinity tolerance in rice (Oryza sativa L.). Theor. Appl. Genet. 86, 333-338.
Gregorio, G.B. (1997). Tagging salinity tolerance genes in rice using amplified fragment length polymorphism (AFLP). PhD Dissertation, University of the Philippines, Los Baños.
Horie, T., Karahara, I., and Katsuhara, M. (2012). Salinity tolerance mechanism in glycophytes: An overview with the central focus on rice plants. Rice 5,11.
Izawa, T., and Shimamoto, K. (1996). Becoming a model plant: the importance of rice to plant science. Trends in Plant Sci. 1, 95-99.
Jackson, S.A. (2016). Rice: The first crop genome. Rice 9, 14.
Koyama, M.L., Levesley, A., Koebner, R., Flowers, T.J., and Yeo, A.R. (2001). Quantitative trait loci for component physiological traits determining salt tolerance in rice. Plant Physiol.
125, 406-422.
Lin, H.X., Zhu, M.Z., Yano, M., Gao, J.P., Liang, Z.W., Su, W.A., et al. (2004). QTLs for Na+ and K+ uptake of the shoots and roots controlling rice salt tolerance. Theor. Appl. Genet. 108, 253-260.
Munns, R., James, R.A. and Lauchli, A. (2006). Approaches to increasing the salt tolerance of wheat and other cereals. J. Exp. Bot. 57, 1025-1043.
Munns, R., and Tester, M. (2008). Mechanism of salinity tolerance. Annu. Rev. Plant Biol.59, 651-81.
Negrão, S., Courtois, B., Ahmadi, N., Abreu, I., Saibo, N., and Oliveira, M. (2011). Recent updates on salinity stress in rice: from physiological to molecular responses. Critical Rev. Plant Sci. 30, 329-377.
GRiSP (Global Rice Science Partnership). (2013). Rice Almanac. Los Banos (Philippines): International Rice Research Institute.
Ren, Z.H., Gao, J.P., Li, L.G., Cai, X.L., Huang, W., Chao, D.Y., et al. (2005). A rice
quantitative trait locus for salt tolerance encodes a sodium transporter. Nature Genet. 37, 1141-1146.
Roy, S.J., Negrão, S., and Tester, M. (2014). Salt resistant crop plants. Current Opin. Biotech.
26, 115-124.
Sunarpi, Horie, T., Motoda, J., Kubo, M., Yang, H., Yoda, K. et al. (2005). Enhanced salt tolerance mediated by AtHKT1 transporter-induced Na+ unloading from xylem vessels to xylem parenchyma cells. Plant J. 44, 928-928.
Thomas, R.P., and Morini, S. (2005). Food and Agriculture Organization of the United Nations. ftp://ftp.fao.org/agl/agll/docs/salinity_brochure_eng.pdf (accessed February 7, 2014).
Thomson, M.J., de Ocampo, M., Egdane, J., Rahman, M.A., Sajise, A.G., Adorada, D.L., et al. (2010). Characterizing the Saltol quantitative trait locus for salinity tolerance in rice. Rice 3, 148-160.
USARice. USA Rice International Markets. n.d. https://usarice.com/global-markets/international- markets (accessed September 20, 2016).
USDA. USDA, Economic Research Service . March 9, 2016. http://www.ers.usda.gov/data-products/rice-yearbook.aspx (accessed September 20, 2016).
USDA. World Rice Statistics. 2016. http://ricestat.irri.org:8080/wrsv3/entrypoint.htm (accessed September 20, 2016).
Wang, Z., Chen, Z., Cheng, J., Lai, Y., Wang, J., Bao, Y., et al. (2012). QTL analysis of Na+ and K+ concentrations in roots and shoots under different levels of NaCl stress in rice (Oryza sativa L.). PLoS ONE 7, e51202. doi:10.1371/journal.pone.0051202.
Yadav, S., Irfan, M., Ahmad, A., and Hayat, S. (2011). Causes of salinity and plant manifestations to salt stress: A review. J. Environ. Biol.32, 667-685.
Yeo, A.R., Yeo, M.E., Flowers, S.A., and Flowers, T.J. (1990). Screening of rice (Oryza sativa
L.) genotypes for physiological characters contributing to salinity resistance, and their relationship to overall performance. Theor, Appl. Genet. 79, 377-384.
Yu, J., Hu, S., Wang, J., Wong, G.K.S., Li, S., Liu, B. et al. (2002). A draft sequence of the rice genome (Oryza sativa L. ssp. indica). Science 296, 79-92.
CHAPTER 2. GENETIC VARIATION IN SOUTHERN USA RICE GENOTYPES FOR SEEDLING SALINITY TOLERANCE*
2.1 Introduction
The USA is a major exporter of rice to Latin America and Asia. Among the US states, Louisiana is the third largest producer of rice (USDA National Statistics Service, 2013). However, its proximity to the Gulf of Mexico makes it vulnerable to salinity stress. During the hurricane season, salt water intrusion normally occurs in coastal areas. Moreover, if reduced rainfall follows the year of salt water flooding, fresh water gets contaminated with brackish water and recovery of affected areas is hindered (Leonards, 2012). After hurricanes Katrina, Rita, Gustav, and Ike, soil salinity increased in coastal areas of Louisiana. Soil salinity sampled from 2005 to 2008 ranged from 286-4329 parts per million (ppm) (Breitenbeck et al., 2007; Saichuk and Gauthier, 2011; Viator et al., 2011), while water salinity rose to as high as 7,000 ppm between 2001 and 2003 (Branch, 2004).
Louisiana has considerable success for breeding high-yielding rice varieties. However, continuous progress is necessary to meet the demand of the world’s increasing population in conjunction with changing climate, environment, and pests. Successful targeted trait
improvement depends on the availability of donor genotypes, efficient screening methods, and a thorough understanding of the genetics and physiology of salinity tolerance (Negrão et al., 2011). Despite the establishment of a screening procedure for salinity tolerance by IRRI (Gregorio et al., 1997), consistency and reproducibility of results between laboratories worldwide remains a challenge due to the lack of uniform growth environments. Several studies have been published on the screening method (Yeo et al., 1990; Aslam et al., 1993; Asch et al., 2000), but only a few were in large scale (Yeo at al., 1990; Kanawapee et al., 2012). Although salinity tolerance is
polygenic, most studies still treat salinity tolerance as a single trait and commonly use visual scoring (Gregorio et al., 1997) or the Na+/ K+ ratio for classification. Yeo et al. (1990) suggested pyramiding of favorable morphological and physiological traits to increase salinity tolerance. Therefore, a statistical model combining morphological and physiological traits would be more appropriate. Previously, cluster analysis using agronomic and physiological parameters has been employed in genotypic classification for salinity tolerance. (Zeng et al., 2002). However, cross-validation of the clustering method was not employed to evaluate the accuracy of the
classification. In addition, attempts to define the differences among levels of tolerance are not well established due to the complexity of tolerance and limited genotypic screening techniques (Platten et al., 2013). To address these concerns, we classified 49 rice genotypes for salinity tolerance based on the linear combination of morphological and physiological traits using the combined power of clustering and discriminant analyses. We employed MANOVA and canonical discriminant functions to define the differences in salinity tolerance. Lastly, we genotyped the 49 rice varieties to identify ideal tolerant genotypes suited for breeding programs in the Southern USA. To our knowledge, this is the first time these Southern USA rice varieties were evaluated for salinity tolerance and genetic relatedness.
2.2 Materials and methods
2.2.1 Plant materials
Forty-nine rice genotypes were screened for salinity tolerance at the seedling stage (Table 2.1). Thirty varieties were grown in the Southern USA and fourteen genotypes were acquired from IRRI, including the sensitive check IR29 and the highly tolerant check Pokkali. The other five genotypes were acquired from the Germplasm Resources Information Network (GRIN).
Table 2.1. List of genotypes used in the experiment, their source, and some key agronomic attributes.
Genotype Source# Subspecies Photosensitivity
Presence of
awn Grain type
Pericarp color
Hasawi (IRGC 16817) IRRI Genebank Indica no awned medium grain red
Cheriviruppu IRRI Genebank Indica yes awned medium grain red
Pokkali (IRGC 108921) IRRI Genebank Indica yes awned medium grain red
Nona Bokra (IRGC 01231) IRRI Genebank Indica yes no medium grain red
FL478 IRRI Genebank Indica no awned long grain red
FL378 IRRI Genebank Indica yes awned long grain red
TCCP-266-1-38-13-1-3 IRRI Genebank Indica no awned long grain white
IRRI 147 IRRI Genebank Indica no no medium grain white
Ketumbar (IRGC 13516) IRRI Genebank Indica yes no short grain white
Damodar (IRGC 17038) IRRI Genebank Indica yes no medium grain white
Getu (IRGC 17041) IRRI Genebank Indica yes no medium grain white
CSR II (IRGC 83240) IRRI Genebank Indica no no medium grain white
PSBRC50 (IRGC 99706) IRRI Genebank Indica no no long grain white
IR 1702-74-3-2 (PI 399813) GRIN Indica yes awned long grain white
IR 944-102-2-3-2 (PI 408628) GRIN Indica no awned long grain white
IR 2706-11-2 (PI 408508) GRIN Indica no no long grain white
Nipponbare (GSOR# 70) USDA (Arkansas) Japonica no no medium grain white
Geumgangbyeo GRIN Indica no no medium grain white
IR29 (IRGC 30412) IRRI Genebank Indica no no long grain white
Cocodrie LRRS Japonica no no long grain white
R609 (MG) LRRS Indica no no medium grain white
LAH 10 LRRS Indica no no long grain white
LA 0802140 LRRS Japonica no no long grain white
(Table 2.1 continued)
Genotype Source# Subspecies Photosensitivity
Presence of
awn Grain type
Pericarp color
Bengal LRRS Japonica no no medium grain white
CL152 LRRS Japonica no no long grain white
Roy J LRRS Japonica no awned$ long grain white
Rex LRRS Japonica no awned$ long grain white
CL142 LRRS Japonica no awned$ long grain white
Mermentau LRRS Japonica no no long grain white
Jupiter LRRS Japonica no no medium grain white
Wells LRRS Japonica no awned$ long grain white
Catahoula LRRS Japonica no no long grain white
CL151 LRRS Japonica no no long grain white
Jazzman LRRS Japonica no awned$ long grain white
Neptune LRRS Japonica no no medium grain white
Caffey LRRS Japonica no no medium grain white
Templeton LRRS Japonica no awned$ long grain white
Taggert LRRS Japonica no awned$ long grain white
Jazzman-2 LRRS Japonica no awned$ long grain white
Jes LRRS Indica no awned$ long grain white
CL162 LRRS Japonica no awned$ long grain white
CL181 LRRS Japonica no no long grain white
CL111 LRRS Japonica no no long grain white
CL131 LRRS Japonica no no long grain white
Cypress LRRS Japonica no no long grain white
CL161 LRRS Japonica no no long grain white
LA 0702085 LRRS Japonica no no long grain white
CL261 LRRS Japonica no no medium grain white
#
2.2.2 Screening for salinity tolerance at seedling stage
Unimbibed seeds of the 49 rice genotypes were incubated at 50°C for five days to break any residual seed dormancy. The IRRI standard evaluation technique (Gregorio et al., 1997) for salinity tolerance was followed with some modifications. Ten seeds from each genotype were pre-germinated in a paper towel for 2 days at 35°C and then transferred into a styrofoam trays suspended on a basin containing tap water. After 3 days, the seedlings were allowed to grow for 2 weeks in a hydroponic nutrient solution containing 1 g/l of Jack’s Professional fertilizer 20-20-20 (J.R. Peters, Inc.) supplemented with 300mg/l ferrous sulfate. NaCl was added to the nutrient solution at 12dSm-1 with the pH maintained between 5.0-5.1. Control plants were grown at the same time in nutrient solutions without NaCl. All experiments were conducted in a greenhouse with temperatures set between 25-29°C.
The entire experiment was conducted in a randomized block design and was replicated three times. Ten seedlings were grown, but only five plants of uniform growth per genotype for every replication were considered for data collection. The mean value of the trait for 5 seedlings per genotype was considered one replicate of a treatment.
Ion leakage
Early responses of rice genotypes to salinity stress were investigated by measuring the concentration of the ions that leaked from the leaf tissue using a conductivity meter (VWR Traceable). After 2 days in saline solution, 100mg of leaf tissue were collected from the second youngest leaf of each genotype. The tissue was cut into 10mm long strips, placed in 10 ml distilled deionized water, and incubated at room temperature for 2 h before autoclaving. The electrical conductance of the solution was measured before and after autoclaving for ECinitial and
injury was estimated with respect to the ion leakage of the corresponding genotype grown in control conditions, following the formula of Flint et al., (1967): Ion_leak= 100 (Rt-Ro) / (1-Ro); where Ion_leak is the index of injury by ion leakage; Ro = ECinitial/ECfinal of the control plant,
and Rt = ECinitial/ECfinal of the stressed plant.
Chlorophyll concentration
Leaf yellowing was observed in plants 4 days after salinization. To compare the differences among genotypes, the relative chlorophyll concentration was measured nondestructively from the mid-part of the second youngest leaf in control and stressed rice genotypes using the SPAD 502 chlorophyll meter (Spectrum Technologies, Inc.) after 4 days. The relative percent reduction in chlorophyll concentration was computed by the formula: Chl_R = 100 (Chlcontrol –
Chlstress/Chlcontrol).
Growth parameters
Changes in shoot and root length in response to salinity stress were measured for each genotype 7 days post salinization (DPS). Shoot length was measured from the base of the plant to the tip of the longest leaf, while the root length was measured from the base of the plant to the tip of the root mass. To account for genotypic differences, all comparisons were done with respect to the control. Hence, the percent reduction in root and shoots were computed by a formula similar to the chlorophyll percent reduction.
Visual salt injury score (SIS)
Plant responses to salinity stress were evident 7 DPS. For visual scoring, the IRRI standard evaluation scoring was followed (Gregorio et al., 1997). The plant scored 3 if it showed little to no leaf damage, but was stunted compared to the corresponding genotype grown in the control solution. A score of 5 was given if the plant was stunted with green rolled leaves having a few
whitish tips. A plant showing only green culm with dried leaves was scored 7, and a score of 9 was given if the plant was completely dead. All visual scoring was done when the sensitive check IR29 had a score of 7 or 9. The mean SIS score of each genotype was computed from 10 individual plants per experiment.
Na-K analysis
The concentration of sodium and potassium in the root and shoot were determined for each genotype grown in saline conditions after 7 days. Five plants per genotype were rinsed with distilled water and then dried for 2 days at 65°C. Each dried tissue was ground by mortar and pestle and 100 mg were digested with 5ml of nitric acid and 3ml hydrogen peroxide at 152-155°C for 3 hours in a hood. The digested tissue was diluted to a final volume of 12.5 ml, and the concentration of sodium and potassium were quantified using a flame photometer (model PFP7, Bibby Scientific Ltd, Staffordshire, UK). The estimated concentration was calculated from a standard curve. The absolute concentration was computed based on the dilution of the sample. 2.2.3 Statistical analyses
To evaluate the genotypic differences for each trait, ANOVA and comparison of means by Dunnett’s test were conducted using the GLIMMIX procedure against IR29 or Pokkali. The genotype was entered as the fixed effect and the replication as a random effect. To improve the normality of the data for analysis of genotypic differences, values were anchored to 1, then log transformed prior to data analysis. Correlation among traits was computed using the CORR procedure of SAS Version 9.3 for Windows (SAS Institute, 2011), based on the pooled least square (LS) mean of three replications per trait.
To characterize the level of salinity tolerance of the 49 varieties, the LS mean values of genotypes for six traits (SIS, ion_leak, chlorophyll and shoot length reduction, shoot K concentration, and shoot Na+/K+ ratio) were used in multivariate cluster analysis of NTSYSpc 2.10t (Rohlf, 2000). Because of different scaling and to give equal importance among the trait variables, the data were standardized to have a mean of 0 and a variance of 1. Euclidean distances between all pairs of genotypes were computed from standardized six seedling traits, and the phenogram of rice genotypes was constructed based on the UPGMA (Unweighted Pair Group Method with Arithmetic Mean). Based on the ranking of the group mean SIS, the clusters were classified as highly tolerant (HT), tolerant (T), moderately tolerant (MT), sensitive (S) and highly sensitive (HS). To confirm the classification of genotypes, the same data for clustering were used in discriminant analyses with the group assignment for each genotype. The six seedling traits were considered as dependent variables, and the salinity clusters (HT, T, MT, S, and HS) were considered as independent variables. All genotypes were then given an equal prior probability to be grouped into the five levels of salinity tolerance. The PROC DISCRIM, PROC CANDISC, and the GLM procedures for MANOVA were run in SAS v9.3 (SAS Institute, 2011) to determine the differences among the levels of salinity groupings.
2.2.4 Genetic diversity analysis
Plants were grown in non-saline growth medium, and leaf tissues were harvested from a single plant of each genotype. The genomic DNA from each genotype was isolated following the CTAB method (Chen and Ronald, 1999). The DNA concentration was quantified by a
spectrophotometer (NanoDrop ND-1000) and was adjusted to a final concentration of 25ng/µl for PCR amplification.
One hundred forty-six SSR markers, evenly spaced across the 12 chromosomes of rice, were used in PCR amplification for genetic diversity (B.2). For each 25µl reaction, the PCR mixture contained 12.8µl water, 2.5µl 10X PCR buffer, 2.5µl 25mM MgCl2, 2.5µl 2mM dNTPs, 1.25µl
50ng/µl reverse and forward primers, and 1U Taq polymerase (Promega Corporation, Madison, USA). The reactions were run for 35 cycles of 94°C for 45 sec, 55°C for 45 sec, and 72°C for 1 min with a final extension at 72°C for 5 minutes. The PCR products were analyzed by 4.5% SFR agarose gel electrophoresis. Four hundred twenty-seven alleles were then scored as 1 or 0 for the presence or absence of a PCR band. The pairwise distance matrix was computed among
genotypes using the dice coefficient, and then used in tree construction by unweighted neighbor-joining as implemented in DARwin 6.0 (Perrier et al., 2003). AMOVA, genetic distance, and Mantel’s test were performed using GenAlEx (Peakall and Smouse, 2012) to evaluate genetic diversity.
2.3 Results
2.3.1 Phenotypic response to salinity stress
During the experiment, greenhouse temperature ranged between 24-29°C during the day. Plants assigned to control and the corresponding genotypes to salinity treatment grew uniformly after two weeks in non-saline hydroponic solution. Upon addition of sodium chloride at 12dSm-1, most of the rice genotypes showed leaf rolling after 2 to 3 hours. Growth of the plants stopped by the 2nd or 3rd day, followed by chlorosis and leaf bleaching from the tip of the leaf blade to the leaf base on the 4th or 5th day. By the 7th to 9th day post salinization, susceptible seedlings of IR29 were dead. Tolerant varieties also showed the same early response to salinity stress, but at 4th or 5th day, they showed some signs of recovery, such as leaf greening and growing of the youngest leaf.
Significant differences among genotypes were observed for some of the traits investigated (B.1). However, the differences across genotypes were not significant in the root length
reduction (RtL_R), root sodium concentration in (Rt_Na), root potassium concentration (Rt_K), root sodium: potassium ratio (Rt_Na/K), and shoot sodium concentration (Sh_Na) at P<0.05 level of significance. For ion leakage, genotypic differences were highly significant (P<0.0001). It ranged from 27% to 72%, indicating a wide variation in the membrane permeability across 49 genotypes under salt stress. The exotic donor cultivars from IRRI showed low ion leakage not greater than 42%, while IR29 had 52%. Among the USA varieties, salt tolerant lines were CL162, Cypress, and CL261, with ion leakage values of 33%, 40%, and 40%, respectively.
Percent reduction in chlorophyll concentration (Chl_R) among genotypes was highly significant (P<0.0001). Pokkali had 35% reduction while IR29 had 52%. Among the donor genotypes from IRRI, CSR II had the lowest chlorophyll reduction of 4%. FL478, IR944-102-2-3-2, TCCP-266, and Geumgangbyeo had 18%, 19%, 24%, and 26 % chlorophyll reduction, respectively. Among the USA genotypes, Cheniere, R609, LAH10, Cypress, Neptune, Caffey, and Templeton showed less than 40% chlorophyll reduction.
At the 7th day post salinization, salt injury scores (SIS) were significantly different between genotypes (P<0.0001). Pokkali had a mean SIS of 2.9 and IR29 had a score of 7.7. The donor genotypes showed varying levels of tolerance with SIS range between 2.9 and 6.1. The USA genotypes were sensitive, except for R609, LAH10, and Cypress with SIS of 4.4, 4.4 and 5.1, respectively. In addition, Cheniere, Roy J, Jupiter, Neptune, Caffey, Templeton, Taggert, and CL162 showed an intermediate response with SIS of 5.9 to 6.2. The rest of the USA genotypes were highly sensitive to salt stress with SIS more than 7.0.
Other morphological responses to salinity such as root and shoot length, showed variation among genotypes. Root growth was inhibited in all genotypes, and the reduction was as high as 56%. However, analysis of variance for the percent root length reduction (RtL_R) did not show significant genotypic differences (P=0.9927). In contrast, percent shoot length reduction
(ShL_R) was significantly different (P<0.0001) among genotypes. Pokkali and Hasawi had the lowest growth reduction (34%) while IR29 was reduced by 40%. All USA genotypes displayed shoot growth reduction that ranged from 44-58%, indicating the sensitivity of USA genotypes to salt stress.
The Na+ and K+ concentration were determined in roots and shoots of the 49 genotypes. All genotypes grown in salinized medium showed an increased Na+ concentration in roots and shoots, while the K+ concentration was reduced when compared to non-salinized condition (data not shown). Varying concentrations of Na+ were observed among the genotypes. In general, shoot Na+ concentration was about two times the concentration of Na+ in roots. Analysis of variance showed that neither root Na+ nor shoot Na+ concentration was significantly different among genotypes, despite the higher concentration of Na+ in susceptible IR29 than Pokkali. The genotypic differences in root K+ concentration were also not statistically significant (P=0.3763) at 5% level of significance although the 49 genotypes showed differences in concentrations. In contrast, significant genotypic differences for shoot K+ concentration was observed among genotypes (P=0.0492). Donor genotypes from IRRI had shoot K+ concentrations that ranged from 900 to 1300 mmolkg-1. FL378 and Damodar had the highest shoot K+ concentration (1336 and 1333 mmolkg-1), while Pokkali and IR29 had shoot K+ concentrations of 995 and 821 mmolkg-1, respectively. On the other hand, all USA genotypes except Jazzman had low shoot K+ concentration ranging from 600 to 900 mmolkg-1. Variation in root Na+/K+ ratio (Rt_Na/K) was
not significant (P=0.2619), but in the shoot Na+/K+ ratio (Sh_Na/K), the difference was
significant (P=0.0160) among genotypes. Donor cultivars and Geumgangbyeo had lower shoot Na+/K+ ratios compared to USA genotypes. IR29 had a Na+/K+ ratio of 4 while Pokkali had a ratio of 2.7. Interestingly, LAH10, which showed a SIS of 4.4, had a ratio of 2.9, while Cocodrie, CL162, Rex, Cheniere, LA0702085, and Jazzman-2 had shoot Na+/K+ ratios between 3.0 and 3.5. 2.3.2 Correlation of traits related to salinity tolerance
To better understand the physiological traits that best describe salinity tolerance,
relationships among all traits were analyzed (Table 2.2). Individual correlation of traits showed that SIS was positive and highly correlated to ion_leak, chlorophyll % reduction, shoot length % reduction, and shoot Na+/K+ ratio, but negatively correlated to shoot K+ concentration. The patterns of correlations were the same for shoot Na+/K+ ratio and other traits. Shoot Na+/K+ ratio was positive and highly correlated to ion_leak, chlorophyll % reduction, and shoot length % reduction; it was highly but negatively correlated to shoot K+ concentration. Shoot length reduction was also positive and highly correlated to ion_leak and chlorophyll reduction. Shoot K+ was negatively correlated to ion_leak and shoot length reduction, but significantly and positively correlated to shoot Na+ and root Na+. Root Na+/K+ ratio was positively correlated to root Na+ and negatively correlated to root K+. Taken together, ANOVA and correlation results indicated that SIS, ion leakage, chlorophyll reduction, shoot length reduction, shoot K+
concentration, and shoot Na+/K+ ratio are important parameters in defining the levels of salinity tolerance.
2.3.3 Classification of 49 rice genotypes for salinity tolerance
Because of the significant genotypic differences and high correlations in SIS, ion leakage, chlorophyll reduction, shoot length reduction, shoot K+ concentration, and shoot Na+/K+
Table 2.2. Pearson correlation matrix of seedling traits in response to salt stress at 12 dSm-1 in rice genotypes.
SIS RtL_R Rt_Na Rt_K Rt_Na/K Ion_leak Chl_R ShL_R Sh_Na Sh_K Sh_Na/K
SIS 1 RtL_R -0.006 1 Rt_Na 0.0542 -0.136 1 Rt_K -0.123 -0.173 0.258 1 Rt_Na/K 0.115 0.125 0.446*** -0.350** 1 Ion_leak 0.474*** 0.0689 -0.075 -0.184 0.105 1 Chl_R 0.771*** 0.0547 0.111 -0.128 0.208 0.289* 1 ShL_R 0.538*** 0.124 -0.233 -0.106 0.011 0.470*** 0.442*** 1 Sh_Na 0.106 -0.338* 0.281 0.068 0.109 -0.138 0.257 -0.003 1 Sh_K -0.540*** -0.039 0.346** 0.222 0.083 -0.563*** -0.254 -0.435*** 0.318* 1 Sh_Na/K 0.644*** -0.208 -0.102 -0.265 0.038 0.473*** 0.431*** 0.373** 0.221 -0.746*** 1
SIS=salt injury score; Chl_R=% chlorophyll reduction; ShL_R= % shoot length reduction; RtL_R=% root length reduction; Ion_leak=index of injury by ion leakage; Rt_Na=root sodium concentration; Rt_K=root potassium concentration;
Rt_Na/K=N/K ratio in root; Sh_Na=shoot sodium concentration; Sht_K=shoot potassium concentration; Sh_Na/K=Na/K ratio in shoot.
*Significant at the 0.05 probability level. **Significant at the 0.01 probability level. *** Significant at the 0.001 probability level.
ratio, we decided to use these parameters in the cluster analysis for the phenotypic classification of rice genotypes in response to salinity stress. The phenogram generated by UPGMA computed from the six traits (SIS, Ion_leak, Chl_R, ShL_R, Sh_K, and Sh_Na/K) produced 5 major
clusters (Figure 2.1). From the ranking of their group SIS means, cluster I was assigned as highly tolerant (HT), with the lowest group mean of 4.3. As expected, cluster I grouped the known highly tolerant genotypes such as Pokkali, Nona Bokra, FL478, TCCP266, FL378, Hasawi, and Cheriviruppu. Cluster II had a group SIS mean of 5.8 and was classified as moderately tolerant (MT). The USA genotypes such as CL162, Jupiter, Jazzman, Templeton, Cypress, Neptune, and Caffey grouped together in cluster II. The highest group SIS mean (7.4) was observed for cluster III and hence classified as highly sensitive (HS). It included the sensitive check IR29 and ten other USA genotypes. Cluster IV had a group SIS mean of 4.7 and was considered as tolerant (T) group, which contained CSRII, Nipponbare, Geumgangbyeo, R609, and LAH10. Cluster V was classified as sensitive (S) with a group SIS mean of 7.4, where popular genotypes such as Roy J, Cocodrie, Bengal, Mermentau, and Jazzman2 were placed.
The Fisher linear discriminant analysis (FLDA) is an approach similar to logistic regression, but the computation is more like the MANOVA or canonical correlation. The procedure initially computes the Mahalanobis distance of each genotype to a group and then uses it to classify the genotype into a group to which it has the smallest generalized squared distance (Truxillo, 2008). Results of FLDA indicated an error rate of 6.9%, owing to the three genotypes that were
misclassified (B.3). IR1702, which was classified as moderately tolerant, should be placed in the tolerant group; Nipponbare should be classified as moderately tolerant instead of tolerant, and Jazzman2 should be grouped into the highly sensitive group instead of sensitive group. In FLDA,
Figure 2.1. Clustering of forty-nine genotypes by UPGMA based on Euclidean distance of six morphological and physiological trait responses to salinity stress.
however, the test of homogeneity of covariance matrices was significant (P<0.0001). Hence, we were prompted to use quadratic discriminant analysis (QDA) instead of FLDA. In QDA, the result indicated a 0 % error rate, confirming that our genotype classification based on the clustering method was robust.
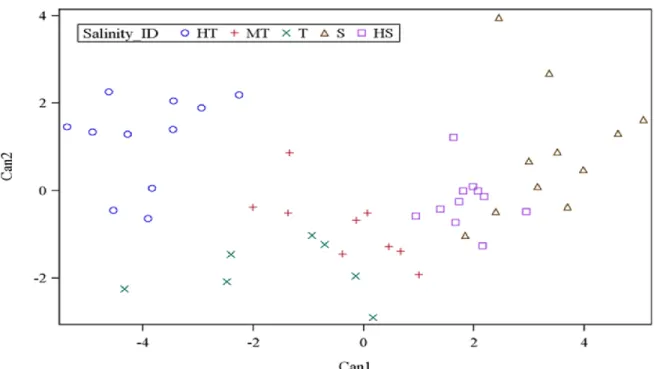
2.3.4 Differentiation of salinity groups by canonical discriminant function and MANOVA To further understand the grouping and to assess the extent of differences between salinity groups, canonical discriminant analysis was employed. Multivariate test statistics of nonlinear prediction of group membership based on the six physiological traits was highly significant in all
statistics, thus confirming the group membership prediction. Based on 5 groups and 6 trait variables, 2 canonical discriminant functions were high and significa ntly correlated for the prediction of genotype membership into salinity groupings. Canonical discriminant function 1 (Can1) and canonical discriminant function 2 (Can2) accounted for 81% and 12% of the variance in the traits, respectively (B.4). The loading of the variables to canonical discriminant functions showed that SIS, Chl_R, ShL_R, Ion_leak, and Sh_Na/K were positive and highly correlated to Can1, while Sh_K was negatively correlated (B.5). From the variance explained by Can1 and the loading of trait variables, it appeared that Can1 is a measure of the overall characteristics of salinity tolerance by the six parameters. In contrast, Can2 was positively correlated to Sh_K and Chl_R but negatively correlated to ShL_R and Ion_leak. Therefore, this result suggests that Can2 differentiates genotypes based on their K+ and chlorophyll concentrations. In Can1, the
maximum separation of group means was observed between HT and S (-3.96 vs 3.37) and mean separation between HS and T was 1.86 vs -1.55. Examination of Can2 showed separation of HT from the T group (1.17 vs -1.84) and separation of MT from the S group (-0.81 vs 0.90). All groups with negative mean values to Can1 had some tolerance to salinity (HT, T, and MT). In contrast, HS and S groups had positive mean values to Can1.
In the plot of salinity groups against Can1 and Can2, the MT group was placed in the center between the T and HS groups (Figure 2.2). The HT group had negative mean to Can1 (-3.96) and positive mean to Can2 (1.17), indicating that HT had low values in SIS, Ch_R, ShL_R, Ion_leak, and Sh_Na/K but with positive high K+ concentration. The T group had both negative mean values to Can1 (-1.55) and Can2 (-1.84), indicating that the T group is like the HT group, but it has lower K+ concentration as compared to HT group. Between T and MT, the T has higher negative mean values in both Can1 and Can2. The Sensitive (S) group had positive mean values
Figure 2.2. Population structure of 49 rice genotypes by canonical discriminant analysis of morphological and physiological trait responses to salt stress.
to Can1 (3.37) and Can2 (0.90), indicating higher mean values in all traits and low K+
concentration. The highly sensitive (HS) group was the total opposite of HT group, with positive and negative mean values in Can1 (1.86) and Can2 (-0.23), respectively.
Further analysis by multivariate analysis of variance (MANOVA) for 6 variable traits across 5 groups indicated that the groups are significantly different. Moreover, LS means comparison for each trait between groups showed significant differences of HT from S and HS groups in all traits (Table 2.3, B.6). Conversely, the T group was significantly different from the HT group in ShL_R, ion leakage, and Sh_K, while a significant difference was observed only in Chl_R between T and MT. On the other hand, the S group was significantly different to MT in SIS, Chl_R, and ion leakage; and significantly different to HS in Chl_R alone. Nonetheless, overall pairwise contrasts between groups were highly significant in all comparisons, indicating the complete separation between groups based on the six quantitative traits.
Table 2.3. Least square (LS) means of salinity groups in six parameters.
Group SIS Chl_R ShL_R Ion_leak Sh_K Sh_Na/K
HT 4.27 32.84 39.58 32.98 1111.67 2.57
T 4.68 24.59 46.27 53.89 838.97 3.20
MT 5.82 42.18 48.93 44.57 878.65 3.60
S 7.37 68.63 47.59 55.68 797.46 3.92
HS 7.41 54.52 49.04 49.39 785.04 3.83
SIS=salt injury score; Chl_R=% reduction in chlorophyll; ShL_R=shoot length % reduction; Ion_leak=index of injury by ion leakage; Sht_K=shoot potassium concentration; Sh_Na/K=Na/K ratio in shoot; HT=highly tolerant; T=tolerant; MT=moderately tolerant; S=sensitive; HS=highly sensitive.
2.3.5 Genetic diversity of 49 rice genotypes
The genetic relationship among the genotypes was assessed to identify parental genotypes for the breeding program and to determine if the observed clustering of 49 genotypes based on salinity stress responses can be explained by their DNA profile. An unweighted neighbor-joining tree of 49 genotypes, based on 427 alleles using 146 SSR markers, separated the genotypes into two major groups of indica (clusters A, B) and japonica (clusters C, D) subspecies with two sub-clusters within a group (Figure 2.3).
Analysis of molecular variance showed significant genetic differences among the four populations (PhiPT= 0.505 at P (rand perm. 999) =0.001) with 49% and 51% variance within and among populations, respectively (Table 2.4). Differentiation of the clusters showed that USA varieties had fewer numbers of alleles, lower percentages of polymorphic loci and very few unique alleles compared to indica genotypes. Based on Shannon’s information index, the donor genotypes (indica group) showed higher genetic diversity than the USA genotypes even with fewer sample sizes (Table 2.5). Similarly, Nei’s genetic distance between the C and D clusters is only 0.093, indicating a narrow genetic diversity among the USA genotypes. The relationship
Figure 2.3. Genotypic clustering by unweighted neighbor-joining tree showing the genetic relationship among the 49 rice genotypes based on 146 SSR markers. Horizontal bar indicates distance by dice coefficient. Numbers on nodes are bootstrap values based on 100 iterations.
Table 2.4. Summary of analysis of molecular variance (AMOVA).
Source of variation df SS MS Est. Variance % Variance
Among Populations 3 1630.032 543.344 46.600 51%
Within Populations 45 2054.132 45.647 45.647 49%
Total 48 3684.163 92.247 100%
PhiPT : 0.505
P(rand perm. 999) 0.001
Populations refer to the rice clusters (A, B, C, and D) in Figure 2.3. df =degree of freedom; SS=sum of squares; MS=mean square; Est. Variance=estimated variance; % Variance=percent variance; PhiPT=estimate of genetic distance among populations; P (rand