COVENTRY LOCAL SCHOOL DISTRICT SUMMIT COUNTY
PERFORMANCE AUDIT JULY 2016
To the residents, elected officials, management, and stakeholders of the Coventry Local School District,
In consultation with the Ohio Department of Education, the Auditor of State’s Ohio Performance Team conducted a performance audit of the District to provide an independent assessment of operations and management. Functional areas selected for review were identified with input from District administrators and were selected due to strategic and financial importance to the District. Where warranted, and supported by detailed analysis, this performance audit report contains recommendations to enhance the District’s overall efficiency and effectiveness. This report has been provided to the District and its contents have been discussed with the appropriate elected officials and District management.
The District has been encouraged to use the management information and recommendations contained in the performance audit report. However, the District is also encouraged to perform its own assessment of operations and develop alternative management strategies independent of the performance audit report. The Auditor of State has developed additional resources to help Ohio governments share ideas and practical approaches to improve accountability, efficiency, and effectiveness.
SkinnyOhio.org: This website, accessible at http://www.skinnyohio.org/, is a resource for smarter streamlined government. Included are links to previous performance audit reports, information on leading practice approaches, news on recent shared services examples, the Shared Services Idea Center, and other useful resources such as the Local Government Toolkit. The Shared Services Idea Center is a searchable database that allows users to quickly sort through shared services examples across the State. The Local Government Toolkit provides templates, checklists, sample agreements, and other resources that will help local governments more efficiently develop and implement their own strategies to achieve more accountable, efficient, and effective government.
This performance audit report can be accessed online through the Auditor of State’s website at http://www.ohioauditor.gov and choosing the “Search” option.
Sincerely,
Dave Yost Auditor of State July 19, 2016
Table of Contents
Executive Summary ... 1
Purpose and Scope of the Audit ... 1
Performance Audit Overview ... 1
Audit Methodology ... 2
Summary of Recommendations ... 4
Background ... 6
Recommendations ... 9
R.1 Establish open enrollment capacity limits ... 9
R.2 Optimize the number of open enrollment students accepted into the District ... 11
R.3 Develop a multi-year capital improvement plan ... 20
R.4 Consider eliminating General Fund subsidy of extracurricular activities ... 21
R.5 Reduce 19.0 FTE general education teacher positions ... 22
R.6 Reduce 3.0 FTE ESP teacher positions ... 23
R.7 Reduce 2.0 FTE office/clerical positions ... 25
R.8 Renegotiate collective bargaining agreement provisions ... 26
R.9 Reduce health insurance costs ... 28
R.10 Effectively monitor the transportation contract ... 33
R.11 Procure fuel using the DAS cooperative purchasing program ... 34
Appendix A: Scope and Objectives ... 36
Appendix B: Additional Comparisons ... 37
Appendix C: Five-Year Forecasts ... 40
Page | 1
Executive Summary
Purpose and Scope of the Audit
In consultation with the Ohio Department of Education (ODE), the Auditor of State (AOS) determined that it was appropriate to conduct a performance audit of the Coventry Local School District (CLSD or the District) pursuant to Ohio Revised Code § 3316.042. The purpose of this performance audit was to improve CLSD’s financial condition through an objective assessment of economy, efficiency, and/or effectiveness of the District’s operations and management. See
Background for a full explanation of the District’s financial condition.
The following scope areas were selected for detailed review and analysis in consultation with the District, including Open Enrollment, Financial Management, Human Resources, Facilities, and Transportation. See Appendix A: Scope and Objectives for detailed objectives developed to assess operations and management in each scope area.
Performance Audit Overview
Performance audits provide objective analysis to assist management and those charged with governance and oversight to improve program performance and operations, reduce costs, facilitate decision making by parties with responsibility to oversee or initiate corrective action, and contribute to public accountability.
The United States Government Accountability Office develops and promulgates Government Auditing Standards that establish a framework for performing high-quality audit work with competence, integrity, objectivity, and independence to provide accountability and to help improve government operations and services. These standards are commonly referred to as Generally Accepted Government Auditing Standards (GAGAS).
OPT conducted this performance audit in accordance with GAGAS. These standards required that OPT plan and perform the audit to obtain sufficient, appropriate evidence to provide a reasonable basis for findings and conclusions based on the audit objectives. OPT believes that the evidence obtained provides a reasonable basis for our findings and conclusions based on the audit objectives.
Page | 2
Audit Methodology
To complete this performance audit, auditors gathered data, conducted interviews with numerous individuals associated with the areas of District operations included in the audit scope, and reviewed and assessed available information. Assessments were performed using criteria from a number of sources, including:
• Peer districts; • Industry standards; • Leading practices; • Statutes; and
• Policies and procedures.
In consultation with the District, three sets of peer groups were selected for comparisons contained in this report. A “Primary Peers” set was selected for general, District-wide comparisons. This peer set was selected from a pool of demographically similar districts with relatively lower per pupil spending and higher academic performance. A “Local Peers” set was selected for a comparison of compensation, benefits, and collective bargaining agreements, where applicable. This peer set was selected specifically to provide context for local labor market conditions. Finally, a “Transportation Peers” set was selected for transportation operating and spending comparisons. This peer set was selected specifically for transportation operational comparability and included only those districts with similar area (square mileage) and population density; two significant factors that impact transportation efficiency. Table 1 shows the Ohio school districts included in these peer groups.
Table 1: Peer Group Definitions
Primary Peers
• Clark-Shawnee Local School District (Clark County)
• Clearview Local School District (Lorain County)
• Hubbard Exempted Village School District (Trumbull County)
• Indian Valley Local School District (Tuscarawas County)
• Norton City School District (Summit County)
• West Branch Local School District (Mahoning County)
Local Peers (Compensation, Benefits, and Bargaining Agreements)
• Copley-Fairlawn City School District (Summit County)
• Green Local School District (Summit County)
• Norton City School District (Summit County)
Transportation Peers
• Alliance City School District (Stark County)
• East Liverpool City School District (Columbiana County)
• Sheffield-Sheffield Lake City School District (Lorain County)
• Tallmadge City School District (Summit County)
• Winton Woods City School District (Hamilton County)
Where reasonable and appropriate, peer districts were used for comparison. However, in some operational areas, industry standards or leading practices were used for primary comparison. Sources of industry standards or leading practices used in this audit include: American School and University Magazine (AS&U), the Government Finance Officers Association (GFOA), the
Page | 3 National Center for Education Statistics (NCES), the National State Auditors Association (NSAA), the Ohio Department of Administrative Services (DAS), the Ohio Department of Education (ODE), and the Ohio State Employment Relations Board (SERB).District policies and procedures as well as pertinent laws and regulations contained in the Ohio Administrative Code (OAC) and the Ohio Revised Code (ORC) were also assessed.
The performance audit involved information sharing with the District, including drafts of findings and recommendations related to the identified audit areas. Periodic status meetings throughout the engagement informed the District of key issues impacting selected areas, and shared proposed recommendations to improve operations. The District provided verbal and written comments in response to various recommendations, which were taken into consideration during the reporting process.
AOS and OPT express their appreciation to the elected officials, management, and employees of the Coventry Local School District for their cooperation and assistance throughout this audit.
Page | 4
Summary of Recommendations
The following table summarizes performance audit recommendations and financial implications, where applicable.
Table 2: Summary of Recommendations
Recommendations Savings
R.1 Establish open enrollment capacity limits N/A
R.2 Optimize the number of open enrollment students accepted into the District $1,582,000
R.3 Develop a multi-year capital improvement plan N/A
R.4 Consider eliminating General Fund subsidy of extracurricular activities $215,000
R.5 Reduce 19.0 FTE general education teacher positions $1,080,700
R.6 Reduce 3.0 FTE ESP teacher positions $203,000
R.7 Reduce 2.0 FTE office/clerical positions $77,800
R.8 Renegotiate collective bargaining agreement provisions N/A
R.9 Reduce health insurance costs $51,300
R.10 Effectively monitor the transportation contract N/A
R.11 Procure fuel using the DAS cooperative purchasing program $11,700
Cost Savings Adjustments 1 ($1,361,500)
Total Cost Savings from Performance Audit Recommendations $1,860,000
1
Savings associated with the staffing recommendations, R.5, R.6, and R.7 were removed from the total because these savings are also captured in R.2.
Table 3a shows the District’s ending fund balances, including renewal/replacement levies, as projected in the May 2016 five-year forecast.1 Further, Table 3a includes the annual savings identified in this performance audit and the estimated impact that implementation of the recommendations will have on the ending fund balances.
Table 3a: Financial Forecast with Performance Audit Recommendations
With Renewal/Replacement Levies FY 2015-16 FY 2016-17 FY 2017-18 FY 2018-19 FY 2019-20
Ending Fund Balance with
Renewal/Replacement Levies $476,299 ($1,167,230) ($3,211,646) ($2,911,433) ($2,685,444) Cumulative Balance of Performance
Audit Recommendations $0 $63,000 $1,923,000 $3,783,000 $5,643,000
Final Ending Fund Balance $476,299 ($1,104,230) ($1,288,646) $871,567 $2,957,556
Source: CLSD, ODE, and performance audit recommendations
Note: Although the District should seek to implement recommendations as soon as practicable there may be a reasonable delay in doing so. As a result, cost savings have been applied to FY 2016-17 through FY 2019-20 only.
As shown in Table 3a, the combination of fully implementing the performance audit recommendations, along with voter approval of renewal/replacement levies, would allow the District to fully address projected deficits within the final two years of the forecast period.
1 ORC § 5705.412 requires school district appropriations, contracts, and wage increases to be accompanied by a
signed certificate certifying that necessary operating revenue is available to not only meet new obligations, but also to maintain all existing personnel and programs through the duration of the fiscal year. Necessary operating revenue includes all existing levies, renewal/replacement of existing levies, and estimates of all other sources of revenue.
Page | 5
Table 3b shows a similar scenario, but without accounting for renewal/replacement levies.
Table 3b: Financial Forecast with Performance Audit Recommendations
Without Renewal/Replacement Levies FY 2015-16 FY 2016-17 FY 2017-18 FY 2018-19 FY 2019-20
Ending Fund Balance without
Renewal/Replacement Levies $476,299 ($1,167,230) ($3,211,646) ($4,386,946) ($7,111,982) Cumulative Balance of Performance
Audit Recommendations $0 $63,000 $1,923,000 $3,783,000 $5,643,000
Final Ending Fund Balance $476,299 ($1,104,230) ($1,288,646) ($603,946) ($1,468,982)
Source: CLSD, ODE, and performance audit recommendations
Note: Although the District should seek to implement recommendations as soon as practicable there may be a reasonable delay in doing so. As a result, cost savings have been applied to FY 2016-17 through FY 2019-20 only.
As shown in Table 3b, without renewal/replacement levies, the District will need to consider additional expenditure reductions, as it would still be projected to experience a negative ending fund balance of nearly $1.5 million in FY 2019-20. Furthermore, if the District does not implement the recommendation to optimize open enrollment, implementing the remaining recommendations, which include aggressive staffing reductions, would result in a negative ending fund balance of more than $2.1 million in FY 2019-20.
It is possible that in pursuing the options necessary to balance the budget and achieve fiscal stability the District could face the unintended consequence of reductions in future federal aid, and/or the need to repay federal funds previously received, due to inability to meet federal maintenance of effort (MOE) requirements. Federal funding is designed to supplement local operations within specific program areas such as Title I, Title II, and IDEA Part B. Because this funding is meant to be supplemental, MOE requirements are put into place to ensure that all schools maintain an acceptable level of local spending rather than shifting to an over-reliance on federal funding, also referred to as supplanting.
Federal funds are supplemental to District operations and pursuit of these supplemental funds does not alleviate the obligation to maintain a balanced budget. In exercising the responsibility to maintain a balanced budget, the District will need to critically evaluate the potential impact of planned changes on program expenditures and/or census/enrollment (i.e., the two major inputs used to calculate MOE).
ODE is charged with monitoring school districts’ compliance with MOE requirements and is also in a position of working with districts to facilitate seeking a waiver from the US Department of Education when certain conditions are evident. Two such conditions specific to Title I include:
• An exceptional or uncontrollable circumstance such as natural disaster, and
• A precipitous decline in financial resources (e.g., due to enrollment or loss of tax revenue).
The District should pursue necessary steps to balance, achieve, and maintain long-term fiscal stability, while working with ODE to minimize any unnecessary, unforeseen consequences, including seeking a waiver of MOE requirements, if applicable.
Page | 6
Background
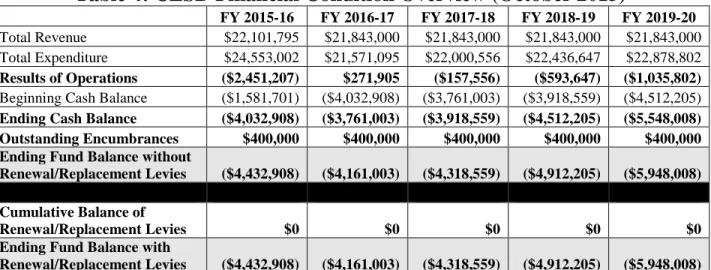
On December 4, 2015, CLSD was placed in fiscal emergency by the Ohio Department of Education (ODE) and Ohio Auditor of State (AOS) due to the existence of deficit conditions and the District’s inability to submit a financial recovery plan. Table 4 shows the District’s total revenues, total expenditures, results of operations, beginning and ending cash balances, and ending fund balances as projected in its October 2015 five-year forecast. This information is an important measure of the financial health of the District and serves as the basis for identification of fiscal distress conditions.
Table 4: CLSD Financial Condition Overview (October 2015)
FY 2015-16 FY 2016-17 FY 2017-18 FY 2018-19 FY 2019-20
Total Revenue $22,101,795 $21,843,000 $21,843,000 $21,843,000 $21,843,000
Total Expenditure $24,553,002 $21,571,095 $22,000,556 $22,436,647 $22,878,802
Results of Operations ($2,451,207) $271,905 ($157,556) ($593,647) ($1,035,802)
Beginning Cash Balance ($1,581,701) ($4,032,908) ($3,761,003) ($3,918,559) ($4,512,205)
Ending Cash Balance ($4,032,908) ($3,761,003) ($3,918,559) ($4,512,205) ($5,548,008) Outstanding Encumbrances $400,000 $400,000 $400,000 $400,000 $400,000 Ending Fund Balance without
Renewal/Replacement Levies ($4,432,908) ($4,161,003) ($4,318,559) ($4,912,205) ($5,948,008)
Cumulative Balance of
Renewal/Replacement Levies $0 $0 $0 $0 $0
Ending Fund Balance with
Renewal/Replacement Levies ($4,432,908) ($4,161,003) ($4,318,559) ($4,912,205) ($5,948,008)
Source: CLSD and ODE
As shown in Table 4, the District’s October 2015 five-year forecast included a deficit of over $4.4 million in FY 2015-16. This deficit condition was a direct result of expenditures continuing to outpace revenues, increasing the negative ending cash balances over the forecast period. Left unaddressed, and without the impact of renewal/replacement levies, these conditions were projected to result in a cumulative deficit of over $5.9 million by FY 2019-20.
In accordance with ORC § 3316.08, AOS certifies the operating deficit for a school district placed in fiscal emergency. AOS certified the District’s FY 2015-16 deficit at approximately $4.8 million, which is almost $400,000 more than the District projected in the October 2015 five-year forecast. The District received more than $4.8 million in State Solvency Assistance funds to cover its operating deficit, which will be paid back over two years.
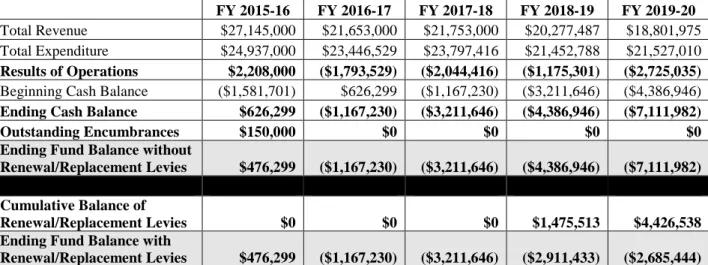
Page | 7 In May 2016, as required by ORC § 5705.391 and OAC 3301-92-04, the District approved an updated five-year forecast which incorporates the State Solvency Assistance funds. Table 5
shows total revenues, total expenditures, results of operations, beginning and ending cash balances, and year-ending fund balance as projected in the updated forecast.
Table 5: CLSD Financial Condition Overview (May 2016)
FY 2015-16 FY 2016-17 FY 2017-18 FY 2018-19 FY 2019-20
Total Revenue $27,145,000 $21,653,000 $21,753,000 $20,277,487 $18,801,975
Total Expenditure $24,937,000 $23,446,529 $23,797,416 $21,452,788 $21,527,010
Results of Operations $2,208,000 ($1,793,529) ($2,044,416) ($1,175,301) ($2,725,035)
Beginning Cash Balance ($1,581,701) $626,299 ($1,167,230) ($3,211,646) ($4,386,946)
Ending Cash Balance $626,299 ($1,167,230) ($3,211,646) ($4,386,946) ($7,111,982)
Outstanding Encumbrances $150,000 $0 $0 $0 $0
Ending Fund Balance without
Renewal/Replacement Levies $476,299 ($1,167,230) ($3,211,646) ($4,386,946) ($7,111,982)
Cumulative Balance of
Renewal/Replacement Levies $0 $0 $0 $1,475,513 $4,426,538 Ending Fund Balance with
Renewal/Replacement Levies $476,299 ($1,167,230) ($3,211,646) ($2,911,433) ($2,685,444)
Source: CLSD and ODE
As shown in Table 5, the District has projected a deteriorating financial condition in its May 2016 five-year forecast. Specifically, the new five-year forecast shows a reduced negative ending fund balance in the first four years due to the District receiving more than $4.8 million in State Solvency Assistance funds in FY 2015-16. The increased negative ending fund balance in FY 2019-20 is due to a decrease in revenue associated with the expiration of an emergency levy in FY 2017-18. If the emergency levy is renewed, the negative ending fund balance will decrease to nearly $2.7 million.
Revenue is not directly controlled by school districts, but instead by federal and State laws, and support from local residents. ODE uses the Local Tax Effort Index to compare means-adjusted taxpayer support between school districts in Ohio. This index reflects the extent of effort the residents of a school district make in supporting public elementary and secondary education in relation to their ability to pay. A local tax effort of 1.0 represents the statewide average of all school districts. The District’s local tax effort was 1.2795 for FY 2014-15 while the peer average was 0.8858, signifying that the District receives 44.4 percent more means-adjusted local taxpayer support than its primary peers. Further, the District’s local tax effort was higher than the Summit County average of 0.9167 and the fourth highest in Summit County.
Eliminating future deficits can be accomplished by decreasing expenditures, increasing revenue, or a combination of both. Management control over operating decisions can directly affect expenditures. Consequently, the District's management, operations, and resulting expenses were examined by OPT in an effort to identify areas of potential cost savings. It is important to note the District’s long history of allowing non-resident students to attend via open enrollment. In FY 2014-15, 37.1 percent of the District’s total student enrollment was from open-enrolled students. See R.1 and R.2 for additional discussion on open enrollment. Further, the District has significant debt, which decreases the resources it can direct to student instruction. In FY
2014-Page | 8 15, the District’s debt service payments totaled approximately $1.6 million, which included payments for House Bill (H.B.) 264 energy conservation projects2, a lease for modular classrooms, and a loan from the Stark County Council of Governments. (See R.9 for additional discussion.)
2
The H.B. 264 School Energy Program allows school districts to make energy efficiency improvements to their buildings and use the cost savings to pay for those improvements.
Page | 9
Recommendations
R.1 Establish open enrollment capacity limits
Open enrollment was passed into law by the Ohio General Assembly as part of the Omnibus Educational Reform Act of 1989, Senate Bill (S.B.) 140. Initially, students were only allowed to open enroll into adjacent school districts. However, in July 1998, the General Assembly passed House Bill (H.B.) 497 which permitted students to enroll in any school district in the State and eliminated the authorization for a school district to object to the enrollment of a district student in another school district that allows open enrollment.
ORC § 3313.98 requires all school districts to adopt a resolution establishing a policy that either entirely prohibits open enrollment into their district, permits open enrollment of all students, or permits open enrollment of students only from adjacent districts. CLSD has adopted a resolution permitting open enrollment of all students.
Further, ORC § 3313.98 requires school districts with an open enrollment policy permitting the enrollment of students from all districts to have additional procedures. These include:
• “Application procedures, including deadlines for application and for notification of students and the superintendent of the applicable district whenever an adjacent or other district student’s application is approved.
• Procedures for admitting adjacent or other district applicants free of any tuition obligation to the district’s schools, including, but not limited to:
o The establishment of district capacity limits by grade level, school building, and education programs;
o A requirement that all native students wishing to be enrolled in the district will be enrolled and that any adjacent or other district students previously enrolled in the district shall receive preference over first-time applicants; [and]
o Procedures to ensure that an appropriate racial balance is maintained in the district schools.”
CLSD’s open enrollment policy states that “The Board permits any student from any other district in the state to apply and enroll in the District schools free of any tuition obligation, provided that all procedures as outlined in the administrative regulations are met. Requirements include:
• Application procedures, including deadlines for application and notification to students of acceptance or rejection and the superintendents of other districts whenever another district’s students application is approved;
• Procedures for admission;
• District capacity limits by grade level, school building and educational programs are determined;
• Resident students and previously enrolled District students have preference over first-time applicants;
Page | 10 • No limitations on admitting students with disabilities, unless services required in an
Individualized Education Program (IEP) are not available in the District; • No requirement that the student be proficient in the English language;
• No rejection of any applying student because the student has been subject to disciplinary proceedings, except an applicant who has been suspended or expelled by another district for 10 consecutive days or more in the term for which admission is sought or in the term immediately preceding the term for which admission is sought; and
• Procedures to ensure maintenance of an appropriate racial balance in the District’s schools.”
Although the District’s open enrollment policy conforms to the broad requirements in ORC § 3313.98, it has not established formal capacity limits by grade level, school building, and/or educational program. The District has a long history of significant incoming open enrollment students. The number of incoming open enrollment students ranged from a low of 760 to a high of 834 from FY 2010-11 to FY 2014-15. The District’s total student to general education teacher ratio ranged from a low of 22.7:1 to a high of 26.1:1 during this same time. The District’s recent practice, however, has been to limit the number of open enrollment students to that which does not require hiring an additional teacher. This practice is not formally detailed in a Board policy or administrative guideline.
Hubbard Exempted Village School District (HEVSD) created administrative guidelines to define its open enrollment policy. Specifically, HEVSD requires each building principal to “notify the Superintendent by March 1st [of] the programs and classrooms which have space available for students from another Ohio district and for tuition students.” Further, the “number of openings in a particular program for students from other Ohio districts will be determined by optimum size for a particular program, classroom/school building, or grade level which is the number of students that can be accommodated without increasing District expenditures for staff or equipment.” HEVSD posts on its website the grades for which it is accepting open enrollment applications.
The District should establish capacity limits by grade level, school building, and/or educational program for the number of open enrollment students accepted into the District and define those limits in a Board policy or administrative guideline. Following this policy would help to annually predetermine the number of open enrollment students to accept based on openings in each grade level, school building, and educational program. Further, it would help the District define staffing levels and space availability without increasing expenditures.
Page | 11
R.2 Optimize the number of open enrollment students accepted into the District
Financial Overview
The District’s incoming open enrollment student population has been relatively constant. From FY 2010-11 to FY 2014-15, the number of incoming open enrollment students ranged from a low of 760 to a high of 834. Further, the percent of open enrollment students to total students ranged from 33.9 to 38.7 percent during this time frame.
Chart 1 shows the District’s total revenues and other financing sources compared to its total expenditures and other financing sources from FY 2010-11 to FY 2014-15. This analysis shows if the District’s revenues were above or below its expenditures and how those patterns of saving or deficit spending are trending over time.
Chart 1: Historical Revenue and Expenditure Comparison
Source: CLSD and ODE
Note: See Table 5 for projected revenues, expenditures, results of operations, and resulting fund balances as of the District’s May 2016 five-year forecast.
As shown in Chart 1, the District’s expenditures exceeded its revenues in each year except for FY 2011-12. However, in FY 2011-12, the District borrowed $1.5 million to avoid deficit spending and meet payroll expenses. As such, for each of the last five complete fiscal years, the District’s expenses have continued to outpace revenues, without borrowed funds.
$19,000,000 $20,000,000 $21,000,000 $22,000,000 $23,000,000 $24,000,000 $25,000,000
Total Revenues & Other Financing Sources
Total Expenditure & Other Financing Sources
Page | 12
Detailed Revenue Analysis
Open enrollment is funded by the State primarily through the Opportunity Grant, which in FY 2014-15 was $5,800 per student.3 School districts receive the entire opportunity grant amount per student for open enrollment and a portion of the grant for resident students through the State Share Index which is a calculation used to determine a district’s capacity to raise local revenue when distributing State funds. The basis for this calculation is the district’s three-year average property value, median income index, and a wealth index. Using this formula, no district will have a State share index greater than 0.90 or less than 0.05. In FY 2014-15, CLSD received slightly over $4.2 million in State revenue with an applied State Share Index of 0.3283, which translates to $2,804 in State revenue per student.
Chart 2 compares CLSD’s State revenue per resident student to the revenue generated from an open enrolled student for FY 2014-15.4 This comparison is important because it provides context as to the extent the State determines a district’s wealth in relation to the revenue it receives per resident student and how that revenue compares to an open enrolled student.
Chart 2: State Revenue per Student by Type
Source: CLSD and ODE
As shown in Chart 2, a CLSD resident student generates $3,193, or 53.2 percent, less State revenue compared to an open enrolled student.
3 The Opportunity Grant increased from $5,800 in FY 2014-15 to $5,900 in FY 2015-16 and will increase to $6,000
in FY 2016-17.
4
Medicaid was omitted from State revenue because it does not have a unique receipt code in the Uniform School Accounting System (USAS).
$2,804 $5,997 $0 $1,000 $2,000 $3,000 $4,000 $5,000 $6,000 $7,000
Page | 13 Local revenues are generated from the District’s property taxes and voted tax levies. ODE created a Local Tax Effort Index to reflect the extent of effort the residents of a school district make in supporting public elementary and secondary education, while also considering the ability of district residents to pay. A value of 1.0 indicates average local tax support, while values below or above 1.0 reflect below average or above average support, respectively. CLSD’s local tax effort for FY 2014-15 was 1.2795, signifying that its residents contribute more on a means-adjusted basis than the State average. The ability to generate a significant level of revenue from local taxes has a direct effect on the funding to educate a resident student.
Chart 3 shows the District’s local and State revenue per resident student compared to the State revenue per open enrolled student for FY 2014-15.
Chart 3: State and Local Revenue per Student by Type
Source: CLSD and ODE
1 Local revenue excludes revenue associated with open enrollment and the Casino Tax.
As shown in Chart 3, CLSD’s local and State revenue per student was 85.1 percent greater in comparison to the per student revenue received for open enrollment. Not all revenue, however, can be dedicated to a student’s education. For example, expenditures associated with capital outlay and debt service are also funded through local taxes. In FY 2014-15, CLSD allocated approximately $100,000 for capital outlay and approximately $1.8 million for debt service from local taxes. $2,804 $5,997 $8,299 $0 $2,000 $4,000 $6,000 $8,000 $10,000 $12,000
Page | 14
Chart 4 breaks these allocation levels out, showing the amount of revenue that is dedicated to paying for capital outlay and debt service expenditures on a per student basis. This is important to examine as it shows the amount of local tax revenue generated per student that did not go to resident students’ classroom education.
Chart 4: State and Local Revenue Dedicated to Student Education
Source: CLSD and ODE
As shown in Chart 4, local tax revenue per student decreased from $8,299 to $7,063. This means that $1,236, or 14.9 percent, of the locally generated tax revenue per student is dedicated to paying off the District’s debt and does not go to the education of resident students. Also, the concept of dilution is important in the context of local tax revenue compared to open enrollment revenue. Because open enrollment generates $5,997 per student compared to $7,063 generated from local taxes, which stay with the student’s resident district, every open enrolled student diminishes the tax efforts of the local community once the open enrollment into the District is greater than the open enrollment out of the District.
$2,804 $2,804 $8,299 $7,063 $0 $2,000 $4,000 $6,000 $8,000 $10,000 $12,000
State & Local Revenue per Resident Student State & Local Revenue per Resident Student for Education
Page | 15
Chart 5 shows this dilution factor, on a per student basis, for FY 2014-15.
Chart 5: Revenue Dilution per Student
Source: CLSD and ODE
As shown in Chart 5, the average revenue generated from a resident student, when open enrollment revenue is added, diluted the total revenue per student by $1,166, or 13.4 percent. This is because State revenue is calculated using only resident students. Districts will receive the revenue based on their State Share Index, despite what district their resident students attend.
Although per-student revenue decreased with open enrollment, further analysis was completed to determine if open enrollment students have a net positive or negative impact on the District's financials after accounting for expenditures per student.
$9,867 $5,997 $8,701 $0 $2,000 $4,000 $6,000 $8,000 $10,000 $12,000
State & Local Revenue per Resident Student
State Revenue per Open Enrolled Student
State & Local Revenue per Total Student
Page | 16
Detailed Expenditure Analysis
Chart 6 shows expenditures, by function, attributed to educating open enrollment students and compares the open enrollment cost to the resident student cost for FY 2014-15.5 The open enrollment costs were calculated by multiplying the percent of open enrollment students with expenditures in each function as follows:
• Special instruction expenditures were multiplied by the percent of special education open enrollment students (20.9 percent for FY 2014-15);
• Pupil transportation expenditures were multiplied by the percent of open enrollment students receiving transportation services (21.2 percent for FY 2014-15); and
• All other expenditures were multiplied by the total percent of open enrollment students (37.7 percent for FY 2014-15).
This type of analysis illustrates the relationship between the costs attributed to resident students and open enrollment students.
Chart 6: FY 2014-15 Costs Attributed to Open Enrollment
Source: CLSD and ODE
As show in Chart 6, resident student costs exceed open enrollment costs in every function.
5
Not all expenditures are available for, or have a direct relationship to, open enrolled students. Further, the Uniform School Accounting System, the structure under which all school districts are required to account for revenues and expenses, specifically defines certain expenses as being allocated specifically toward resident students. For example, Function 1131 Prepatory, Post-Secondary Education Curriculum is defined as being for resident students. The detailed expenditures shown here exclude all categories of expenditure that are specifically prohibited as well as categories of expenditure where no reasonable and appropriate relationship was determined to exist between an category and the cost to educate open enrolled students.
$0 $1,000,000 $2,000,000 $3,000,000 $4,000,000 $5,000,000 $6,000,000 $7,000,000 $8,000,000 $9,000,000 $10,000,000
Open Enrollment Cost Resident Student Cost
Page | 17
Table 6 shows the actual dollar amounts for the expenditures in Chart 6. Further, it compares the open enrollment cost to the revenue generated by these students. This type of analysis illustrates the net revenue or loss generated by open enrollment.
Table 6: FY 2014-15 Costs and Revenue Attributed to Open Enrollment
Total Students 2,076
Open Enrollment Students 782
Percentage of Open Enrollment Students 37.7%
Expenditure Type Total Cost Open Enrollment Cost
Regular Instruction 1 $9,338,970 $3,534,458
Special Instruction 2 $2,754,341 $657,237
Vocational Instruction $83,667 $31,521
Support Services Pupils $954,591 $311,078
Support Services Instructional Staff $201,558 $75,934
Support Services Administrative $1,693,455 $445,580
Operation and Maintenance of Plant Services $2,225,704 $38,695
Support Services Pupil Transportation $1,350,307 $285,727
Support Services Central $614,987 $231,336
Extracurricular Activities 3 $505,523 $81,009
Total Expenditures $19,723,103 $5,692,575
Open Enrollment Revenue $4,690,021
Net Revenue/(Loss) ($1,002,554)
Source: CLSD and ODE
1 This includes $175,796 in certificated salaries and wages miscoded to the Operation and Maintenance of Plant
Services function code.
2 Open enrollment special education students account for approximately 21.2 percent of total special education
students. This percent was applied to the Special Instruction expenditures, except for Disadvantaged Youth which was multiplied by the percent of open enrollment students.
3
Open enrollment cost is based on the District’s net cost of $215,029 for extracurricular activities multiplied by the percent of open enrollment students.
As shown in Table 6, CLSD’s net loss for educating open enrollment students was approximately $1.0 million in FY 2014-15.
Page | 18
Optimized Open Enrollment
If CLSD were to revise its current open enrollment policy, it could still offer open enrollment by using those students to round out classes. This could allow the District to increase its revenue without adding additional staff. To demonstrate this concept, two approaches were developed including:
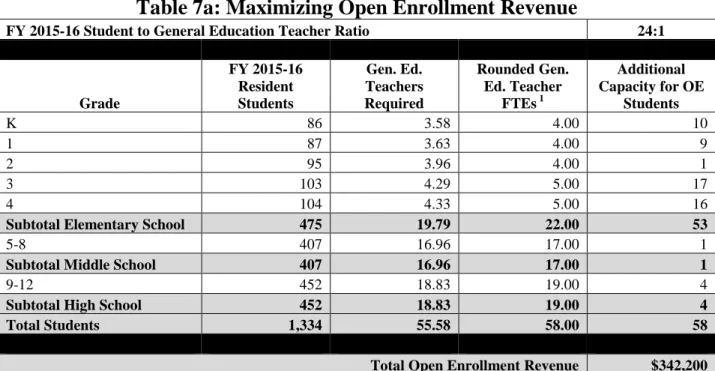
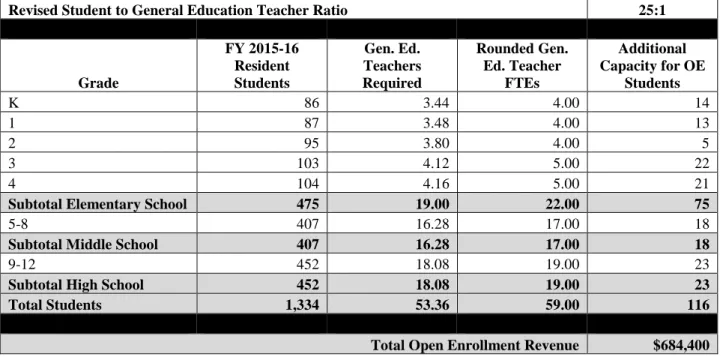
• Table 7a shows how the District could maximize revenue from open enrollment while maintaining the FY 2015-16 total students to general education teacher ratio of 24:1.6 • Table 7b shows how the District could maximize revenue from open enrollment by
increasing the total students to general education teacher ratio to 25:1.
Table 7a: Maximizing Open Enrollment Revenue
FY 2015-16 Student to General Education Teacher Ratio 24:1
Grade FY 2015-16 Resident Students Gen. Ed. Teachers Required Rounded Gen. Ed. Teacher FTEs 1 Additional Capacity for OE Students K 86 3.58 4.00 10 1 87 3.63 4.00 9 2 95 3.96 4.00 1 3 103 4.29 5.00 17 4 104 4.33 5.00 16
Subtotal Elementary School 475 19.79 22.00 53
5-8 407 16.96 17.00 1
Subtotal Middle School 407 16.96 17.00 1
9-12 452 18.83 19.00 4
Subtotal High School 452 18.83 19.00 4
Total Students 1,334 55.58 58.00 58
Total Open Enrollment Revenue $342,200
Source: CLSD and ODE
1 According to the EMIS Reporting Manual (ODE, 2015), a full time equivalent (FTE) is defined as the ratio
between the amount of time normally required to perform a part-time assignment and the time normally required to perform the same assignment full-time. One (1.0) FTE is equal to the number of hours in a regular working day for that position, as defined by the district.
As shown in Table 7a, the District could admit 58 open enrollment students, based on FY 2015-16 resident student enrollment, and still maintain its current student to general education teacher ratio. However, this option limits the revenue the District could receive from open enrollment.
6
This is based on 89.0 FTE general education teachers and excludes the 2.0 FTE general education teachers at the elementary school dedicated to technology education.
Page | 19
Table 7b: Maximizing Open Enrollment Revenue
Revised Student to General Education Teacher Ratio 25:1
Grade FY 2015-16 Resident Students Gen. Ed. Teachers Required Rounded Gen. Ed. Teacher FTEs Additional Capacity for OE Students K 86 3.44 4.00 14 1 87 3.48 4.00 13 2 95 3.80 4.00 5 3 103 4.12 5.00 22 4 104 4.16 5.00 21
Subtotal Elementary School 475 19.00 22.00 75
5-8 407 16.28 17.00 18
Subtotal Middle School 407 16.28 17.00 18
9-12 452 18.08 19.00 23
Subtotal High School 452 18.08 19.00 23
Total Students 1,334 53.36 59.00 116
Total Open Enrollment Revenue $684,400
Source: CLSD and ODE
As shown in Table 7b, the District could admit 116 open enrollment students if it increased its total student to general education teacher ratio from 24:1 to 25:1.
Ultimately, the number of open enrollment students the District can admit with the goal of maximizing financial efficiency will vary based on resident student enrollment and the desired student to teacher ratio. It is important to note, however, that the District would experience a slight increase in supplies and materials expenditures and water and sewer utilities due to the additional students.
Table 8 shows the net savings to the District if it optimized open enrollment based on the scenario shown in Table 7b.
Table 8: Potential Net Savings from Open Enrollment Optimization
Savings from Eliminating Excess Cost of Open Enrollment $1,002,554
Additional Revenue from Optimizing Open Enrollment (116 students) $684,400
Reduction of Transportation Revenue from Optimizing Open Enrollment 7 ($94,821)
Increase in Supplies and Materials Expenditures ($9,654)
Increase in Water and Sewer Utilities ($438)
Net Savings $1,582,041
Source: CLSD and ODE
As shown in Table 8, reducing open enrollment to a level that maximizes staff resources could reduce the District’s expenditures by almost $1.6 million annually. The additional funds could be
7
Reducing the number of open enrollment students would decrease the District’s transportation funding by $462.54 per student no longer transported.
Page | 20 used to reduce debt payments, offset the reduction in State revenue to pay back State Solvency Assistance funds, and/or educate students.
Reducing total expenditures would impact the maintenance of effort (MOE) calculations completed by ODE for IDEA Part B8 and Title I9 federal funds. However, ODE calculates MOE based on total expenditures and expenditures-per-pupil and then selects the MOE with the most favorable outcome for the District. Reduced student enrollment is an exemption to the MOE requirements for IDEA-B, which means reducing expenditures and enrollment associated with open enrollment are not likely to impact MOE and the District’s future funding. The amount of Title funds a district receives are based on the district’s census data, except for Title II-A which is based on enrollment. Although Title II-A funding may decrease, it would not be significant to District operations as it would only reduce a portion of the total Title II-A funding, which in FY 2014-15 was $65,400. The District’s total Title I funding was approximately $447,900 in FY 2014-15. Further, the District may request a waiver of MOE requirements due to a decline in financial resources. As such, reducing the District’s open enrollment population and associated expenditures will have an immaterial impact on its federal funding.
Financial Implication: The District could save approximately $1,582,041 annually by optimizing the number of open enrollment students it accepts.
R.3 Develop a multi-year capital improvement plan
The District does not have a capital plan. However, voters passed an approximately $28.3 million bond issue in May 2013 which generates permanent improvement funds estimated by the Treasurer to equal approximately $300,000 per year. The poor condition of the District's school buildings prompted it to pursue the bond issue to fund construction of a new high school and renovations to existing school buildings, which are scheduled for completion before the 2016-17 school year.
According to Multi-Year Capital Planning: Best Practice (GFOA, 2006), public entities that are allocated capital outlay or permanent improvement funding should prepare and adopt multi-year capital plans. A properly prepared capital plan is essential to the future financial health of an organization and its continued delivery to its constituents and stakeholders. An adequate capital plan should:
• Identify and prioritize expected needs based on the entity’s strategic plan; • Establish project scopes and costs;
• Detail estimated amounts of funding from various sources; and • Project future operating and maintenance costs.
The District should create a multi-year capital plan for all of its capital assets. Doing so would ensure that capital assets and permanent improvement funds are effectively managed.
8 Part B of the Individuals with Disabilities Education Act (IDEA Part B) governs how states and public agencies
provide special education and related services for children and youth ages 3-21.
9
Funds made available under Title I, Part A of the Elementary and Secondary Education Act of 1965 (ESEA) are used to provide services that are in addition to the regular services normally provided by a school district.
Page | 21
R.4 Consider eliminating General Fund subsidy of extracurricular activities
The District offers various extracurricular activities, including pay-to-participate athletics. In March 2016, the District increased its per sport pay-to-participate fee from $75 to $100 for high school and from $50 to $75 for middle school, effective FY 2016-17. According to ORC § 3315.062, a school district may use General Fund money to support student activities; however, such support shall not exceed five-tenths of one percent of the annual operating budget. While the District complied with this statute in FY 2014-15, the General Fund still subsidized extracurricular activities. Given the District’s deficit and fiscal emergency status, this practice is not sustainable.
Table 9 shows the net cost of extracurricular activities by activity type compared to the primary peers in FY 2014-15. Analyzing data by activity type is important because it identifies activities requiring the greatest level of General Fund subsidy, and can help the District make appropriate management decisions to reduce or eliminate the net cost of those activities.
Table 9: Extracurricular Net Cost Comparison
Activity Type CLSD Rev. CLSD Exp.
CLSD Net Cost
Peer Avg.
Net Cost 1 Difference
Percent Difference
Academic Oriented $160,584 $115,806 $44,778 ($151,921) $196,699 (129.5%)
Occupation Oriented $0 $534 ($534) $1,367 ($1,901) (139.1%)
Sport Oriented $91,529 $331,263 ($239,734) ($344,721) $104,987 (30.5%)
School and Public
Service Co-Curricular $0 $57,920 ($57,920) ($44,413) ($13,507) 30.4%
Bookstore Sales $4,587 $0 $4,587 $646 $3,941 610.1%
Other Extracurricular $4,441 $0 $4,441 $99,799 ($95,358) (95.6%)
Non-specified 2 $29,353 $0 $29,353 $28,408 $945 3.3%
Total $290,494 $505,523 ($215,029) ($410,835) $195,806 (47.7%)
Source: CLSD and primary peers
1 West Branch LSD was excluded from the peer average, as detailed financial information was not available. 2
This represents revenue that was not coded by activity type.
As shown is Table 9, the District's extracurricular activities net cost of approximately $215,000 was significantly less the peer average. Specifically, the District operated three activities (occupation oriented, sports oriented, and school and public service co-curricular) at a net cost. Sports oriented activities operated with the largest net cost of over $239,000. Although the District was below the peer average, its severe financial condition may warrant eliminating the General Fund subsidy of extracurricular activities.
In order to eliminate the General Fund subsidy, the District must increase revenue and/or decrease expenditures. This can be achieved by implementing one or more of the following:
• Increase pay to participate fees for sports; • Increase admissions and sales;
• Increase booster club funding;
• Reduce the supplemental salary schedule; and • Eliminate programs.
Page | 22 Making these changes would help eliminate the General Fund subsidy, allowing more resources to be dedicated to student instruction.
Financial Implication: Eliminating the General Fund subsidy of extracurricular activities could save the District approximately $215,000 per year, based on FY 2014-15 data.
R.5 Reduce 19.0 FTE general education teacher positions
General education teachers instruct students in a regular classroom environment. OAC 3301-35-05 requires the district-wide ratio of general education teachers to students to be at least 1.0 FTE classroom teacher for every 25 regular students. This category excludes teaching staff in other areas such as gifted, special education, and educational service personnel (ESP).
Table 10 shows a general education staffing comparison based on the District’s FY 2015-16 students to teacher ratio. It is important to compare staffing to both the peer average and State minimum requirements to provide a full picture of staffing efficiency.
Table 10: General Education Teacher Staffing Comparison
General Education FTEs 91.0
Regular Student Population 1,791.2
Staffing Ratio (Students:Teachers) 19.7
Staffing Ratio by Option (Students: Teachers) Proposed Staffing for Each Option Difference Above/ (Below) Proposed Reduction for this Option Annual Savings
Option 1: Peer Average 21.1:1 85.1 (5.9) 5.5 $287,834
Option 2: 10% Above State Minimum 22.5:1 79.6 (11.4) 11.0 $590,553
Option 3: State Minimum 25.0:1 71.6 (19.4) 19.0 $1,080,729
Source: CLSD, ODE, and OAC
As shown in Table 10, the District's general education teacher staffing level is above the peer average and significantly above the State minimum requirement. The selection of one of the options presented in Table 10 is ultimately District management's responsibility based on the needs and desires of the stakeholders in its community. Staffing decisions must be balanced, however, with their fiduciary responsibility to adapt to the District’s financial realities and maintain a solvent operation. Prior to making any reductions, the District should review staffing in all areas to determine appropriate service levels based on programmatic needs and responsibilities. The option to reduce general education staffing to State minimums is not a common practice in Ohio, but may be necessary to maintain financial solvency based on the deficit projections in the October 2015 five-year forecast and fiscal emergency status.
Financial Implication: Reducing 19.0 FTE general education teachers could save approximately
full-Page | 23 time general education teacher salaries and an average benefits ratio of 41.9 percent.10 The estimated savings could increase if the reduction occurs through retirement or voluntary separation of higher-salaried staff.
R.6 Reduce 3.0 FTE ESP teacher positions
ESP teacher positions include K-8 art, music, and physical education teachers. In FY 2015-16, the District employed 9.0 FTE ESP teachers, which included 1.0 FTE art teacher, 4.3 FTE music teachers, and 3.7 FTE physical education teachers. Effective April 24, 2015, OAC 3301-35-05 was revised to state, "The local board of education shall be responsible for the scope and type of educational services in the district. The district shall employ educational service personnel to enhance the learning opportunities for all students." This revision eliminated State minimum staffing levels for ESP staffing.
Table 11 shows the District's ESP staffing on a per 1,000 students basis as compared to the peer average for FY 2015-16. Comparing ESP staffing in relation to student population normalizes the effect of district size between CLSD and the peers.
Table 11: ESP Teacher Staffing Comparison
CLSD
Primary
Peer Avg. Difference
Students Educated 1 2,053.6 1,992.2 61.4
Students Educated (thousands) 2.0536 1.9922 0.0614
FTEs FTEs per 1,000 Students Peer FTEs per 1,000 Students Difference per 1,000 Students Total FTEs Above/ (Below) 2 ESP Teachers 9.00 4.38 3.80 0.58 1.19
Source: CLSD, ODE, and primary peers
1 Reflects students receiving educational services from the District and excludes the percent of time students are
receiving educational services outside of the District.
2 Represents the number of FTEs that, when added or subtracted, would bring the District’s number of office/clerical
FTEs per 1,000 students in line with the peer average.
As shown in Table 11, the District employed more ESP teachers than the peer average, signifying that financial efficiency could be gained by bringing its operation more in-line with this staffing level. A reduction of 1.0 FTE ESP teacher could save the District approximately $61,300 annually. Given the District’s fiscal emergency status, reductions below the peer average could help it reduce the deficits in its five-year forecast. As a result, the District's K-8 art, music, and physical education FTEs were further analyzed on a per building basis. Table 12
shows this comparison, which serves to detail ESP teacher FTEs dedicated to instructing students at each District building.
10
Calculated using the FY 2014-15 personal services expenditures divided by the employee's retirement/insurance benefits expenditures from the October 2015 five-year forecast.
Page | 24
Table 12: ESP Teacher per Building Staffing Comparison
Turkeyfoot Elementary /
4th Grade Academy Coventry Middle School
Students Educated 717.00 679.00 Students Educated (hundreds) 7.17 6.79 ESP Teachers ESP Teachers/100 Students ESP Teachers ESP Teachers/100 Students Difference Above/(Below) Art Education K-8 0.00 0.00 1.00 0.14 0.14 Music Education K-8 1.30 0.18 3.00 0.44 0.26 Physical Education K-8 1.70 0.24 2.00 0.29 0.06
Total ESP Teachers 3.00 0.42 6.00 0.88 0.46
Total Adjustment Needed to Equal Elementary ESP Teacher Staff per 100 Students 3.30
Proposed ESP Teacher Reduction 3.00
Annual Savings $203,058
Source: CLSD
As shown in Table 12, the District employs more ESP teachers at Coventry Middle School on a total FTE basis and per 100 students basis. The District would need to reduce 3.0 FTE ESP teachers from Coventry Middle School to reach the ESP teacher staffing level at the elementary level. The selected course of action by the District is ultimately management's responsibility based on the needs and desires of the stakeholders in its community and must be balanced with the fiduciary responsibility to adapt to financial realities and maintain a solvent operation.
Financial Implication: Reducing 3.0 FTE ESP teacher positions could save approximately
$203,000 in salaries and benefits annually. This was calculated using the lowest ESP staff salaries and an average benefits ratio of 41.9 percent.11 The estimated savings could increase if the reduction occurs through retirement or voluntary separation of higher-salaried staff.
11
Calculated using the FY 2014-15 personal services expenditures divided by the employee's retirement/insurance benefits expenditures from the October 2015 five-year forecast.
Page | 25
R.7 Reduce 2.0 FTE office/clerical positions
Office/clerical personnel are responsible for general office activities or building, department, and/or administrative secretarial duties. Table 13 shows the District’s FY 2015-16 office/clerical staffing compared to the primary peer average on a per 1,000 student basis. This analysis serves as a proxy workload measure for each FTE.
Table 13: District-Wide Office/Clerical Staffing Comparison
CLSD
Primary
Peer Avg. Difference
Students Educated 1 2,053.6 1,992.2 61.4
Students Educated (thousands) 2.0536 1.9922 0.0614
FTEs FTEs per 1,000 Students Peer FTEs per 1,000 Students Difference per 1,000 Students Total FTEs Above/ (Below) 2 Office/Clerical 14.09 6.86 5.85 1.01 2.07
Source: CLSD and ODE
1 Reflects students receiving educational services from the District and excludes the percent of time students are
receiving educational services outside of the District.
2 Represents the number of FTEs that, when added or subtracted, would bring the District’s number of office/clerical
FTEs per 1,000 students in line with the peer average.
As shown in Table 13, CLSD’s district-wide office/clerical staffing was above the primary peer average. In total, the District would need to reduce 2.07 FTEs to be comparable to the primary peer average. Additionally, analyzing the District’s office/clerical staffing levels on a per building basis identifies if building-level office/clerical staffing levels contribute to the higher district-wide office/clerical staffing levels. Table 14 shows this analysis, which serves as a proxy workload measure for each building-level FTE.
Table 14: Building-Level Office/Clerical Staffing Comparison
CLSD
Primary
Peer Avg. Difference
Buildings 3.0 4.3 1.3 FTEs FTEs per Building Peer FTEs per Building Difference per Building Total FTEs Above/ (Below) 1 Office/Clerical 7.00 2.33 1.47 0.86 2.58
Source: CLSD and ODE
1 Represents the number of FTEs that, when added or subtracted, would bring the District’s number of building-level
office/clerical FTEs per building in line with the peer average.
As shown in Table 14, CLSD was staffed higher compared to the primary peer average. To achieve a staffing ratio consistent with the peers, the District would need to reduce 2.58 FTE building-level office/clerical positions. While the primary peers have more buildings than CLSD, the District’s financial condition necessitates operating more efficiently.
Page | 26 The office/clerical analyses completed in Table 13 and Table 14 both show the District has an opportunity to reduce 2.0 FTE office/clerical positions. Whether the reductions occur from district-wide positions, building-level positions, or some combination thereof, is ultimately up to the District. Reducing 2.0 FTE office/clerical positions would streamline the District’s operations and allow more resources to be dedicated to student instruction.
Financial Implication: Reducing 2.0 office/clerical FTEs would save approximately $77,800 in salaries and benefits annually. This was calculated using the lowest office/clerical staff salaries and an average benefits ratio of 41.9 percent.12 The estimated savings could increase if the reduction occurs through retirement or voluntary separation of higher-salaried staff.
R.8 Renegotiate collective bargaining agreement provisions
The District has negotiated collective bargaining agreements (CBAs) with the Coventry Education Association (certificated CBA) and the Ohio Association of Public School Employees (OAPSE) Local 131 (classified CBA). The District’s certificated CBA expires July 31, 2016 and its classified CBA expired June 30, 2013; since that time the District has been operating under a continuation of the expired agreement. An analysis of these CBAs identified certain provisions that exceeded State minimum standards and/or typical provisions in Ohio school districts. The following provisions exceeded the local peer district average or ORC minimum requirements:
• Holidays: The District's classified CBA offers nine paid holidays to 12-month employees and eight paid holidays to employees who work less than 12 months. Although these levels were below the surrounding district average of 12 paid holidays for 11 and 12-month employees and consistent with eight paid holidays for nine and 10-12-month employees, ORC § 3319.087 states 11 and 12-month employees are entitled to a minimum of seven paid holidays, while nine and 10-month employees are entitled to six paid holidays. Direct savings from reducing the number of holidays could not be quantified; however, a reduction would increase the number of available work hours at no additional cost to the District.
• Vacation: The District's classified CBA provides employees with annual vacation accrual whereby they earn 565 vacation days over the course of a 30-year career. This exceeded the surrounding district average of 520 days and the ORC § 3319.084 minimum of 460 days. Providing employees with more vacation days could increase substitute and overtime costs. Direct savings from reducing the vacation schedule could not be quantified; however, a reduction would increase the number of available work hours at no additional cost to the District.
• Severance Leave Accrual and Payout: Both of the District’s CBAs allow employees to accrue 300 days of unused sick leave. Norton CSD allows for a maximum accrual of 250 days, Green LSD 310 days, and Copley-Fairlawn CSD is unlimited. Further, ORC § 3319.141 details sick leave accumulation and specifies that unused sick leave shall be cumulative to 120 days. Providing an accrual in excess of State minimum levels
12
Calculated using the FY 2014-15 personal services expenditures divided by the employee's retirement/insurance benefits expenditures from the October 2015 five-year forecast.
Page | 27 represents the potential for increased financial liability when sick leave is paid out to retiring employees. Additionally, the District's CBAs allow certificated and classified employees to be paid for accumulated sick leave upon retirement. Specifically, the certificated CBA allows for payment of 75 days. The classified CBA allows for payment of 90 days. In comparison, the surrounding districts average maximum sick leave payout is 54 days for certificated employees and 57 days for classified employees. The District's sick leave payout is also higher than required by ORC § 124.39, which allows school employees to be paid for 30 days (25 percent of 120 days) of unused sick leave at retirement. Allowing employees to receive payout in excess of State minimums becomes costly at employee retirement.
Table 15 shows the District’s historical severance payout data compared to what it would have paid its certificated and classified employees had it been aligned with the peer average caps of 54 and 57 days, respectively.
Table 15: Severance Payout Potential Impact
FY 2012-13 FY 2013-14 FY 2014-15 Total
CLSD Severance Payout $86,415 $55,219 $14,579 $156,213
Payout Based on Peer Average $70,983 $50,746 $6,914 $128,643
Difference $15,432 $4,473 $7,665 $27,570
Average Severance Payout Savings at Peer Average $9,190
Payout Based on ORC Minimum $44,914 $36,924 $13,126 $94,964
Difference $41,501 $18,295 $1,453 $61,249
Average Severance Payout Savings at ORC Minimum $20,416
Source: CLSD, SERB, local peers, and ORC
As shown in Table 15, the District could have saved an average of $9,190 annually if severance payouts were aligned with the peer average and an average of $20,416 annually if severance payouts were aligned with the ORC minimum.
Provisions within CBAs that provide benefits beyond what is required, or typically offered in other school districts, can create an unnecessary financial burden on the District and limit management’s ability to control costs. Any progress made through negotiations that would make contract provisions more cost effective would be beneficial to the District’s financial position.
The District’s CBAs have already expired, or will expire within the forecast period. As such, pursuing renegotiation of these changes for existing employees would have a direct impact on the forecasted financial condition. However, if the District determines that an immediate reduction in these benefits is impractical to implement, modifying these provisions for new hires may be more feasible.
Page | 28
R.9 Reduce health insurance costs
The District procures its medical, dental, and vision insurance through the Stark County Schools Council of Government (COG), which provides its members with greater insurance purchasing power by pooling their resources together to create one group under the same insurance plan. In January 2016, the COG had 94 members which included schools, libraries, educational service centers (ESCs), and other various public entities. This spreads the insurance risk out across its members rather than to a single district. The COG offers one medical, dental, and vision plan to its members and requires members to only offer COG dental and vision insurance.
CLSD was self-insured prior to joining the COG in April of 2012. The COG agreed to defer five monthly insurance premium payments starting in April 2012 through January 2013, which totaled approximately $1.3 million. Subsequently, the District deferred four additional monthly insurance premiums payments in FY 2013-14.
According to the COG’s bylaws, members can receive premium holidays once they are vested in the plan. A premium holiday is a provision that permits the cessation of one month of insurance premiums, effectively reducing the employee and employers cost of insurance by 1/12th or 8.3 percent per holiday offered. In order to become vested, an entity needs to either have 30 percent equity in the plan or be a part of the plan for at least five years, whichever comes first; and not have any outstanding debt to the plan. Premium holidays are awarded based on the amount of available equity from the previous year’s pooled premiums. CLSD has not been eligible for premium holidays due to its debt to the COG, which was certified on March 4, 2016 as more than $2.8 million. Once CLSD pays off the loan, it will qualify for premium holidays.
The District offers one insurance plan to employees with varying employee contributions depending on the employee’s classification.13 The District’s insurance plan costs and employee contributions were compared to the raw data collected by SERB in creating the 23rd Annual Report on the Cost of Health Insurance in Ohio’s Public Sector (SERB, 2015). To create this report, SERB surveys public sector entities on various aspects of health insurance benefits.
Medical Insurance
Table 16 shows CLSD’s employer share of the medical premiums, by position type and by single and family coverage, as compared to the average for all reporting entities within Summit County, derived from 2015 SERB data. This comparison is important because insurance costs are recognized as sensitive to local conditions and, where possible, other local or regional plans provide the most realistic benchmarks for relative price competitiveness.