AutomotivePolicy Research Centre
Automotive Manufacturing
Industry Profile 2014
Brendan A. Sweeney,
Ph.D.
10/22/2014
Intr
oduction
Economic Contr
ib
utions
Introduction
Every year, the APRC publishes a profile of the Canadian automotive manufacturing industry. These annual reports present key metrics, including contributions to GDP, employment, sales, trade, and a geographic profile of the industry. This particular report provides evidence of a sustained improvement in production and employment since 2009. The report also illustrates the extent to which automotive manufacturing is important to the Canadian economy, and particularly to communities in southern Ontario. However, it emphasizes some concerning trends, including a growing trade deficit in automotive parts, widespread plant closures, and production and employment levels that are much lower than those in the decade between 1997 and 2007.
Economic Contributions
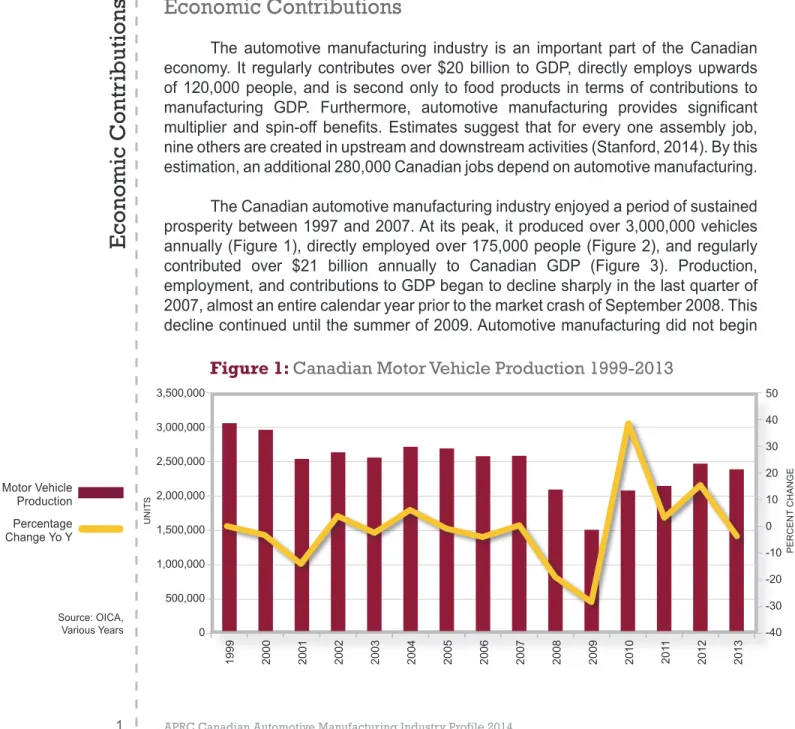
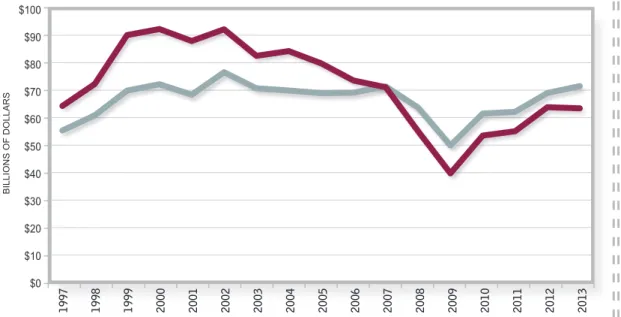
The automotive manufacturing industry is an important part of the Canadian economy. It regularly contributes over $20 billion to GDP, directly employs upwards of 120,000 people, and is second only to food products in terms of contributions to manufacturing GDP. Furthermore, automotive manufacturing provides significant multiplier and spin-off benefits. Estimates suggest that for every one assembly job, nine others are created in upstream and downstream activities (Stanford, 2014). By this estimation, an additional 280,000 Canadian jobs depend on automotive manufacturing. The Canadian automotive manufacturing industry enjoyed a period of sustained prosperity between 1997 and 2007. At its peak, it produced over 3,000,000 vehicles annually (Figure 1), directly employed over 175,000 people (Figure 2), and regularly contributed over $21 billion annually to Canadian GDP (Figure 3). Production, employment, and contributions to GDP began to decline sharply in the last quarter of 2007, almost an entire calendar year prior to the market crash of September 2008. This decline continued until the summer of 2009. Automotive manufacturing did not begin
Figure 1:
Canadian Motor Vehicle Production 1999-2013
3,500,000 3,000,000 2,500,000 2,000,000 1,500,000 1,000,000 500,000 0 1999 2000 2001 2002 2003 2004 2005 2006 2007 2008 2009 2010 201 1 2012 2013 50 40 30 20 10 0 -10 -20 -30 -40 Motor Vehicle Production Percentage Change Yo Y Source: OICA, Various Years BILLIONS OF DOLLARS UNITS PERCENT CHANGE
to recover in any significant fashion until late in 2009. Although this recovery has been sustained, employment and contributions to GDP in recent years are far lower than they were less than a decade ago.
The partial recovery of the automotive manufacturing industry that began in the second half of 2009 and continued until 2012 was led largely by assemblers. Toyota’s Woodstock, Ontario assembly facility, which began production late in 2008, played a significant role in the increases in employment and production that occurred between 2009 and 2012. The improvement of the automotive parts manufacturing sector lagged behind that of the assembly sector, and was not fully evident until early in 2012. Since this time, total annual contributions to GDP by assemblers and parts-makers have stabilized at around $16 billion and production at around 2.4 million units annually.
Figure 3:
Automotive Manufacturing GDP, Jan 1997 – Jun 2014
APRC Canadian Automotive Manufacturing Industry Profile 2014 2
200,000 180,000 160,000 140,000 120,000 100,000 80,000 60,000 40,000 20,000 0
Jan-01 Sep-01 May-02 Jan-03 Sep-03 May-04 Jan-05 Sep-05 May-06 Jan-07 Sep-07 May-08 Jan-09 Sep-09 May-10 Jan-1
1
Sep-1
1
May-12 Jan-13 Sep-13 May-14
$25 $20 $15 $10 $5 $0
Feb-97 Nov-97 Aug-98 May-99 Feb-00 Nov-00 Aug-01 May-02 Feb-03 Nov-03 Aug-04 May-05 Feb-06 Nov-06 Aug-07 May-08 Feb-09 Nov-09 Aug-10 May-1
1
Feb-12 Nov-12 Aug-13 May-14
Figure 2:
Automotive Industry Employment in Canada,
Jan 2001- Jun 2014
Source: Statistics Canada, 2014; CANSIM Table 281-0023
Motor Vehicle Manufacturing Body and Trailer Manufacturing Motor Vehicle Parts Manufacturing Total Motor Vehicle Manufacturing Body and Trailer Manufacturing Motor Vehicle Parts Manufacturing Total
Source: Statistics Canada, 2014; CANSIM Table 379-0031
BILLIONS
OF
The recovery of the automotive parts manufacturing industry varies considerably across diverse sub-sectors. Without question, every automotive parts manufacturing sub-sector contracted during the recent economic crisis. This economic contraction meant that in 2009, Ontario’s major automotive parts sub-sectors contributed between 38 and 60 per cent of the GDP that they had contributed in 2004 (Table 1). Several auto parts sub-sectors have recovered appreciably since, in particular metal stamping, steering and suspension components, and other motor vehicle parts. Moreover, the electrical and electronic equipment sub-sector, which in 2009 contributed only 38 per cent of the GDP that it did in 2004, has witnessed an incredible recovery (in terms of contribution to GDP) since 2010, and in 2013 contributed 129 per cent of the GDP that it did in 2004. This may be indicative of fundamental changes to automotive electronics manufacturing in Canada, a subject being explored in detail by APRC researchers.
At the same time, several sub-sectors have not experienced any significant recovery. These include seating and interior components, transmission and powertrain components, and engines and engine parts. Lower rates of recovery have much to do with the closure of production facilities that serviced recently closed assembly plants in St. Thomas and Oshawa and the closure of GM’s Windsor Transmission plant in July 2010. Wheels and brake systems manufacturing also fared particularly poorly, and in 2013 contributed only one-third of the GDP that it did in 2004. It is the only sub-sector to contribute less to GDP in 2013 than it did in 2009.
The recovery in production and contribution to GDP has outpaced the recovery in employment in automotive assembly and most (but not all) automotive parts sub-sectors. As of July 2014, over 40,000 people were employed in automotive assembly and over 83,000 in automotive parts manufacturing. In general, employment in automotive assembly has declined slowly since the late 2000, all the while interspersed
Employment
in automotive
assembly has
declined slowly
since the late
2000, all the while
interspersed with
sharper drops
that occurred as a
result of assembly
plant closures.
2004 2009 % of 2013 % of 2004 2004 Engines and $1,902,600,000 $1,146,900,000 60% $1,361,400,00 72% Engine Parts Electrical and Electronic $299,200,000 $115,100,000 38% $385,400,000 129% Steering and $447,000,000 $264,200,000 59% $432,700,000 97% Suspension Wheels and $402,200,000 $185,700,000 46% $131,300,000 33% Brake Systems Transmission $1,135,900,000 $445,400,000 39% $761,100,000 67% and Powertrain Seating $1,384,100,000 $681,800,000 49% $857,500,000 62% and Interior Metal Stamping $1,557,500,000 $797,900,000 51% $1,405,800,000 90% Other $1,734,500,000 $896,500,000 52% $1,651,100,000 95%Table 1:
Annual Contributions to Ontario GDP
by Select Sub-Sector: 2004, 2009, and 2013
$300,000 $250,000 $200,000 $150,000 $100,000 $50,000 $0 Source: Statistics Canada, 2014; CANSIM Table 379-0030.
with sharper drops that occurred as a result of assembly plant closures. Employment in every automotive parts manufacturing sub-sector in Ontario decreased between 2004 and 2012 (Table 2; note: 2013 data is not yet available). When compared to 2004, seating and interior components, engines and engine parts, and transmission and powertrain components retained the highest proportion of employees. Wheels and brake systems manufacturing and electrical and electronic equipment retained the least.
On average, those employed in Canada’s automotive assembly and parts manufacturing facilities are very productive (Figure 4). The average annual GDP produced per employee in automotive assembly facilities consistently exceeds
4 2004 2009 % of 2012 % of 2004 2004 Engines and 9156 6708 73% 7521 82% Engine Parts Electrical and Electronic 6074 2354 39% 2154 35% Steering and 3730 2543 68% 2479 66% Suspension Wheels and 5638 1911 34% 1604 28% Brake Systems Transmission 9690 5565 57% 7630 79% and Powertrain Seating 13718 8640 63% 11683 85% and Interior Metal Stamping 17846 7917 44% 13454 75% Other 18837 9716 52% 11619 62%
Table 2:
Employment in Select Automotive Parts Sub-Sectors in
Ontario: 2004, 2009, and 2012
Jan-01 Jul-01 Jan-02 Jul-02 Jan-03 Jul-03 Jan-04 Jul-04 Jan-05 Jul-05 Jan-06 Jul-06 Jan-07 Jul-07 Jan-08 Jul-08 Jan-09 Jul-09 Jan-10 Jul-10 Jan-1
1
Jul-1
1
Jan-12 Jul-12 Jan-13 Jul-13 Jan-14
$300,000 $250,000 $200,000 $150,000 $100,000 $50,000 $0
Figure 4:
Annual GDP/Employee, Automotive Assembly and Parts
Manufacturing, Jan 2001 – Jun 2014
Source: Statistics Canada, 2014; CAN-SIM Table 301-0006 Assembly Parts Source: Statistics Canada, 2014; CANSIM Tables 379-0031, 281-0023
$200,000. This is extremely high, even when compared to other capital intensive manufacturing industries such as primary metals, aerospace, chemicals, and pulp and paper (see Sweeney, 2013). The increasingly high rates of average annual GDP produced per employee are attributable to the productivity and skills of Canadian automotive workers and increased rates of capital intensity.
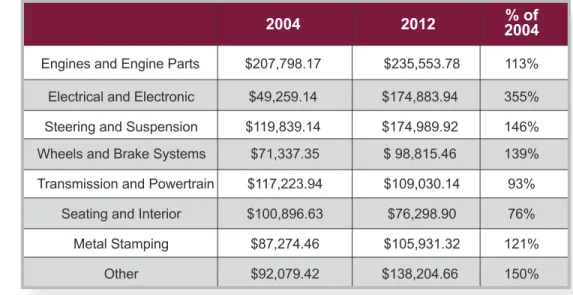
Average annual GDP produced per employee in automotive parts manufacturing is not quite as high, but has increased by almost 50 per cent, from just over $80,000 in 2001 to almost $115,000 in 2012. GDP produced per employee varies considerably
across different automotive parts sub-sectors in Ontario (Table 3). This reflects the
diversity amongst sub-sectors within this sector, especially between those that remain labour intensive versus those that are more capital intensive. In all but two sub-sectors, average annual GDP per employee increased. The largest increase was in electrical and electronic equipment – one of the sub-sectors that saw the greatest decrease in employment – where average annual GDP per employee increased by over 350 per cent. We suspect that this is due to a shift from low- to high-value added electrical and electronic equipment manufacturing, and possibly a fundamental restructuring of the electrical and electronic automotive parts industry. Steering and suspension components, wheels and brake system manufacturing, and other motor vehicle
parts also witnessed significant increases in average annual GDP per employee.
However, and interestingly, both the transmission and powertrain components and seating and interior components sub-sectors have experienced reductions in annual GDP per employee over the past decade. This raises questions regarding the relative competitiveness of these sub-sectors in an increasingly competitive environment.
The wages paid to automotive manufacturing employees are relatively high,
and affirm the notion that automotive manufacturing jobs are ‘good’ jobs. In 2013, the
average weekly earnings of automotive assembly employees were $1,386.49 (Figure 5). This is $400 more than the average weekly earnings of all manufacturing employees
2004 2012 % of
2004
Engines and Engine Parts $207,798.17 $235,553.78 113%
Electrical and Electronic $49,259.14 $174,883.94 355% Steering and Suspension $119,839.14 $174,989.92 146%
Wheels and Brake Systems $71,337.35 $ 98,815.46 139%
Transmission and Powertrain $117,223.94 $109,030.14 93%
Seating and Interior $100,896.63 $76,298.90 76%
Metal Stamping $87,274.46 $105,931.32 121%
Other $92,079.42 $138,204.66 150%
Table 3:
Annual GDP/Employee in Select Ontario Automotive
Parts Sub-Sectors, 2004 and 2012
Source: Statistics Canada, 2014; CANSIM Table 301-0006; 379-0030
The downward
pressure on
automotive parts
manufacturing
wages has
much to do with
the closure of
dozens of large
unionized parts
manufacturing
plants in the past
decade.
APRC Canadian Automotive Manufacturing Industry Profile 2014 6
and almost $500 more than the average of all Canadian workers. The average weekly earnings of automotive parts manufacturing employees were $1,011.62. This is nominally lower than the average weekly earnings of all manufacturing employees and over $100 higher than the average of all Canadian employees. However, the average weekly wages of automotive assembly and parts manufacturing employees have increased much more slowly than those in other sectors. Between 2001 and 2013 the average weekly wages of all Canadian employees increased by 38.7 per cent and the average weekly wages for manufacturing employees increased by 27.5 per cent (Table 4). In contrast, the average weekly wages of automotive assembly employees increased by only 14.5 per cent and those of automotive parts manufacturing employees increased by only 6.7 per cent. The downward pressure on automotive parts manufacturing wages has much to do with the closure of dozens of large unionized parts manufacturing plants in the past decade.
$1,600 $1,400 $1,200 $1,000 $800 $600 $400 $200 $0 2001 2002 2003 2004 2005 2006 2007 2008 2009 2010 201 1 2012 2013
Figure 5:
Average Weekly Wages, 2001-2013
2001 2013 % Increase Automotive $1,210.65 $1,386.49 15% Assembly Automotive Parts $947.97 $1,011.62 7% Manufacturing Manufacturing $799.33 $1,019.80 28% Average Canadian $656.59 $910.74 39% Average
Table 4:
Average Weekly Wages, 2001 and 2013
Assembly Parts Manufacturing Manufacturing Average Canadian Average Source: Statistics Canada, 2014; CANSIM Table 281-0027
Source: Statistics Canada, 2014; CANSIM Table 281-0027
BILLIONS OF DOLLARS BILLIONS OF DOLLARS
Trade
For much of the period following the negotiation of the Autopact, Canada held a positive balance of trade in automotive products, with exports to the rest of the world exceeding imports. This positive balance of trade reached over $20 billion in 1999. Canada’s historic positive balance of trade was due to a significant surplus in exports of assembled vehicles (primarily to the US).
Although the value of the surplus has shrunk over the years, Canada continues to maintain a positive balance of trade in assembled vehicles (Figure 6). The surplus in assembled vehicles long exceeded Canada’s deficit in automotive parts (Figure 7).
Tr
ade
1997 1998 1999 2000 2001 2002 2003 2004 2005 2006 2007 2008 2009 2010 2011 2012 2013 $70 $60 $50 $40 $30 $20 $10 $0Figure 6:
Imports and Exports (Assembled Vehicles), 1997-2013
$50 $45 $40 $35 $30 $25 $20 $15 $10 $5 $0 1997 1998 1999 2000 2001 2002 2003 2004 2005 2006 2007 2008 2009 2010 2011 2012 2013
Figure 7:
Imports and Exports (Automotive Parts), 1997-2013
Imports Exports Source: Statistics Canada, 2014; CANSIM Table 228-0059 Source: Statistics Canada, 2014; CANSIM Table 228-0059 Imports Exports
APRC Canadian Automotive Manufacturing Industry Profile 2014
However, the deficit in automotive parts began to exceed the surplus in assembled vehicles in 2007 (Figure 8). Canada has experienced an overall trade deficit in automotive products since 2007. This deficit reached over $10 billion in 2009, a sharp contrast to the $10 billion surplus experienced in 2005. In the three years following 2009, the trade deficit shrunk by almost half. However, it grew again in 2013, reaching over $8 billion.
There are several reasons why this is likely to have occurred. The production and export of assembled vehicles improved between 2009 and 2012 at the same time that vehicle imports continued to increase alongside increased demand for vehicles. Overall exports of assembled vehicles have grown more rapidly than imports. This trend persisted notwithstanding the growing popularity of pickup trucks that are no longer produced domestically since GM closed its Oshawa truck assembly plant in 2009. A bigger contributing factor to the trade deficit lies in the automotive parts sector. The closure of over 200 parts manufacturing facilities in the past decade has led to a significant increase in automotive parts imports and the relative stagnation in parts exports. The characteristics of automotive parts manufacturing plants closed in Canada are discussed in further detail below, providing a more in depth understanding of the trade deficit in automotive parts.
8
Figure 8:
Imports and Exports (Total Automotive), 1997-2013
$100 $90 $80 $70 $60 $50 $40 $30 $20 $10 $0 1997 1998 1999 2000 2001 2002 2003 2004 2005 2006 2007 2008 2009 2010 2011 2012 2013 Imports Exports Source: Statistics Canada, 2014; CANSIM Table 228-0059 BILLIONS OF DOLLARS
The closure of
over 200 parts
manufacturing
facilities in the
past decade has
led to a significant
increase in
automotive parts
imports and the
relative stagnation
in parts exports.
Sales
Sales
Canadian vehicle sales appear to have fully recovered from the economic crisis. In 2013, vehicle sales exceeded 1.3 million (Figure 9). Following record sales in August, there are expectations that sales will be even higher in 2014. This is due to a combination of pent-up demand, low interest rates, and strong dealer incentives (Keenan, 2014). Canadian consumers continue to show a preference for larger vehicles such as pickup trucks, minivans, and SUVs (Figure 10). The majority of these vehicles – and almost all pickup trucks – are made in North America. Canadians also purchased more vehicles made in North American and fewer made in Japan, Korea, or the EU. This is likely due to an increase in the number of models being produced by Japanese, German, and Korean manufacturers at their southern US and Mexican plants.
1,600 1,400 1,200 1,000 800 600 400 200 0 2007 2008 2009 2010 2011 2012 2013
Figure 9:
Canadian Vehicle Sales (Units), 2007-2013
900 800 700 600 500 400 300 200 100 0
Figure 10:
Canadian Vehicle Sales (Units) by Nation of Origin,
2007-2013
North American Trucks and SUVs
North American Cars Japanese Cars Other Cars Source: Statistics Canada, 2014: CANSIM Table 079-0003 Source: Statistics Canada, 2014: CANSIM Table 079-0003 THOUSANDS OF UNITS THOUSANDS OF UNITS
APRC Canadian Automotive Manufacturing Industry Profile 2014 11
Geogr
aph
y and Pr
oduction Location
Geography and Production Location
The APRC maintains a database of automotive parts supplier plants in Canada. This database includes a wide range of plants, from large well-capitalized engine and powertrain production facilities owned by vehicle assemblers to small privately-owned tool, die, and mould-making shops. As of October 2014, the database included information on 637 individual supplier plants across Canada. In addition to the name and street address of each plant, the database compiles information related to parent ownership, nationality of ownership, product category, and if available or applicable, the number of employees, year established, major customers, and union representation.
The vast majority of supplier plants (590) are located in Ontario (Figure 11). Most are located within a corridor stretching between Peterborough and the Greater London Area or in Windsor-Essex. There are also several plants in eastern Ontario, Bruce-Grey County, and Chatham-Kent. The remainder are located in Québec (34), British Columbia (8), Alberta (2), Manitoba (2), and Nova Scotia (1).
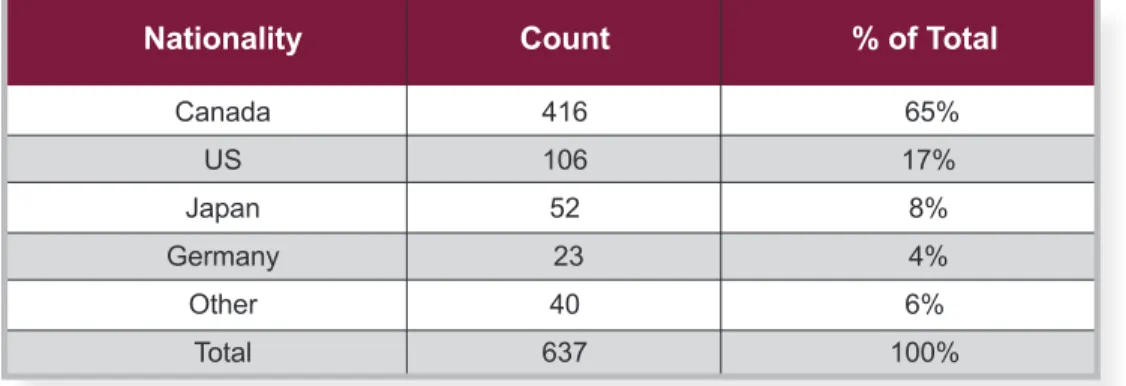
Canadian-owned firms operate 416 of the 637 supplier plants in Canada (Table 5). Of the remainder, 106 are US-owned, 52 are Japanese-owned, 23 are German-owned, and 40 are owned by firms based in 13 other nations. Chinese firms are playing an increasing role following the acquisitions of Wescast Industries by the Sichuan Bohong Group in 2012 and of Meridian Lightweight Technologies by the Wanfeng Auto Holding Group late in 2013.
Figure 11:
Automotive Parts Supplier Plants in Canada
Nationality Count % of Total
Canada 416 65% US 106 17% Japan 52 8% Germany 23 4% Other 40 6% Total 637 100%
Each supplier plant is assigned one of thirteen product categories (Table 6). The Tool, Die, and Mould category represents the largest number of supplier plants (91). However, a significant majority of these plants are quite small and employ fewer than 50 people. The Metal Stamping category represents the second highest number of plants (84). This category includes several very small and very large production facilities alike. These were followed by Motor Vehicle Plastic Parts (62), Seating and Interior Components (59), Transmission and Powertrain (51), Body and Chassis (48), and Engines and Engine Parts (35). Many of the plants in these categories are quite large and are owned by internationally-based firms or Canadian firms with an international reach.
The parent owners of Canadian supplier plants are diverse in size and scope (Table 7). Of the 637 supplier plants in Canada, slightly fewer than 25 per cent are owned by firms classified by the Automotive News as either Top 100 North American Suppliers or Top 100 Global Suppliers (Automotive News, 2012). Only 17 per cent of Canadian-owned supplier plants are operated by ‘Top 100’ firms. This is low when compared to US-owned supplier plants (of which 44 per cent, or 47 of 106, are owned by Top 100 firms), Japanese-owned supplier plants (40 per cent, or 21 of 52), German-owned supplier plants (35 per cent, or 8 of 23), and all other nations (35 per cent, or 14 of 40). The large number of supplier plants owned by small- and medium-sized Canadian firms also demonstrates how such enterprises continue to play an important role in the automotive industry supply chain in Canada, despite the increasing dominance of large international parts suppliers with a global reach in other automotive-producing nations that do not have domestic OEMs.
Sub-Category Count % of Total
Body and Chassis 48 8%
Electronic and Electrical Equipment 24 4%
Engines and Engine Parts 35 5%
Metal Stamping 84 13%
Motor Vehicle Plastic Parts 62 10%
Paint, Adhesives, and Coatings 22 3%
Seating and Interior 59 9%
Steering and Suspension 17 3%
Sub-Assembly 18 3%
Tool, Die, and Mould 91 14%
Transmission and Powertrain 51 8%
Wheels and Brake Systems 16 3%
Other 110 17%
Total 637 100%
Table 6:
Canadian Automotive Parts Supplier Plants
by Sub-Category
The large number
of supplier plants
owned by small-
and
medium-sized Canadian
firms also
demonstrates how
such enterprises
continue to play
an important role
in the automotive
industry supply
chain in Canada.
APRC Canadian Automotive Manufacturing Industry Profile 2014 13
In addition to a
database of supplier
plants operating
in Canada, the
APRC maintains a
database of supplier
plant closures since
the early 2000s.
Large suppliers with an international reach are more likely to be involved in someproduct categories than others (Table 8). Body and Chassis suppliers are the most likely to be owned by a ‘Top 100’ firm (73 per cent, or 35 of 48). However, this figure may be skewed somewhat when we consider the presence of Magna, an important body and chassis supplier and the parent owner of 21 such plants in Ontario (several of which are quite large). Seating and Interior Component suppliers are also very likely to be owned by a Top 100 firm (63 per cent, or 37 of 59). ‘Follow sourcing’ practices common to the industry, whereby large suppliers establish production facilities close to assembly plants, are most commonly found in this product category, hence the high proportion of plants owned by Top 100 firms. Some of these suppliers include Johnson Controls, Lear, Brose, Magna, Autoliv, Toyoda Gosei, Toyota Boshoku, and Autoneum. Other categories with a high proportion of supplier plants owned by Top 100 firms
Nationality Top 100 Total % Top 100
Canada 70 416 17% US 47 106 44% Japan 21 52 40% Germany 8 23 35% Other 14 40 35% Total 160 637 25%
Table 7:
Automotive Parts Supplier Plants Owned by
‘Top 100’ Firms, by Nationality
Category Top 100 Total % Top 100
Body and Chassis 35 48 73%
Electronic and Electrical Equipment 1 24 4%
Engines and Engine Parts 19 35 54%
Metal Stamping 7 84 8%
Motor Vehicle Plastic Parts 13 62 21%
Paint, Adhesives, and Coatings 3 22 14%
Seating and Interior 37 59 63%
Steering and Suspension 5 17 29%
Sub-Assembly 0 17 0%
Tool, Die, and Mould 3 91 3%
Transmission and Powertrain 23 51 45%
Wheels and Brake Systems 9 18 50%
Other 14 108 13%
Table 8:
Automotive Parts Supplier Plants Owned by ‘Top 100’
include Engines and Engine Parts (54 per cent, or 19 of 35), Wheels and Brake Systems (50 per cent, or 9 of 18), and Transmission and Powertrain Components (45 per cent, or 23 of 51). The supplier plants least likely to be owned by a Top 100 firm are Sub-Assembly (none), Tool, Die, and Mould (less than 3 per cent, or 3 of 91), and Electrical and Electronic Equipment (4 per cent, or 1 of 24).
In addition to a database of supplier plants operating in Canada, the APRC maintains a database of supplier plant closures since the early 2000s. Currently, this database includes information on 211 supplier plants closed between 2002 and 2014. Plant closure data was collected from several sources, including media reports, company reports and publications, auction notices, union publications, and government documents. Unfortunately, there are likely many smaller supplier plants that have closed during this time for which information is currently unavailable. This is particularly the case for smaller plants that closed during the early 2000s. However, the plant closure database has captured the vast majority of the most significant automotive supplier plant closures during this time.
The most striking feature of the supplier plants closed since 2002 is that a disproportionately high number were US-owned (Table 9). Of the 211 supplier plants closed in Canada during this time, over 42 per cent were US-owned (88 of 211). Of the remainder, 49 per cent were Canadian-owned (103), 2 per cent were Japanese-owned (4), 3 per cent were German-owned (7), and 4 per cent were owned by firms from other nations (9). Furthermore, the plants closed by US-owned firms were larger on average than those closed by Canadian-owned firms. In fact, of the 88 US-owned supplier plants closed in Canada since 2002, 55 per cent (48) were owned by Top 100 firms such as Dana, Honeywell, ITW, TI Automotive, Lear, Johnson Controls, Borg-Warner, Dura Automotive, Tower International, and PGW. Several other supplier plants closed during this time were also owned by large US-based firms that may have previously held a place as a Top 100 supplier but whose parent company had ceased operations entirely (e.g. Collins and Aikman, Oxford Automotive, Progressive Moulded Products).
A significant proportion of these US-owned plants were established during the 1960s and 1970s and produced lower value-added products in order to take advantages of relative advantages in Canadian labour costs and satisfy US requirements under the Auto Pact. Many were also unionized. This stands in sharp contrast to most of the Japanese-owned supplier plants, which were established in the 1990s or 2000s.
Nationality Count % of Closed
Canada 103 49% US 88 42% Japan 4 2% Germany 7 3% Other 9 4% Total 211 100%
Table 9:
Automotive Parts Plants Closures, 2002-2014, by Nationality
The most striking
feature of the
supplier plants
closed since
2002 is that a
disproportionately
high number were
US-owned.
APRC Canadian Automotive Manufacturing Industry Profile 2014 15
The plant closure
database also
identifies a
geographic shift
in the Canadian
automotive
manufacturing
industry. In general,
there has been a
shift away from
production in
peripheral regions
and regions without
assembly facilities.
Conclusion
However, many of the US-owned plants were antiquated and became uncompetitive following the end of the Auto Pact in 2001, the appreciation of the Canadian dollar, and declining production volumes between 2007 and 2009. Based on the APRC plant closure database, the average age of US-owned Top 100 suppliers at the time of closure was 43.2 years, and the average date that they were established was 1964.
The plant closure database also identifies a geographic shift in the Canadian automotive manufacturing industry. In general, there has been a shift away from production in peripheral regions and regions without assembly facilities. Several communities in near northern Ontario (e.g. Sudbury), the Muskokas (e.g. Bracebridge), and Grey County (e.g. Owen Sound) have lost nearly all of their supplier plants. The Southwestern Ontario communities of Chatham-Kent, Sarnia, and Wallaceburg also lost a large proportion of their supplier plants, despite their relative proximity to automotive clusters in the Windsor and London areas. At the same time, a disproportionate amount of supplier plants in the eastern GTA closed (including Durham Region and Scarborough), despite the presence of GM’s Oshawa Assembly complex, the northeasternmost automotive assembly plant in North America. Most of the plants that remain in the eastern GTA are owned by large US and Canadian firms (e.g. Lear, Johnson Controls, Martinrea, Inteva, Woodbridge Foam) that service the nearby GM plant almost exclusively. What the eastern GTA lacks are the diverse networks of second- and third-tier parts suppliers and mould-makers prevalent in other areas of Ontario where OEM assembly and powertrain production facilities are located (e.g. Windsor, western GTA, Kitchener-Waterloo and Cambridge). This may be a consequence of the closure of GM’s truck assembly plant in 2009 and recent uncertainty regarding the future of one of the two remaining car assembly plants.
Conclusion
The Canadian automotive manufacturing has partially recovered from the turmoil of the 2008-9 financial crisis. While it is unlikely that the industry will soon employ as many people or contribute as much to GDP as it did in the late 1990s and early 2000s, it appears to have stabilized to some degree. Recent hiring at Ford, Toyota, and Chrysler assembly plants and GM’s decision to delay the planned closure of the Oshawa Consolidated plant offer some optimism for the industry moving forward. However, the trade deficit, which after shrinking for three straight years grew in 2013 (and it is expected that it will grow again in 2014) is an issue that the APRC continues to examine, especially considering the strength of vehicle sales in recent years and the closures of parts supplier plants. Canada’s diminished share of North American production is also an ongoing cause for concern.
Ref
er
ences
References
Automotive News (2012) Top Suppliers: North America, Europe, and the World. Special Supplement to Automotive News, June 17, 2013.
Keenan, Greg (2014) Auto sales reach record on ‘flashing green’ indicators. The Globe and Mail, September 3, 2014.
OICA (1999-2013) Various Production Statistics. http://www.oica.net/category/ production-statistics/ Last accessed: October 16, 2014.
Stanford, Jim (2014) Canada’s Auto Industry and the New Free Trade Agreements: Sorting Through the Impacts. Canadian Centre for Policy Alternatives, April 2014.
Statistics Canada (2014) CANSIM Table 079-0003. New motor vehicle sales Canada, provinces and territories, monthly.
Statistics Canada (2014) CANSIM Table 228-0059. Merchandise imports and exports, customs and balance of payments basis for all countries, by seasonal adjustment and North American Product Classification System (NAPCS), monthly (dollars x 1,000,000). Unadjusted.
Statistics Canada (2014) CANSIM Table 281-0023. Employment (SEPH), unadjusted for seasonal variation, by type of employee for selected industries classified using the North American Industry Classification System (NAICS), monthly (persons).
Statistics Canada (2014) CANSIM Table 281-0027. Average weekly earnings (SEPH), by type of employee for selected industries classified using the North American Industry Classification System (NAICS), annual (current dollars).
Statistics Canada (2014) CANSIM Table 301-0006. Principal statistics for manufacturing industries, by North American Industry Classification System (NAICS), annual.
Statistics Canada (2014) CANSIM Table 379-0030. Gross domestic product (GDP) at basic prices, by North American Industry Classification System (NAICS), provinces and territories, annual (dollars). 2007 constant prices.
Statistics Canada (2014) CANSIM Table 379-0031. Gross domestic product (GDP) at basic prices, by North American Industry Classification System (NAICS), monthly (dollars). 2007 constant prices.