Computer Applications in Electrical Engineering
Estimation of the pseudorandom signal length
with the use of the FFT algorithm
Janusz Walczak, Rafał Stępień Silesian Uniyersity of Technology
44-100 Gliwice, ul. Akademicka 10, email: [email protected], rafal.stepien @polsl.pl
This paper describes effective estimation method for pseudorandom signal length with the use of FFT algorithm. Proposed method was used in order to calculate the length of sequence of DLFSR generators’ output. The construction of DLFSR generators is described in the following paper. As it is shown on the examples the application of proposed method was implemented on PC computer, which was equipped with a soundcard.
1. Introduction
The process of obtaining pseudorandom signals is very difficult from the practical point of view, but it is widely applied in technical science [1]. Pseudorandom signals (numbers) generators are used in various statistical algorithms [1]; they are necessary element of Monte Carlo method and they are also used in simulators. These generators however, are also applied in stream ciphers keys generators [2] and, in a part of spread spectrum modulators in telecommunication [3].
The basic application of the pseudorandom signals is shown on Figure 1.
Pseudorandom signals have many practical applications, therefore a different requirements are applied to the pseudorandom signal generators. In consequence of this set of statistical tests was developed [4], [5]. These tests analyze the pseudorandom sequence. During the research of the pseudorandom generator construction simple and effective method of generator’s output sequence quality is its length measurement. Due to this measurement, the generator’s structure can be modified or rejected.
2. Measurements methods of the pseudorandom signal length
During the research on the pseudorandom signal generators, it is desirable to estimate the generators’ sequence length using quick and easy method. In case of generator which has analytically proven sequence length, the fast length estimation method can verify easily if the generator is implemented correctly. This however, applies mainly to the congruental and Linear Feedback Shift Registers generators, which mathematical basis are well known [1], [6].
In order to lengthen pseudorandom signal sequence complex generator can be used [1], [7], [8]. Analytical estimation of a complex pseudorandom signal generator’s sequence is difficult and it depends on the structure of generator. Estimation of the sequence length can be carried out through one of the following methods:
1. specifying the generator’s analytical equations and calculating the maximum length of the output sequence,
2. using the CAD mathematical software to simulate the generator’s behavior (for example Matlab),
3. using of the CAD electronics simulation software to simulate the generator’s circuit (for example in MultiSim),
4. measuring physical generator’s structure.
Methods that use the simulation software are generally time consuming, especially when the generator’s sequence length is longer than 106 [9]. The physical structure researches are faster. The sequence length is estimated through the amplitude spectrum of the generator’s output signal [9]. This method was used by Authors as a fast pass/fail criteria for the DLFSR generators’ structures [13].
3. Generators with the dynamie linear feedback loop
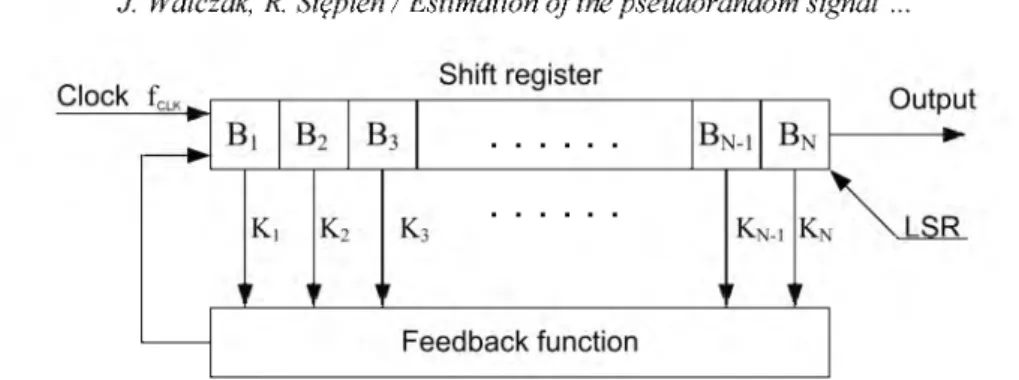
One of the basic pseudorandom signal generators are Linear Feedback Shift Register generators [1]. These generators are characterized by static in time feedback loop. This type of pseudorandom generator is well known and it is described in literature [1], [6], [10]. The general idea of the LFSR generator is shown in Figure 2.
J. Walczak, R. Stępień / Estimation o f the pseudorandom signal ...
Fig. 2. The Linear Feedback Shift Register generator
Selected register’s taps (Ki...Kn) are forwarded into the feedback function
block which is an multiple input XOR or NXOR gate. When the LFSR generator is turned on, the set of active taps does not change - the register is described by the one feedback polynomial. The generator’s sequence length is described by the formula (1).
l
= 2N -
1
(1)where: N- rank f the shift register, l- pseudorandom signal length.
Introducing an additional block that enables the change of feedback loop polynomial (the set of taps) while generator is turned on, leads to an DLFSR generator [11], [12]. The general idea of DLFSR generator is shown in Figure 3.
Fig. 3. The DLFSR generator
The selection of feedback loop polynomials and the moments of their switch depend on the generator’s construction. If the selection of feedback loop polynomials and of the switching criteria are proper, the length of the output sequence can be increased.
The construction of the DLFSR generator is complex therefore analytical estimation of the sequence length is difficult. As far as it is known the analytical method of DLFSR sequence length estimation were not presented.
4. The pseudorandom signal length measurement algorithm
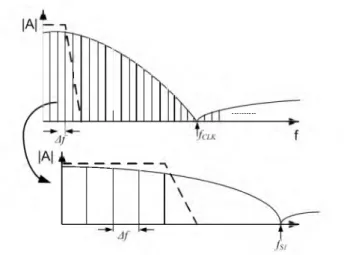
Figure 4 illustrates an exemplary amplitude spectrum of the pseudorandom sequence [3]. Amplitude spectrum of the limited sequence length is not continuous and consists of spectrum lines that are placed with A f interval. This interval is given by the formula (2) [3].
A f = ^ (2)
If the sequence length approaches infinity, the A f interval approaches zero. The pseudorandom sequence spectrum lines are limited by the sin(x)/x envelope.
|A|A
Fig. 4. Pseudorandom signal amplitude spectrum
In order to estimate the pseudorandom sequence length one should calculate the sequence amplitude spectrum. Next, basing on the amplitude spectrum, a A f
interval should be measured. The pseudorandom sequence length can be calculated with a formula (3).
where: fcLK- sequence clock, l- pseudorandom sequence length, A f -interval between the amplitude spectrum lines.
The FFT points are distributed uniformly (assuming uniform sampling). The distance between these points is given by the formula (4).
f = f =T m
where: AfFFT - the FFT resolution, f s - signal sampling frequency, P - number of time domain samples, T - signal measurement time.
J. Walczak, R. Stępień / Estimation o f the pseudorandom signal
The FFT resolution increases when the number of time domain samples P
increases or when the signal sampling frequency f s decreases (assuming that the Nyquist-Shannon sampling theorem is satisfied).
It is desirable to make the pseudorandom signal length measurement fast. Consequently it limits the P value. Additionally in order to measure the pseudorandom sequence length condition (5) must be satisfied. This condition applies that pseudorandom signal acquisition time must be at least two time longer then the pseudorandom signal period. If condition (5) is not satisfy, it is not possible in practice to measure the pseudorandom signal length.
Wfft < f = f f ^ T > 2l (5)
The value A f can be obtained from a part of the amplitude spectrum. This part contains few spectrum lines. This idea is shown in Figure 5.
Fig. 5. Use of a part of the amplitude spectrum
The pseudorandom signal spectrum can be limited with the circuit shown in Figure 6.
The correct information about the frequency interval A f is still present in the limited part of spectrum. In addition, the required sampling rate f S2 of the limited bandwidth signal can be much lower than the generator’s clock frequency f CLK. Due to pseudorandom signal sampling it is required to limit signal’s bandwidth with the antialiasing filter. The antialiasing cut-off frequency should be matched to the ADC sampling rate f s1.
Under described limitations an algorithm of the pseudorandom signal length measurement with use of the FFT algorithm can be specified.
1. The output of the pseudorandom signal generator should be connected to the circuit from figure 6.
2. FFT amplitude spectrum of the generator’s band limited signal should be obtained.
3. The frequency interval A f between two amplitude lines should be measured. 4. Calculate the sequence length using the formula (3).
Minimum time of the measurement is determined by the double period of the pseudorandom sequence. The A f value can be read only after measurement time. This method allows to decrease number of the FFT points, since the pseudorandom spectrum is reduced. Through this computation requirements can be reduced.
5. Soundcard application
The measurement of the pseudorandom signal length based on a soundcard is shown in Figure 7. The soundcard bandwidth is limited to approximately to 21kHz and the internal sigma-delta converter FIR filter has a sharp roll-off above 20kHz (for sampling rate eąuals to 44,1kHz).
Analog input of the soundcard
Fig. 7. Measurement setup with a soundcard
The FFT spectrum is determined through the software FFT algorithm. This algorithm is a part of the Soundcard Oscilloscope software [14]. Pseudorandom signal should be forwarded to the line-in input of the soundcard. In order not to overload the analog input voltage range the pseudorandom signal should be attenuated. If pseudorandom signal is connected to the sound card, the software [14] can estimate the FFT amplitude spectrum. An exemplary amplitude spectrum of the DLFSR generator, is shown in Figure 8.
J. Walczak, R. Stępień / Estimation o f the pseudorandom signal
»
* 25 0 5( 0 75 Frequency [H z ] 0 10 00 12 50 EEZ ZEFig. 8. A part of amplitude spectrum of the DLFSR generator
The marker shown in figure 8 is set around 412Hz. The FFT resolution if equal to 10,7Hz (sampling rate 44100Hz, 4096 points). The FFT resolution can affect the length measurement accuracy. This problem will be brought up in future Authors’ work. The DLFSR generator’s clock frequency is equal 27MHz. The formula (6) should be used to calculate the pseudorandom sequence length. The calculated sequence length for this case of amplitude spectrum is equal 65535.
l = f cclk
Af
(6)Obtained sequence length was verified by the simulation in Matlab environment. Sequence data (100000 samples) was generated by the software implementation of the DLFSR generator. The autocorrelation function of the software generated sequence is shown in Figure 9.
S a m p le A u to c o rre la tio n F u n c tio n (AC F)
2 3 4 5 6 7
Lag
9 10
x 104
The autocorrelation function has two maximum points for lag 0 and 65535. This proves that the pseudorandom sequence length estimation with a part of the amplitude spectrum is correct.
6. Conclusions
This paper provides a description of a method for pseudorandom signal length measurement. Proposed method do not require advanced laboratory equipment, but only ordinary PC computer with a soundcard and software. Described method, which is based on a physical measurements of the pseudorandom signal generator, allows faster estimation of the generator’s structure. By this method it is possible to test faster the pseudorandom generators, and especially DLFSR generators . The length measurement accuracy, resolution and time of measurement depend on the pseudorandom generators clock frequency.
References
[1] Kotulski Z.: Generatory liczb losowych: algorytmy, testowanie, zastosowania, Matematyka Stosowana 2, 2001, ss:1-7.
[2] Schneier B.: Kryptografia dla praktyków, Vol. 2, WNT, Warszawa 2002.
[3] Mutagi R.N.: Pseudo noise sequences for engineers, Electronics & Communication Engineering Journal,Vol.8 Issue 2, April 1996, pp:79-87.
[4] Czernik P.: Metodyka testowania bezpieczeństwa generatorów liczb pseudolosowych w systemach pomiarowo-sterujących, Prace Instytutu Lotnictwa, Kwartalnik naukowy 6/2009 (201), ss: 20-34.
[5] Zwierko A.: Testowanie generatorów pseudolosowych - wybrane programowe pakiety testów statystycznych, VII Krajowa Konferencja Zastosowań Kryptografii, Warszawa, maj 2003, ss:1-20.
[6] Walczak J., Stępień R.: Modeling of the pseudo random signal generators using digital filters. Proceedings of XXXIII conference IC-SPETO May, 2010, pp. 85-86. [7] G. Palumbo, R. Mita, S. Pennisi and M. Poli. Pseudorandom bit generator based on
dynamic linear feedback topology. Electronic Letters, Vol. 28, No. 19, pp. 1097 1098, 2002.
[8] D'Alvano, F. Badra, R.E.: A simple low-cost laboratory hardware for noise generation, IEEE Transaction, May 1996, Vol 39, Issue 2, pp.280-281.
[9] Stępień R., Walczak J.: Wykorzystanie karty dźwiękowej komputera PC do określania długości sekwencji pseudolosowej, Zeszyty Naukowe Politechniki Poznańskiej „Electrical Engineering”, zeszyt 71, 2012, ss: 117-124.
[10] Golomb S. W.: Shift Register Sequences, Laguna Hills, C A Aegean. Park Press, 1982.
[11] Walczak J. Stępień R.: Shift Registers with Dynamic Feedback Loop, XXXIV konferencja IC-SPETO, Ustroń, 2011, pp:126-127.
[12] G. Palumbo, R. Mita, S. Pennisi and M. Poli. Pseudorandom bit generator based on dynamic linear feedback topology. Electronic Letters, Vol. 28, No. 19, pp. 1097 1098, 2002.
[13] Stępień R. Walczak J.: Application of the DLFSR generators in spread spectrum communication, Mixed Design of Integrated Circuits and Systems (MIXDES), 2012 Proceedings of the 19th International Conference, pp:555-558.
[14] Zeitnitz Ch.: program oscyloskopu na kartę dźwiękową komputera, program do pobrania ze strony Autora: http://www.zeitnitz.de/Christian/
J. Walczak, R. Stępień / Estimation o f the pseudorandom signal .
Publication is co- financed by European Union within European Social Fund within SWIFTproject POKL. 08.02.01 -24-005/10.

![Figure 4 illustrates an exemplary amplitude spectrum of the pseudorandom sequence [3]](https://thumb-us.123doks.com/thumbv2/123dok_us/9958886.2891091/4.722.184.565.406.579/figure-illustrates-exemplary-amplitude-spectrum-pseudorandom-sequence.webp)


![Crystal structure of tetraethyl 27,30 dioxo 7,12,20,25 tetra tert butyl 3,16 dioxa 9,22,28,31 tetrathiaheptacyclo[21 3 1 11,5 14,8 110,14 114,18 117,21]dotriaconta 4,6,8(29),10,12,17,19,21(32),23,25 decaene 2,2,15,15 tetracarboxylate](data:image/gif;base64,R0lGODlhAQABAIAAAP///wAAACH5BAEAAAAALAAAAAABAAEAAAICRAEAOw==)