Ethnic/Racial Differences in Social Studies Skills: A Texas, Multiyear Analysis *Mary K. Dietrich, **John R. Slate, ***George W. Moore, ****Frederick C. Lunenburg
Sam Houston State University
*stdmmk13@shsu.edu **profslate@aol.com ***gwm002@shsu.edu ****edu_fcl@shsu.edu Abstract
Investigated in this study was the degree to which differences were present in social studies skills as a function of ethnicity/race (i.e., Asian, White, Hispanic, and Black) of Texas high school students. Data were obtained from the Texas Education Agency Public Education Information Management System for all Texas high school students for the 2004-2005 to the 2011-2012 school years. In this study, statistically significant differences were present in the social studies skills by student ethnicity/race. Asian students had statistically higher average raw scores in four of the five social studies skills objectives examined than White students. Additionally, White students had statistically significantly higher average raw scores than Hispanic students, and Hispanic students had statistically significantly higher average raw scores than Black students for the eight years of data examined. A clear stair-step effect was present by student ethnicity/race in social studies performance. Suggestions for policy and for practice were made, along with recommendations for future research.
Keywords: Ethnicity/Race, Taks, Social Studies, Social Studies Skills
In 1966, James Coleman published a report commissioned as part of the Civil Rights Act of 1964 called Equality
of Educational Study as an attempt to dismantle finally the segregation of public schools that had remained after
the 1954 decision in Brown v. Board of Education (Alexander & Morgan, 2016). Although Coleman (1966) revealed that segregation still largely existed in the United States, he could not substantiate that differences in school resources among White and non-White schools produced a large educational disparity. Further, Coleman (1966) contended that family background factors did have a large effect on academic achievement and that it is necessary to “examine the relation of these background factors to achievement to get a view of some of the family factors that predispose children to learn well or poorly in school” (p. 298). Although the Coleman report was viewed as controversial during the Civil Rights Movement, the necessity to measure ethnic/racial and societal differences using standardized tests has remained.
Since the revelations of the Coleman Report, educational policymakers have aimed to close the achievement gap by analyzing both academic and societal factors. As part of the Elementary and Secondary Education Act, school districts were required to use standardized exams to determine student achievement during the 1980’s (LeBouef & Slate, 2011). In 2001, the Elementary and Secondary Education Act was reauthorized as the No Child Left Behind Act (2002). The No Child Left Behind Act (2002) required more state and local accountability using standardized exams to ensure that all students have the opportunity to be successful. More recently, the Elementary and Secondary Education Act was reauthorized again as Every Student Succeeds Act (2015) and focuses on providing equity to students who are disadvantaged (United States Department of Education, 2018). As with previous educational policies, Every Student Succeeds Act (2015) requires the same accountability measures. As a result of these accountability requirements, researchers (e.g., LeBouef & Slate, 2011) have demonstrated that achievement gaps have existed for decades.
According to the National Center for Education Statistics (2011a), Hispanic and Black student averages have increased since 1990 for Grade 4 and Grade 8 mathematics but the achievement gap between these ethnic/racial groups and White students remains. The National Center for Education Statistics (2011b) also provided similar outcomes in reading explaining that both Hispanic and Black student averages in Grade 4 and Grade 8 reading had increased since 1990 but remain statistically significantly lower than White student averages. With respect to the state of interest for this article, LeBouef and Slate (2011) conducted a 16-year analysis of Grade 5 reading and mathematics scores on the Texas Assessment of Academic Skills and Texas Assessment of Knowledge and
Skills (TAKS) exams. LeBouef and Slate (2011) documented the presence of continuous achievement gaps between White and Hispanic students in both reading and mathematics.
In regard to academic experiences, many researchers (e.g., Corra, Carter, & Carter, 2011) have concluded that Black students have limited opportunities to take advanced classes. White students were enrolled in more Advanced Placement courses than Hispanic and Black students in the 2005-2006 and 2006-2007 school years (Clark, Moore, & Slate, 2012). White students also had the highest passing rates on Advanced Placement exams during the same years (Clark et al., 2012). Further, White and Asian students obtained more course credit for high school science and mathematics courses in Texas than Hispanic and Black students (Zeng & Poelzer, 2016). Researchers (e.g., Daniels, 2011; Heafner & Fitchett, 2015) have documented the presence of racial/ethnic disparities in student achievement in social studies. Beginning in early childhood, a large achievement gap in social studies is apparent for ethnic/racial groups, especially for Black students (Chapin, 2006). Chapin (2006) examined the social studies responses from the Early Childhood Longitudinal Study and determined that Black students who took the General Knowledge Test entering Kindergarten scored lower than White students. Chapin (2006) indicated that Black students entered kindergarten lacking social studies knowledge in comparison to White students. Researchers (e.g., Bein, Hayes, & Jones, 2009; Heafner & Fitchett, 2018) have also reported disparities on social studies achievement at the secondary level. Heafner and Fitchett (2018) analyzed the National Assessment of Educational Progress United States History Assessment and determined that Black students had the poorest performance of any ethnic/racial group, however, they performed statistically similar to White students on social history questions. Heafner and Fitchett (2018) revealed that social questions involving civil rights and race relations (i.e., Brown v. Board of Education, and the contributions of Booker T. Washington and W.E.B DuBois) were more likely to be answered correctly by Black students than by White students. Because history reflects society, “students are more likely to remember and process information that is both meaningful and reflective of their own experiences” (Heafner & Fitchett, 2018, p. 23).
Postsecondary differences in social studies skills have also been established. Bein et al. (2009) analyzed the National Council for Geographic Education Competency-Based Geography Test given to introductory geography students at 20 university campuses in Indiana. According to Bein et al. (2009), Black and Hispanic students had lower average scores on competency-based geography exams than White students. Such an achievement gap is attributed to a lack of Black and Hispanic student engagement in school. Bennett (2006) reported that the recognition and acceptance of racial/ethnic identity is an important factor to student engagement in school. Further, researchers (Daniels, 2011; Heafner & Fitchett, 2015; Martell, 2013) have identified that social studies curriculum and instruction are two components that contribute to ethnic/racial disparities in social studies.
Social Studies Skills
The opportunity for Black students to achieve success in social studies is limited due to the lack of ethnic/racial pedagogical practices and racial/ethnic awareness in the classroom (Daniels, 2011; Heafner & Fitchett, 2015; Zirkel, 2005). For example, Hispanic students had an increase in social studies achievement when it was introduced through a cultural connection. Ramirez (2012) noted that educators who provided culturally relevant instruction promoted the acceptance of a student’s cultural background. Also, appropriate and meaningful resources that reflect and connect the ethnic/racial identity of students, enhances student engagement among racial/ethnic students (Daniels, 2011). For example, Daniels (2011) recommended the study of multiple perspective texts, bilingual books, and discussion topics of racial protest and discriminatory laws to reduce a commonly devalued and often misinterpreted Hispanic history found in many social studies instruction. Yet, ethnic/racial differences between teachers and students can generate uneasiness and uncertainty in discussing matters of race or race relations during class instruction. Zirkel (2005) reported that White teachers feel more confident in meeting the needs of White students rather than students of color. Pedagogy that includes multiple interpretations of history engages students of different backgrounds (Martell, 2013). Further, educators are recommended to include open discussion of racial differences within the classroom (Martell, 2013). Daniels
(2011) contended that social studies educators have a responsibility to provide instruction that includes the identity of people who are historically marginalized, especially when discussing ideas of democracy and civic engagement.
Statement of the Problem
The goal of social studies curriculum is to encourage civic awareness and civic competence in a culturally diverse and democratic country (National Council for the Social Studies, 1994). Yet, researchers (e.g., Daniels, 2011; Heafner & Fitchett, 2015; Martell, 2013) have indicated that Black and Hispanic students are not being adequately served by the current social studies curriculum and instructional methods. Researchers (e.g., Daniels, 2011; Heafner & Fitchett, 2015) have recommended more diversity training for social studies educators. Purpose of the Study
The purpose of this study was to examine the extent to which differences existed in social studies skills among Texas high school students as a function of their ethnicity/race (i.e., Asian, White, Hispanic, and Black). Specifically, eight years of the Texas Assessment of Knowledge and Skills Exit Level Social Studies assessment data were analyzed to determine whether differences were present in social studies skills among four ethnic/racial groups. Through analyzing eight years of Texas statewide data, the extent to which a trend existed in social studies skills by student ethnicity/race was ascertained.
Significance of the Study
Through this study, essential information will be provided about the degree to which differences might be present in social studies skills by student ethnicity/race (i.e., Asian, White, Hispanic, and Black). Research results obtained in this study may provide educators with a better understanding into the social studies achievement of students. Ideally, these research findings could promote local and state educators to review social studies standards and instructional pedagogy, to ensure students of ethnic/racial backgrounds are being provided with the same opportunities of success.
Research Questions
The following overarching research question was addressed in this empirical investigation: What is the difference in the social studies skills of Texas high school students as a function of their ethnicity/race (i.e., Asian, White, Hispanic, and Black)? Specific subquestions under this overarching research question were: (a) What is the difference in basic understanding of history of Texas high school students as a function of their ethnicity/race?; (b) What is the difference in understanding geography of Texas high school students as a function of their ethnicity/race?; (c) What is the difference in understanding economic and social influences of Texas high school students as a function of their ethnicity/race?; (d) What is the difference in understanding of political influences of Texas high school students as a function of their ethnicity/race?; (e) What is the difference in basic social studies skills of Texas high school students as a function of their ethnicity/race?; and (f) What is the extent to which trends are present in the social studies skills of Texas high school students as a function of their ethnicity/race in the 2004-2005 school year through the 2011-2012 school year? Each of the first five research questions was repeated for each of the 8 school years whereas the last research question, a trend question, was repeated for the five social studies objectives. Thus, a total of 45 research questions constituted this research investigation.
Method
Research Design
A non-experimental, causal-comparative research design (Johnson & Christensen, 2012) was used for this article. In this study, the independent variables had already occurred, and extraneous variables were not controlled.
The student archival data that were analyzed in this article represent past state assessment results. As such, the independent variable involved in this research article was ethnicity/race (i.e., Asian, White, Hispanic, and Black) and the dependent variables were the TAKS Exit Level Social Studies scores in the five social studies objectives for the 2004-2005 through the 2011-2012 school years.
Participants and Instrumentation
For the purposes of this study, archival data had previously been for the 2004-2005 through the 2011-2012 school years through the submission and fulfillment of a Public Information Request form to the Texas Education Agency Public Education Information Management System. The TAKS Exit Level Social Studies exam was a graduation requirement for the state of Texas and is used to measure social studies knowledge and skills of Grade 11 students. Beginning in 2012, the State of Texas applied a new standardized assessment, State of Texas Assessment of Academic Readiness (STAAR) to measure achievement in core content areas (Clark, 2011). For select courses in Grades 9-12, End-of-Course (EOC) exams are administered. Since 2012, the implementation and achievement measures for the STAAR and EOC have drastically changed. As a result, data from these assessments will not be included in this study.
The TAKS Exit Level Social Studies exam has five learning objectives that are supported by the Texas Essential Knowledge and Skills designed by the Texas Education Agency in 2000. The TAKS Exit Level Social Studies exam has 55 questions that are comprised of the five objectives. Thirteen questions are assessed from Objective 1 in which students are measured on their understanding of issues and events in U.S. history. Nine questions are assessed from Objective 2 which measures student understanding of geographic influences on historical issues and events. Thirteen questions are assessed from Objective 3 which determines student understanding of economic and social influences on historical issues and events. Nine questions denote Objective 4 that assesses student knowledge of political influences on historical issues and events. Lastly, 11 questions assess Objective 5 that measures student critical-thinking skills to analyze social studies information (Exit Level TAKS Social Studies Information Booklet, 2004, p. 5). Readers are directed to the Texas Education Agency website for information regarding the score validity and score reliability of this assessment.
Results
Prior to conducting a multivariate analysis of variance (MANOVA) procedure to address the research questions previously delineated its underlying assumptions were checked. Specifically examined were data normality, Box’s Test of Equality of Covariance, and the Levene’s Test of Equality of Error Variances. Although these assumptions were not met, the robustness of a MANOVA procedure made it appropriate to use on the data in this study (Field, 2009). Results will be presented in chronological order beginning with the 2004-2005 school year and concluding with the 2011-2012 school year.
Overall Results for All Eight School Years
With respect to the 2004-2005 school year, the MANOVA yielded a statistically significant difference in social studies performance as a function of student ethnicity/race, Wilks’ Λ = .91, p < .001, partial η2 = .031, small effect size (Cohen, 1988). Regarding the 2005-2006 school year, a statistically significant difference was present as a function of student economic status in their overall social studies performance, Wilks’ Λ = .92, p < .001, partial η2 = .027, small effect size (Cohen, 1988). Concerning the 2006-2007 school year, a statistically significant difference was yielded, Wilks’ Λ = .92, p < .001, partial η2 = .028, small effect size (Cohen, 1988). For the 2007-2008 school year, a statistically significant difference was present, Wilks’ Λ = .92, p < .001, partial η2 = .026, small effect size (Cohen, 1988). With respect to the 2008-2009 school year, a statistically significant difference was again yielded, Wilks’ Λ = .93, p < .001, partial η2 = .025, small effect size (Cohen, 1988). Regarding the 2009-2010 school year, a statistically significant difference was revealed, Wilks’ Λ = .93, p < .001, partial η2 = .025, small effect size (Cohen, 1988). Concerning the 2010-2011 school year, a statistically significant difference was revealed, Wilks’ Λ = .95, p < .001, partial η2 = .017, small effect size (Cohen, 1988). For the 2011-2012 school
(Cohen, 1988). In all eight school years, statistically significant differences were revealed in social studies performance by student ethnicity/race. Small effect sizes were present in all eight school years.
Results for Social Studies Objective 1 Across All Eight School Years
Following the analyses of overall social studies performance, univariate analysis of variance (ANOVA) procedures were calculated for each specific TAKS Social Studies Objective. Regarding the 2004-2005 school year, a statistically significant difference was revealed, F(1, 204475) = 3993.57, p< .001, partial η2 = .055, small effect size (Cohen, 1988). For the 2005-2006 school year, the ANOVA yielded a statistically significant difference,
F(1, 210556) = 4540.56, p< .001, partial η2 = .061, moderate effect size (Cohen, 1988). Concerning the 2006-2007 school year, a statistically significant difference was revealed, F(1, 216386) = 5067.01, p< .001, partial η2 = .066, moderate effect size (Cohen, 1988). With respect to the 2007-2008 school year, a statistically significant difference was yielded, F(1, 202244) = 3784.18, p < .001, partial η2 = .053, small effect size (Cohen, 1988). Regarding the 2008-2009 school year, the ANOVA revealed a statistically significant difference, F(1, 142421) = 3187.37, p < .001, partial η2 = .063, moderate effect size (Cohen’s 1988). For the 2009-2010 school year, a statistically significant difference was revealed, F(1, 220142) = 4516.44, p< .001, partial η2 = .058, small effect size (Cohen, 1988). Concerning the 2010-2011 school year, a statistically significant difference was revealed, F(1, 219275) = 2685.02, p< .001, partial η2 = .035, small effect size (Cohen, 1988). Finally, for the 2011-2012 school year, a statistically significant difference was yielded by student economic status, F(1, 227849) = 3331.87, p < .001, partial η2 = .042, small effect size (Cohen, 1988). In all eight school years, statistically significant differences were present on the TAKS Social Studies Objective 1 by student ethnicity/race. Three of the effect sizes were moderate and five effect sizes were in the small category.
Following the univariate ANOVAs, post hoc procedures, specifically Scheffé post hoc procedures, were calculated to determine which student ethnicity/race pairwise comparisons were statistically significantly different. Regarding the 2004-2005 and 2005-2006 school years, Asian students answered, on average, about 1 more item correctly than White students, about 2 more items correctly than Hispanic students, and about three more items correctly than Black students. Concerning the 2006-2007 school year, Asian students answered on average, 0.49 more items correctly than White students, 2.17 more items than Hispanic students, and 2.66 more items correctly than Black students. Asian students answered, on average, 0.41 more items than White students, 1.62 more items than Hispanic students, and 1.71 more items than Black students in the 2007-2008 school year. With respect to the 2008-2009 school year, Asian students answered, on average, 0.45 more items correctly than White students, 1.91 more items correctly than Hispanic students, and 2.11 more items correctly than Black students. Concerning the 2009-2010 school year, Asian students answered, on average, 0.33 more items correctly than White students, 1.66 more items correctly than Hispanic students, and 1.82 more items correctly than Black students. Asian Students answered, on average, 0.24 more items than White students, 1.24 more items correctly than Hispanic students, and 1.45 more items than Black students in the 2010-2011 school year. Finally, for the 2011-2012 school year, Asian students answered, on average, 0.26 more items correctly than White students, 1.41 more items correctly than Hispanic students, and 1.64 more items correctly than Black students. Revealed in Table 1 are the descriptive statistics for these eight school years.
Table 1 Descriptive Statistics by Student Ethnicity/Race on the TAKS Social Studies Objective 1 for the 2004 School Year through the 2012 School Year
School Year and Ethnicity/Race n M SD
2004-2005
White 100,536 8.91 3.51 Hispanic 72,203 7.42 3.71 Black 26,056 6.78 3.98 2005-2006 Asian 5,988 10.12 3.66 White 100,104 9.45 3.58 Hispanic 75,877 7.82 3.73 Black 28,591 7.23 3.99 2006-2007 Asian 5,919 10.26 3.56 White 100,067 9.77 3.36 Hispanic 81,097 8.09 3.62 Black 29,307 7.60 3.85 2007-2008 Asian 6,013 10.56 2.95 White 91,110 10.15 2.53 Hispanic 79,456 8.94 2.73 Black 25,669 8.85 2.80 2008-2009 Asian 5,179 11.25 2.83 White 52,158 10.80 2.69 Hispanic 64,741 9.34 3.08 Black 20,347 9.14 3.16 2009-2010 Asian 6,965 10.74 2.84 White 89,548 10.41 2.61 Hispanic 95,185 9.08 2.91
Black 28,448 8.92 2.94 2010-2011 Asian 6,443 10.80 3.12 White 84,762 10.56 2.63 Hispanic 102,063 9.56 2.82 Black 26,011 9.35 2.85 2011-2012 Asian 7,202 10.74 2.97 White 84,186 10.48 2.72 Hispanic 109,647 9.33 2.94 Black 26,818 9.10 3.03
Results for Social Studies Objective 2 Across All Eight School Years
Following the analyses of overall social studies performance, univariate analysis of variance (ANOVA) procedures were calculated for each specific TAKS Social Studies Objective. Concerning the 2004-2005 school year, a statistically significant difference was revealed, F(1, 204475) = 5568.98, p < .001, partial η2 = .076, moderate effect size (Cohen, 1988). For the 2005-2006 school year, the ANOVA yielded a statistically significant difference,
F(1, 210556) = 4040.72, p < .001, partial η2 = .054, small effect size (Cohen, 1988). Regarding the 2006-2007 school year, a statistically significant difference was revealed, F(1, 216386) = 5580.75, p< .001, partial η2 = .072, moderate effect size (Cohen, 1988). With respect to the 2007-2008 school year, a statistically significant difference was yielded, F(1, 202244) = 4373.52, p< .001, partial η2 = .061, moderate effect size (Cohen, 1988). For the 2008-2009 school year, the ANOVA revealed a statistically significant difference, F(1, 142421) = 2356.09,
p < .001, partial η2 = .047, small effect size (Cohen’s 1988). For the 2009-2010 school year, a statistically significant difference was revealed, F(1, 220142) = 3607.86, p< .001, partial η2 = .047, small effect size (Cohen, 1988). Concerning the 2010-2011 school year, a statistically significant difference was revealed, F(1, 219275) = 2258.30, p< .001, partial η2 = .030, small effect size (Cohen, 1988). Finally, for the 2011-2012 school year, a statistically significant difference was yielded by student economic status, F(1, 227849) = 2525.64, p < .001, partial η2 = .032, small effect size (Cohen, 1988). In all eight school years, statistically significant differences were present on the TAKS Social Studies Objective 2 by student ethnicity/race. Three of the effect sizes were moderate and five effect sizes were in the small category.
Following the univariate ANOVAs, post hoc procedures, specifically Scheffé post hoc procedures, were calculated to determine which student ethnicity/race pairwise comparisons were statistically significantly different. For the 2004-2005 school year, Asian students answered on average, 0.12 more items correctly than White students, 1.52 more items than Hispanic students, and 1.96 more items correctly than Black students. Concerning the 2005-2006 school years, Asian students answered, on average, 0.11 more item correctly than White students, 1.51 more items correctly than Hispanic students, and 1.66 more items correctly than Black students. With respect to the 2006-2007 school year, Asian students answered on average, 0.02 more items correctly than White students, 1.24 more items than Hispanic students, and 1.78 more items correctly than Black students. Asian students answered, on average, 0.07 more items than White students, 1.05 more items than Black students, and 1.06 more items than Hispanic students in the 2007-2008 school year. Regarding the 2008-2009 school year, Asian students answered, on average, 0.05 more items correctly than White students, 0.86 more items correctly
than Hispanic students, and 1.10 more items correctly than Black students. Concerning the 2009-2010 school year, Asian students answered, on average, 0.01 more items correctly than White students, 0.80 more items correctly than Hispanic students, and 1.01 more items correctly than Black students. Asian Students answered, on average, 0.04 more items than White students, 0.70 more items correctly than Hispanic students, and 0.79 more items than Black students in the 2010-2011 school year. Finally, for the 2011-2012 school year, Asian students answered, on average, 0.03 more items correctly than White students, 0.66 more items correctly than Hispanic students, and 0.91 more items correctly than Black students. Delineated in Table 2 are the descriptive statistics for these eight school years.
Table 2
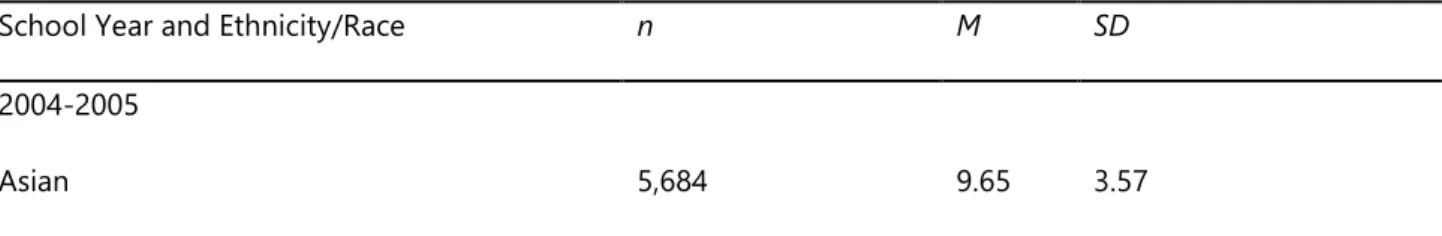
Descriptive Statistics by Student Ethnicity/Race on the TAKS Social Studies Objective 2 for the 2004 School Year through the 2012 School Year
School Year and Ethnicity/Race n M SD
2004-2005 Asian 5,684 9.65 3.57 White 100,536 8.91 3.51 Hispanic 72,203 7.42 3.71 Black 26,056 6.78 3.98 2005-2006 Asian 5,988 7.17 2.52 White 100,104 7.06 2.48 Hispanic 75,877 5.96 2.69 Black 28,591 5.51 2.94 2006-2007 Asian 5,919 7.46 2.52 White 100,067 7.44 2.35 Hispanic 81,097 6.22 2.63 Black 29,307 5.68 2.83 2007-2008 Asian 6,013 7.87 2.12 White 91,110 7.80 1.74 Hispanic 79,456 6.81 2.07
Black 25,669 6.82 2.12 2008-2009 Asian 5,179 8.06 1.92 White 52,158 8.01 1.72 Hispanic 64,741 7.20 2.08 Black 20,347 6.96 2.16 2009-2010 Asian 6,965 7.77 1.90 White 89,548 7.76 1.67 Hispanic 95,185 6.97 2.02 Black 28,448 6.76 2.09 2010-2011 Asian 6,443 7.76 2.17 White 84,762 7.72 1.77 Hispanic 102,063 7.06 1.97 Black 26,011 6.97 2.05 2011-2012 Asian 7,202 8.19 2.00 White 84,186 8.16 1.73 Hispanic 109,647 7.53 1.94 Black 26,818 7.28 2.08
Results for Social Studies Objective 3 Across All Eight School Years
Following the analyses of overall social studies performance, univariate analysis of variance (ANOVA) procedures were calculated for each specific TAKS Social Studies Objective. Regarding the 2004-2005 school year, a statistically significant difference was revealed, F(1, 204475) = 4747.84, p < .001, partial η2 = .065, moderate effect size (Cohen, 1988). Concerning the 2005-2006 school year, the ANOVA yielded a statistically significant difference, F(1, 210556) = 4248.75, p< .001, partial η2 = .057, small effect size (Cohen, 1988). For the 2006-2007 school year, a statistically significant difference was revealed, F(1, 216386) = 4401.61, p< .001, partial η2 = .058, small effect size (Cohen, 1988). With respect to the 2007-2008 school year, a statistically significant difference was yielded, F(1, 202244) = 3678.96, p< .001, partial η2 = .052, small effect size (Cohen, 1988). Regarding the 2008-2009 school year, the ANOVA revealed a statistically significant difference, F(1, 142421) = 2048.19, p < .001, partial η2 = .041, small effect size (Cohen’s 1988). With respect to the 2009-2010 school year, a statistically
significant difference was revealed, F(1, 220142) = 4099.01, p< .001, partial η2 = .053, small effect size (Cohen, 1988). For the 2010-2011 school year, a statistically significant difference was revealed, F(1, 219275) = 2624.55,
p< .001, partial η2 = .035, small effect size (Cohen, 1988). Finally, for the 2011-2012 school year, a statistically significant difference was yielded by student economic status, F(1, 227849) = 2422.03, p< .001, partial η2 = .031, small effect size (Cohen, 1988). In all eight school years, statistically significant differences were present on the TAKS Social Studies Objective 3 by student ethnicity/race. One of the effect sizes was moderate and seven effect sizes were in the small category.
Following the univariate ANOVAs, post hoc procedures, specifically Scheffé post hoc procedures, were calculated to determine which student ethnicity/race pairwise comparisons were statistically significantly different. With respect to the 2004-2005 school year, Asian students answered on average, 0.39 more items correctly than White students, 2.28 more items than Hispanic students, and 2.51 more items correctly than Black students. Regarding the 2005-2006 school years, Asian students answered, on average, 0.40 more item correctly than White students, 1.89 more items correctly than Hispanic students, and 2.67 more items correctly than Black students. For the 2006-2007 school year, Asian students answered on average, 0.27 more items correctly than White students, 1.84 more items than Hispanic students, and 2.50 more items correctly than Black students. Asian students answered, on average, 0.09 more items than White students, 1.28 more items than Hispanic students, and 1.41 more items than Black students in the 2007-2008 school year. With respect to the 2008-2009 school year, Asian students answered, on average, 0.06 more items correctly than White students, 1.17 more items correctly than Hispanic students, and 1.30 more items correctly than Black students. Concerning the 2009-2010 school year, Asian students answered, on average, 0.13 more items correctly than White students, 1.39 more items correctly than Hispanic students, and 1.44 more items correctly than Black students. White students answered, on average, 0.05 more items than Asian students, 1 more item correctly than Hispanic students, and 1.06 more items than Black students in the 2010-2011 school year. Finally, for the 2011-2012 school year, Asian students answered, on average, 0.03 more items correctly than White students, 0.95 more items correctly than Hispanic students, and 1.16 more items correctly than Black students. Depicted in Table 3 are the descriptive statistics for these eight school years.
Table 3
Descriptive Statistics by Student Ethnicity/Race on the TAKS Social Studies Objective 3 for the 2004 School Year through the 2012 School Year
School Year and Ethnicity/Race n M SD
2004-2005 Asian 5,684 9.65 3.57 White 100,536 8.91 3.51 Hispanic 72,203 7.42 3.71 Black 26,056 6.78 3.98 2005-2006 Asian 5,988 10.02 3.59 White 100,104 9.62 3.48 Hispanic 75,877 8.13 3.71
Black 28,591 7.35 3.99 2006-2007 Asian 5,919 10.72 3.60 White 100,067 10.45 3.40 Hispanic 81,097 8.88 3.80 Black 29,307 8.22 4.09 2007-2008 Asian 6,013 11.14 2.95 White 91,110 11.05 2.38 Hispanic 79,456 9.86 2.80 Black 25,669 9.73 2.87 2008-2009 Asian 5,179 11.53 2.73 White 52,158 11.47 2.39 Hispanic 64,741 10.36 2.89 Black 20,347 10.23 2.99 2009-2010 Asian 6,965 11.52 2.75 White 89,548 11.39 2.39 Hispanic 95,185 10.03 2.86 Black 28,448 10.08 2.88 2010-2011 Asian 6,443 11.44 3.09 White 84,762 11.49 2.43 Hispanic 102,063 10.49 2.68 Black 26,011 10.43 2.80 2011-2012
Asian 7,202 11.64 2.89
White 84,186 11.61 2.48
Hispanic 109,647 10.69 2.76
Black 26,818 10.48 2.93
Results for Social Studies Objective 4 Across All Eight School Years
Following the analyses of overall social studies performance, univariate analysis of variance (ANOVA) procedures were calculated for each specific TAKS Social Studies Objective. Regarding the 2004-2005 school year, a statistically significant difference was revealed, F(1, 204475) = 3349.74, p< .001, partial η2 = .047, small effect size (Cohen, 1988). Concerning the 2005-2006 school year, the ANOVA yielded a statistically significant difference, F(1, 210556) = 4077.09, p< .001, partial η2 = .055, small effect size (Cohen, 1988). For the 2006-2007 school year, a statistically significant difference was revealed, F(1, 216386) = 3867.54, p< .001, partial η2 = .051, small effect size (Cohen, 1988). With respect to the 2007-2008 school year, a statistically significant difference was yielded, F(1, 202244) = 2218.22, p< .001, partial η2 = .032, small effect size (Cohen, 1988). Regarding the 2008-2009 school year, the ANOVA revealed a statistically significant difference, F(1, 142421) = 1620.47, p < .001, partial η2 = .033, small effect size (Cohen’s 1988). With respect to the 2009-2010 school year, a statistically significant difference was revealed, F(1, 220142) = 2533.69, p< .001, partial η2 = .033, small effect size (Cohen, 1988). For the 2010-2011 school year, a statistically significant difference was revealed, F(1, 219275) = 1428.25,
p< .001, partial η2 = .019, small effect size (Cohen, 1988). Finally, for the 2011-2012 school year, a statistically significant difference was yielded by student economic status, F(1, 227849) = 1327.94, p< .001, partial η2 = .017, small effect size (Cohen, 1988). In all eight school years, statistically significant differences were present on the TAKS Social Studies Objective 4 by student ethnicity/race. All the effect sizes were in the small category. Following the univariate ANOVAs, post hoc procedures, specifically Scheffé post hoc procedures, were calculated to determine which student ethnicity/race pairwise comparisons were statistically significantly different. For the 2004-2005 school year, Asian students answered on average, 0.40 more items correctly than White students, 1.44 more items than Hispanic students, and 1.79 more items correctly than Black students. Regarding the 2005-2006 school years, Asian students answered, on average, 0.28 more item correctly than White students, 1.52 more items correctly than Hispanic students, and 1.70 more items correctly than Black students. For the 2006-2007 school year, Asian students answered on average, 0.37 more items correctly than White students, 1.47 more items than Hispanic students, and 1.74 more items correctly than Black students. Asian students answered, on average, 0.19 more items than White students, 0.81 more items than Black students, and 0.90 more items than Hispanic students in the 2007-2008 school year. With respect to the 2008-2009 school year, Asian students answered, on average, 0.17 more items correctly than White students, 0.89 more items correctly than Hispanic students, and 0.94 more items correctly than Black students. Concerning the 2009-2010 school year, Asian students answered, on average, 0.13 more items correctly than White students, 0.83 more items correctly than Black students, and 0.86 more items correctly than Hispanic students. Asian students answered, on average, 0.09 more items than White students, 0.56 more item correctly than Black students, and 1.06 more items than Hispanic students in the 2010-2011 school year. Finally, for the 2011-2012 school year, Asian students answered, on average, 0.13 more items correctly than White students, 0.63 more items correctly than Hispanic students, and 0.65 more items correctly than Black students. Revealed in Table 4 are the descriptive statistics for these eight school years.
Table 4
School Year and Ethnicity/Race n M SD 2004-2005 Asian 5,684 9.65 3.57 White 100,536 8.91 3.51 Hispanic 72,203 7.42 3.71 Black 26,056 6.78 3.98 2005-2006 Asian 5,988 7.12 2.61 White 100,104 6.84 2.60 Hispanic 75,877 5.60 2.77 Black 28,591 5.42 3.03 2006-2007 Asian 5,919 7.35 2.57 White 100,067 6.98 2.48 Hispanic 81,097 5.88 2.68 Black 29,307 5.61 2.92 2007-2008 Asian 6,013 7.74 2.10 White 91,110 7.55 1.76 Hispanic 79,456 6.84 2.03 Black 25,669 6.93 2.05 2008-2009 Asian 5,179 8.09 1.94 White 52,158 7.92 1.77 Hispanic 64,741 7.20 2.10 Black 20,347 7.15 2.17 2009-2010
Asian 6,965 7.96 1.96 White 89,548 7.83 1.78 Hispanic 95,185 7.10 2.10 Black 28,448 7.13 2.11 2010-2011 Asian 6,443 7.89 2.16 White 84,762 7.80 1.76 Hispanic 102,063 7.26 1.93 Black 26,011 7.33 1.98 2011-2012 Asian 7,202 8.10 2.03 White 84,186 7.97 1.81 Hispanic 109,647 7.47 2.00 Black 26,818 7.45 2.06
Results for Social Studies Objective 5 Across All Eight School Years
Following the analyses of overall social studies performance, univariate analysis of variance (ANOVA) procedures were calculated for each specific TAKS Social Studies Objective. Regarding the 2004-2005 school year, a statistically significant difference was revealed, F(1, 204475) = 4575.09, p < .001, partial η2 = .063, moderate effect size (Cohen, 1988). Concerning the 2005-2006 school year, the ANOVA yielded a statistically significant difference, F(1, 210556) = 5072.23, p< .001, partial η2 = .067, moderate effect size (Cohen, 1988). For the 2006-2007 school year, a statistically significant difference was revealed, F(1, 216386) = 3780.53, p< .001, partial η2 = .050, small effect size (Cohen, 1988). With respect to the 2007-2008 school year, a statistically significant difference was yielded, F(1, 202244) = 3160.78, p < .001, partial η2 = .045, small effect size (Cohen, 1988). Regarding the 2008-2009 school year, the ANOVA revealed a statistically significant difference, F(1, 142421) = 2207.27, p < .001, partial η2 = .044, small effect size (Cohen’s 1988). With respect to the 2009-2010 school year, a statistically significant difference was revealed, F(1, 220142) = 2318.47, p< .001, partial η2 = .031, small effect size (Cohen, 1988). For the 2010-2011 school year, a statistically significant difference was revealed, F(1, 219275) = 2132.96, p< .001, partial η2 = .028, small effect size (Cohen, 1988). Finally, for the 2011-2012 school year, a statistically significant difference was yielded by student economic status, F(1, 227849) = 1682.87, p < .001, partial η2 = .022, small effect size (Cohen, 1988). In all eight school years, statistically significant differences were present on the TAKS Social Studies Objective 4 by student ethnicity/race. Two of the effect sizes were moderate and six of the effect sizes were in the small category.
Following the univariate ANOVAs, post hoc procedures, specifically Scheffé post hoc procedures, were calculated to determine which student ethnicity/race pairwise comparisons were statistically significantly different. Concerning the 2004-2005 school year, Asian students answered on average, 0.18 more items correctly than White students, 1.66 more items than Hispanic students, and 2.27 more items correctly than Black students. Regarding the 2005-2006 school years, Asian students answered, on average, 0.15 more item correctly than
White students, 1.71 more items correctly than Hispanic students, and 2.33 more items correctly than Black students. Concerning the 2006-2007 school year, Asian students answered on average, 0.06 more items correctly than White students, 1.25 more items than Hispanic students, and 1.76 more items correctly than Black students. White students answered, on average, 0.16 more items than Asian students, 0.89 more items than Hispanic students, and 1.10 more items than Black students in the 2007-2008 school year. With respect to the 2008-2009 school year, Asian students and White students answered, on average, about the same number of items correctly. These two groups answered, on average, 0.90 more items correctly than Hispanic students, and 1.24 more items correctly than Black students. Concerning the 2009-2010 school year, White students answered, on average, 0.02 more items correctly than White students, 0.68 more items correctly than Hispanic students, and 0.93 more items correctly than Black students. White students answered, on average, 0.15 more items than Asian students, 0.69 more item correctly than Hispanic students, and 0.91 more items than Black students in the 2010-2011 school year. Finally, for the 2011-2012 school year, White students answered, on average, 0.12 more items correctly than Asian students, 0.64 more items correctly than Hispanic students, and 0.79 more items correctly than Black students. Delineated in Table 5 are the descriptive statistics for these eight school years.
Table 5
Descriptive Statistics by Student Ethnicity/Race on the TAKS Social Studies Objective 5 for the 2004 School Year through the 2012 School Year
School Year and Ethnicity/Race n M SD
2004-2005 Asian 5,684 9.65 3.57 White 100,536 8.91 3.51 Hispanic 72,203 7.42 3.71 Black 26,056 6.78 3.98 2005-2006 Asian 5,988 9.15 3.12 White 100,104 9.00 3.09 Hispanic 75,877 7.44 3.44 Black 28,591 6.82 3.71 2006-2007 Asian 5,919 9.20 3.00 White 100,067 9.14 2.78 Hispanic 81,097 7.95 3.08 Black 29,307 7.44 3.41 2007-2008
Asian 6,013 9.85 2.49 White 91,110 10.01 1.92 Hispanic 79,456 9.12 2.34 Black 25,669 8.91 2.47 2008-2009 Asian 5,179 10.00 2.30 White 52,158 10.00 2.00 Hispanic 64,741 9.10 2.40 Black 20,347 8.76 2.55 2009-2010 Asian 6,965 9.89 2.28 White 89,548 9.91 1.91 Hispanic 95,185 9.23 2.21 Black 28,448 8.98 2.33 2010-2011 Asian 6,443 9.93 2.61 White 84,762 10.08 1.98 Hispanic 102,063 9.39 2.18 Black 26,011 9.17 2.34 2011-2012 Asian 7,202 10.00 2.46 White 84,186 10.12 2.03 Hispanic 109,647 9.48 2.26 Black 26,818 9.33 2.42 Discussion
The extent to which differences were present in the social studies skills of Texas high school students as a function of their ethnicity/race (i.e. Asian, White, Hispanic and Black) was addressed in this study. Eight years of statewide data on five TAKS Exit Level Social Studies Objectives were analyzed to ascertain the effect of ethnicity/race on student performance. In each school year, statistically significant results were present.
Following these statistical analyses, the presence of trends for the five Social Studies objectives by ethnicity/race was determined. Results will be summarized in the next section.
Social Studies Objective 1: History
Social Studies Objective 1 contained 13 questions on understanding issues and events in United States History. Asian students had an average score that was 0.03 to 0.40 points higher on Social Studies Objective 1 than White students, 0.95 to 2.28 points higher than Hispanic students and 1.06 to 2.67 points higher than Black students for each of the eight school years of data analyzed. During each school year examined, Asian students performed better than White, Hispanic, and Black students. Similarly, in each school year, White students performed better than Hispanic students, and Hispanic students performed better than Black students. Presented in Table 6 is a summary of the previously mentioned effect size calculations for Objective 1.
Table 6
Summary of Social Studies Performance for Objective 1 of the TAKS Social Studies Exam as a Function of Ethnicity/Race for the 2004-2005 through the 2011-2012 School Year
School Year Statistically Significant Effect Size Lowest Performing
Group
2004-2005 Yes Small Black Students
2005-2006 Yes Moderate Black Students
2006-2007 Yes Moderate Black Students
2007-2008 Yes Small Black Students
2008-2009 Yes Moderate Black Students
2009-2010 Yes Small Black Students
2010-2011 Yes Small Black Students
2011-2012 Yes Small Black Students
Social Studies Objective 2: Geography
Social Studies Objective 2 contained nine questions regarding student understanding of geography and its influences historical issues and events. Asian students had an average score that was 0.01 to 0.12 points higher on Social Studies Objective 2 than White students, 0.66 to 1.52 points higher than Hispanic students and 0.79 to 1.96 points higher than Black students for each of the eight school years of data analyzed. During each school year examined, Asian students performed better than White, Hispanic, and Black students. Similarly, in each school year, White students performed better than Hispanic students. Hispanic students performed better than Black students except for the 2007-2008 school year. A summary of the partial eta squares, the effect sizes, is presented in Table 7.
Table 7
Summary of Social Studies Performance for Objective 2 of the TAKS Social Studies Exam as a Function of Ethnicity/Race for the 2004-2005 through the 2011-2012 School Year
School Year Statistically Significant Effect Size Lowest Performing Group
2004-2005 Yes Moderate Black Students
2005-2006 Yes Small Black Students
2006-2007 Yes Moderate Black Students
2007-2008 Yes Moderate Hispanic Students
2008-2009 Yes Small Black Students
2009-2010 Yes Small Black Students
2010-2011 Yes Small Black Students
Social Studies Objective 3: Economics and Social Influences
Social Studies Objective 3 provided 13 questions on economic and social issues in American history from the colonial era to the late twentiethcentury. Asian students had an average score that was 0.03 to 0.39 points higher on Social Studies Objective 3 than White students, 0.95 to 2.28 points higher than Hispanic students and 1.06 to 2.67 points higher than Black students for each of the eight school years of data analyzed. During all but one school year examined, Asian students performed better than White students. In addition, White students performed better than Hispanic students, and Hispanic students performed better than Black students during all school years analyzed. Table 8 contains a summary of the effect sizes for these statistically significant differences.
Table 8
Summary of Social Studies Performance for Objective 3 of the TAKS Social Studies Exam as a Function of Ethnicity/Race for the 2004-2005 through the 2011-2012 School Year
School Year Statistically Significant Effect Size Lowest Performing
Group
2004-2005 Yes Moderate Black Students
2005-2006 Yes Small Black Students
2006-2007 Yes Small Black Students
2007-2008 Yes Small Black Students
2008-2009 Yes Small Black Students
2009-2010 Yes Small Black Students
2010-2011 Yes Small Black Students
Social Studies Objective 4: Political Influences
Social Studies Objective 4 contained nine questions on the development of representative government in the United States as well as on political influences in American history from the colonization era to the present. Asian students had an average score that was 0.09 to 0.40 points higher on Social Studies Objective 4 than White students, 0.63 to 1.52 points higher than Hispanic students and 0.56 to 1.79 points higher than Black students for each of the eight school years of data analyzed. During each school year examined, Asian students performed better than White, Hispanic, and Black students. Similarly, in each school year, White students performed better than Hispanic students and Black students. In the 2007-2008, 2009-2010, and the 2010-2011 school years, Black students performed better than Hispanic students. A summary of the effect sizes for these statistically significant differences is delineated in Table 9.
Table 9
Summary of Social Studies Performance for Objective 4 of the TAKS Social Studies Exam as a Function of Ethnicity/Race for the 2004-2005 through the 2011-2012 School Year
School Year Statistically Significant Effect Size Lowest Performing
Group
2004-2005 Yes Small Black Students
2005-2006 Yes Small Black Students
2006-2007 Yes Small Black Students
2007-2008 Yes Small Hispanic Students
2008-2009 Yes Small Black Students
2009-2010 Yes Small Hispanic Students
2010-2011 Yes Small Hispanic Students
Social Studies Objective 5: Social Studies Skills
Social Studies Objective 5 contained 11 questions on the TAKS Exit Level Social Studies assessment. For the 2004-2005, 2005-2006, and 2006-2007 school years, Asian students had an average score that was 0.06 to 0.18 points higher on Social Studies Objective 5 than White students, 1.25 to 1.66 points higher than Hispanic students and 1.76 to 2.33 points higher than Black students. For the 2007-2008, 2009-2010, 2010-2011 and 2011-2012 school years, White students had an average score that was 0.02 to 0.16 points higher on Social Studies Objective 5 than Asian students, 0.64 to 0.90 points higher than Hispanic students and 0.79 to 1.24 points higher than Black students. In the 2008-2009 school year, Asian and White students performed, on average, about the same. During each school year examined, Asian and White students performed better than Hispanic and Black students. Similarly, in each school year, Hispanic students performed better than Black students. Revealed in Table 10 is a summary of the effect size calculations for Objective 5.
Table 10
Summary of Social Studies Performance for Objective 5 of the TAKS Social Studies Exam as a Function of Ethnicity/Race for the 2004-2005 through the 2011-2012 School Year
School Year Statistically Significant Effect Size Lowest Performing
Group
2004-2005 Yes Moderate Black Students
2005-2006 Yes Moderate Black Students
2006-2007 Yes Small Black Students
2007-2008 Yes Small Black Students
2008-2009 Yes Small Black Students
2009-2010 Yes Small Black Students
2010-2011 Yes Small Black Students
2011-2012 Yes Small Black Students
Connection with Existing Literature
Researchers (Bein et al., 2009; Chapin, 2006; Daniels, 2011; Heafner & Fitchett, 2015; Heafner & Fitchett, 2018) have documented the presence of ethnic/racial differences in social studies. In this investigation, statistically significant differences were also present in social studies achievement by ethnicity/race. Asian and White students had statistically significantly higher average scores on all five TAKS Exit Level Social Studies Objectives than their Hispanic and Black peers. Of the five social studies objectives measured on the TAKS Exit Level Social Studies exam, Black students had the lowest performance. Researchers (Bein et al., 2009; Chapin, 2006; Heafner & Fitchett, 2018) have demonstrated disparities in Black student performance in social studies beginning in early childhood and continuing to the secondary level. Further, Bein et al. (2009) indicated that Hispanic and Black students have lower average scores on competency-based geography exams than White students. Hispanic and Black students performed the lowest on Objective 2 of the TAKS Exit Level Social Studies exam which contains questions regarding geography. Results of this investigation are congruent with the findings of other researchers (Bein et al., 2009; Daniels, 2011; Heafner & Fitchett, 2015; Heafner & Fitchett, 2018) who have established the presence of gaps in social studies achievement as a function of ethnicity/race.
Implications for Policy and Practice
Based upon the results of this multiyear investigation, several implications are revealed for policy and for practice. Overall, Asian and White students outperformed Hispanic and Black students on all five social studies objectives examined in this investigation. With respect to policy, policymakers and educators should be aware that racial/ethnic disparities are present in social studies performance. Researchers (Chapin, 2006; Bein et al., 2009; Daniels, 2011; Heafner & Fitchett, 2015; Heafner & Fitchett, 2018) have indicated ethnic/racial disparities in social studies achievement is present at the primary and secondary levels. Researchers (Daniels, 2011; Heafner & Fitchett, 2015; Martell, 2013) have also addressed that social studies curriculum and instructional delivery are two components that contributes to racial/ethnic differences in social studies performance. Therefore, it is necessary for policymakers to investigate social studies textbooks, curriculum, and state standards to guarantee that different ethnic/racial groups are properly represented in social studies curricula.
Further, educators need to include ethnic/racial pedagogical practices and promote ethnic/racial awareness in the classroom. Martell (2013) recommended that teachers include pedagogy that includes diverse interpretations of history and is representative of different backgrounds. In addition, diversity training is recommended to ensure teacher instruction is culturally inclusive (Daniels, 2011; Heafner & Fitchett, 2015). Suggestions for Future Research
Based upon the results of this multiyear, statewide analysis, several suggestions for future research can be made. Analyzed in this study was the relationship between student ethnicity/race groups and their performance on the TAKS Exit Level Social Studies exam. An extension of this investigation to other subject areas such as reading, mathematics, and science is highly recommended. Additionally, only the TAKS Exit Level Social Studies exam that was administered to Grade 11 students was examined in this article. Lower level grades could be investigated to determine the extent to which differences might exist in social studies performance between different ethnic/racial groups in Grades 3-10.
This study was limited to the state of Texas. Researchers are encouraged to extend this study to other states to determine whether the findings presented herein would be comparable to other states. A final recommendation for future research would be to analyze social studies performance as a function of other student demographic characteristics such as their gender and economic status.
Conclusion
In this research study, the social studies performance of Texas high school students was addressed as a function of their ethnicity/race. Inferential statistical analyses were conducted of eight years of Texas statewide data and revealed the presence of a clear stair-step effect across all five TAKS Social Studies Objectives. Asian students had the best performance, followed by White students, then Hispanic students, and then by Black students. These findings were consistent across all eight school years and across all five Social Studies Objectives.
References
1. Alexander, K., & Morgan, S. L. (2016). The Coleman Report at fifty: Its legacy and implications for future research on equality of opportunity. The Russell Sage Foundation Journal of the Social Sciences, 2(5), 1-16. doi:10.7758/RSF.2016.2.5.01
2. Bein, F. L., Hayes, J. J., & Jones, T. G. (2009). Fifteen year follow-up geography skills test administered in Indiana, 1987 and 2002. Journal of Geography, 108(1), 30-36.
3. Bennett Jr., M. D. (2006). Cultural resources and school engagement among African American youths: The role of racial socialization and ethnic identity. Children & Schools, 28(4), 197.
4. Chapin, J. R. (2006). The achievement gap in social studies and science starts early: Evidence from the Early Childhood Longitudinal Study. Social Studies, 97(6), 231-238. Retrieved from https://doi.org/10.3200/TSSS.97.6.231-238
5. Clark, C. (2011). Testing, testing: Texas scandalized exam moves from TAKS to STAAR. Texas Lone Star, 18-21. Retrieved from https://www.mytexaspublicschool.org/Documents/april-may2012-testing.aspx
6. Clark, D., Moore, G. W., & Slate, J. R. (2012). Advanced Placement courses: Gender and ethnic differences in enrollment and success. Journal of Education Research, 6(3), 265-277.
7. Cohen, J. (1988). Statistical power analysis for the behavioral sciences (2nd ed.). Hillsdale, NJ: Lawrence Erlbaum.
8. Coleman, J. (1966). Equality of Educational Opportunity (COLEMAN) Study. Retrieved from https://files.eric.ed.gov/fulltext/ED012275.pdf
9. Corra, M., Carter, J. S., & Carter, S. K. (2011). The interactive impact of race and gender on high school advanced course enrollment. The Journal of Negro Education, 80(1), 33-46.
10. Daniels, E. A. (2011). Racial silences: Exploring and incorporating critical frameworks in the social studies.
The Social Studies, 102, 211-220. https://doi.org/10.1080/00377996
11. Field, A. (2009). Discovering statistics using SPSS (3rd ed.). Thousand Oaks, CA: Sage.
12. Heafner, T. L., & Fitchett, P. G. (2015). An opportunity to learn US History: What NAEP data suggest regarding opportunity gap. The High School Journal, 98(3), 226-249. https://doi.org/10.1353/hsj.2015.0006 13. Heafner, T. L., & Fitchett, P. G. (2018). US history knowledge and associated effects of race, gender, wealth, and urbanity: Item response theory (IRT) modeling of NAEP-USH achievement. The Journal of Social Studies Research, 42, 11-25.
14. Johnson, B., & Christensen, L. (2012). Educational research: Quantitative, qualitative, and mixed approaches.
Thousand Oaks, CA: Sage.
15. LeBouef, A., & Slate, J. R. (2011). The achievement gap between White and non-White students: A conceptual analysis. National Council of Professors of Education Administration, 1-20. Retrieved from https://files.eric.ed.gov/fulltext/EJ971502.pdf
16. Martell, C. C. (2013). Race and histories: Examining culturally relevant teaching in the U.S. history classroom.
Theory and Research in Social Education, 41(1), 65-88.
17. National Center for Education Statistics. (2011a). Achievement gaps: How Black and White students in public
schools perform in mathematics and reading on the National Assessment of Educational Progress. Retrieved
from https://files.eric.ed.gov/fulltext/ED505903.pdf
18. National Center for Education Statistics. (2011b). Achievement gaps: How Hispanic and White students in
public schools perform in mathematics and reading on the National Assessment of Educational Progress.
Retrieved from https://files.eric.ed.gov/fulltext/ED520960.pdf
19. National Council for the Social Studies. (1994). National curriculum standards for social studies: Executive
summary. Washington, DC: Library of Congress.
20. Onwuegbuzie, A. J., & Daniel, L. G. (2002). Uses and misuses of the correlation coefficient. Research in the Schools, 9(1), 73-90.
21. Ramirez, A. D. (2012). Latino cultural knowledge in the social studies classroom. Journal of Hispanic Higher Education, 11(2), 213-226.
22. United States Department of Education. (2018). Every Student Succeeds Act (ESSA). Retrieved from http://www.ed.gov/essa?src=rn
23. Zeng, L., & Poelzer, G.H. (2016). Analyses of trends in high school students’ math-science course credit attainment and registrations in Texas. Education, 137(2), 157-197.
24. Zirkel, S. (2005). Ongoing issues of racial and ethnic stigma in education 50 years after Brown v. Board.