Seton Hall University
eRepository @ Seton Hall
Seton Hall University Dissertations and Theses(ETDs) Seton Hall University Dissertations and Theses
Spring 3-5-2019
A Multi-year Study of the Effect of School Size on
the College and Career Readiness of New Jersey
Public High School Students
Shae-Brie M. Dow
Seton Hall University, [email protected]
Follow this and additional works at:https://scholarship.shu.edu/dissertations
Part of theOther Education Commons, and theSecondary Education Commons
Recommended Citation
Dow, Shae-Brie M., "A Multi-year Study of the Effect of School Size on the College and Career Readiness of New Jersey Public High School Students" (2019).Seton Hall University Dissertations and Theses (ETDs). 2652.
A Multi-year Study of the Effect of School Size on the College and Career Readiness of
New Jersey Public High School Students
Shae-Brie M. Dow
Dissertation Committee: Luke Stedrak, Ed.D., Mentor
Barbara Strobert, Ed.D. Adam Angelozzi, Ed.D. Lavetta S. Ross, Ed.D.
Submitted in partial fulfillment of the requirements for the degree of
Doctor of Education
Seton Hall University 2019
2
© Copyright 2019 by Shae-Brie M. Dow All rights reserved.
i
Abstract
According to the National Center for Public Policy and Higher Education & The Southern Regional Education Board (2010), there is a disparity between those who are college-eligible, and those who are actually college-ready. In New Jersey, a large
percentage of students who graduate from its public schools are inadequately prepared for the academic rigors of college (NJDOE, 2012; Education Transformation Task Force Initial Report, 2011, p.3).
It has been suggested that school size may affect the parameters that constitute readiness (Moore, 2013). An examination of extent literature revealed that there is not an agreement on whether large schools or small schools best cultivate student readiness. This research seeks to fill that void.
The sample for this study consisted of 314 New Jersey public high schools excluding magnet, charter, alternative, and vocational schools. There were five college and career readiness indicators investigated, including the percentage of students who took the SAT (SAT Participation), the average SAT mathematics performance (SAT Performance), the average percentage of students who achieved College Board SAT benchmark score (Percent SAT Benchmark Achieved), the average Advanced Placement (AP) or International Baccalaureate (IB) participation (AP/IB Participation), and the percent (on average) of students that earned an AP scored of 3 or better or an IB score of 4 or better (AP/IB Benchmark Achieved).
The study was carried out for three consecutive school years (i.e. 2014–2015, 2015–2016 and 2016–2017) to ensure reliability of the results obtained.
ii
A regression analysis was then carried out to understand the relationship between school size and each of the five quantities being considered. ANOVA was then employed to explore the relationship between these sizes and the five variables being considered as indicators of readiness.
This investigation found school size to have a statistically significant effect on SAT Performance, Percent SAT Benchmark Achieved, AP/IB Participation and Percent AP/IB Benchmark Achieved. The only exception to this general result was during the school year 2016–2017, when school size was shown to influence SAT participation as well. The ANOVA also showed that smaller school sizes may be counterproductive for college readiness.
An analysis of the results obtained in this study suggests that school size can have a significant impact on SAT performance, Percent SAT Benchmark Achieved, AP/IB participation and Percent AP/IB Benchmark Achieved. In general, a school size that is greater than 600 students appears to have a positive influence on these parameters. Since these parameters effect readiness, this study demonstrates that readiness is better
achieved, on average, in relatively larger schools, that have student populations greater than 600 students, at least for the schools being studied in this thesis.
According to the results obtained, students from New Jersey schools with a larger number of students (i.e. greater than 600) were more likely to be college ready.
Keywords:
College Readiness, College Eligible, Economies of Scale, New Jersey Public Schools, School Connectedness, School Size
iii
Acknowledgements
While completing my doctoral studies and writing this dissertation I received
encouragement, guidance, love and support from my village; without whom none of this would have been possible. I would like to take the time to acknowledge those individuals who stand out among all those with whom I have interacted during my doctoral journey. I extend my heartfelt gratitude to each of these outstanding people.
My Seton Hall University mentors, colleagues, and friends, especially my advisor, Dr. Luke Stedrak for your guidance and support; my second reader, Dr. Barbara Strobert for your consistent gift of targeted guidance and patience to ensure my work made a contribution to our field; and the members of Cohort XVII who journeyed with me;
My committee members, also friends and colleagues: Dr. Lavetta S. Ross, for always reminding me to “follow the recipe” and to stay the course; and Dr. Adam Angelozzi, for your suggestions and positive comments;
Dr. James Caulfield, rest in peace, your loving memory lives on through the continuation of the Seton Hall University Ed.D. Program you founded and committed your life to for so many years; thank you for your vision and dedication to the field of education;
My husband, Sherlock Dow, my biggest cheerleader; thank you for loving me and holding me accountable so that failure and quitting were never options;
My mother, LaVerne McPhail, who planted in me a true love of learning and taught me the power of education; thank you Mom for each and every sacrifice you made so that I could grow and blossom – We got us a doctorate now; My prayer warriors and bonus moms: Bernice Dow and Annette Taylor, thank you both for making sure my steps were always covered; and
My father, Andre McPhail, and my brothers, Andre II and Anwar, I love each of you; thank you for your love and support.
Again, to my village that is large and vast, thank you! You are my extended family of aunts and uncles, nieces and nephews, cousins and “cousins,” my sisters-in-love and brothers-in-love, and my Sorors and sistah-friends. You are my collective. Thank you for the many forms of support and encouragement you have extended to me as I labored to complete all that was required in becoming Dr. Shae-Brie M. Dow.
iv
Dedication
“For me, becoming isn’t about arriving somewhere or achieving a certain aim. I see it instead as forward motion, a means of evolving, a way to reach continuously toward a better self. The journey doesn’t end.”
― Michelle Obama, Becoming
This work is dedicated to my children ―
My daughters, Jordynn and Jocelynn, and my two bonus sons, Jonathan and Khamal. May each of you continue your forward evolution towards the best selves you are
becoming, and do so together. You, like this work, are my legacy. I love and celebrate each of you.
v Table of Contents Abstract ... i Acknowledgements ... iii Dedication ... iv Table of Contents ... v List of Tables ... ix List of Figures ... xi Chapter I... 1 INTRODUCTION ... 1 Background ... 1
Statement of the Problem ... 6
Purpose of Study ... 7
Research Questions ... 8
Hypotheses ... 8
Null Hypotheses ... 8
Design and Methodology ... 9
Conceptual and Theoretical Framework ... 10
Significance of Study ... 11 Limitations ... 11 Delimitations ... 14 Definition of Terms... 15 Organization of Study ... 16 Chapter II ... 18
REVIEW OF THE LITERATURE ... 18
Introduction ... 18
Literature Search Procedures ... 20
Inclusion and Exclusion Criteria for Literature ... 21
Existing Studies on the Effect of School Size on Student Outcomes ... 22
Focus of the Review... 25
Limitations of the Review ... 27
Review of Literature Topics ... 29
History of School Size and Consolidation ... 29
School Size and Its Effect on Course Offerings ... 32
vi
School Size and Teacher Retention ... 36
School Size and Student Outcomes ... 38
School Size and Dropout Rate ... 41
School Size and College Readiness ... 43
Theoretical Frameworks ... 45 Synthesis ... 47 Conclusion ... 49 Chapter III ... 51 METHODOLOGY ... 51 Introduction ... 51 Research Design ... 51 Research Questions ... 52 Hypotheses ... 53 Null Hypotheses ... 53
Data Source/ Sample Population ... 53
Variables and Measures ... 56
Reliability and Validity ... 57
Instrumentation/Data Collection ... 58
Data Sampling Method ... 58
Analysis Construct ... 60 Data Analysis ... 63 Summary ... 65 Chapter IV ... 66 DATA ANALYSIS ... 66 Introduction ... 66 Research Questions ... 66 Hypotheses ... 67 Null Hypotheses ... 67
Analysis and Results ... 68
Summary of Results ... 116
Chapter V ... 118
CONCLUSIONS AND RECOMMENDATIONS ... 118
Introduction ... 118
vii
Relationship to Theoretical Framework ... 121
Links to Literature Review ... 122
Recommendations for Future Research ... 124
Recommendations for Policy ... 127
Recommendations for Practice ... 129
Conclusion ... 131
Appendix ... 135
Assumptions for Regression ... 135
SAT Participation... 135
First analysis: 2014–2015 year ... 135
General Finding: ... 137
Second analysis: 2015–2016 year ... 137
General Finding: ... 139
Third analysis: 2016–2017 year ... 140
General Finding: ... 142
SAT Performance... 142
First analysis: 2014–2015 year ... 142
General Finding: ... 144
Second analysis: 2015–2016 year ... 144
General Finding: ... 146
Third analysis: 2016–2017 year ... 147
General Finding: ... 149
Percent SAT Benchmark Achieved ... 149
First analysis: 2014–2015 year ... 149
General Finding: ... 151
General Finding: ... 152
Second analysis: 2015–2016 year ... 152
Third analysis: 2016–2017 year ... 154
General Finding: ... 156
AP/IB Participation ... 156
First analysis: 2014–2015 year ... 156
General Finding: ... 158
Second analysis: 2015–2016 year ... 159
viii
Third analysis: 2016–2017 year ... 161
General Finding: ... 163
Percent AP/IB Benchmark Achieved ... 163
First analysis: 2014–2015 year ... 163
General Finding: ... 165
Second analysis: 2015–2016 year ... 166
General Finding ... 168
Third analysis: 2016–2017 year ... 168
General Finding: ... 170
ix
List of Tables
Table 1. School Size of New Jersey Public High Schools (NJDOE, 2017b). ... 55 Table 2. Description of the Variables Used in the Study (NJDOE, 2017b) ... 56 Table 3. Correlations between School Size, SAT Participation, SAT Performance,
Percent SAT Benchmark Achieved, AP/IB Participation and Percent AP/IB
Benchmark Achieved ... 69 Table 4. Regression Results: Predictor Variable—School Size ... 71 Table 5. Differences in value of SAT and AP/IB participation and performance between
different groups of School Size ... 74 Table 6. Differences in value of SAT Performance between different groups of School
Size ... 75 Table 7. Differences in value of Percent SAT Benchmark Achieved between different
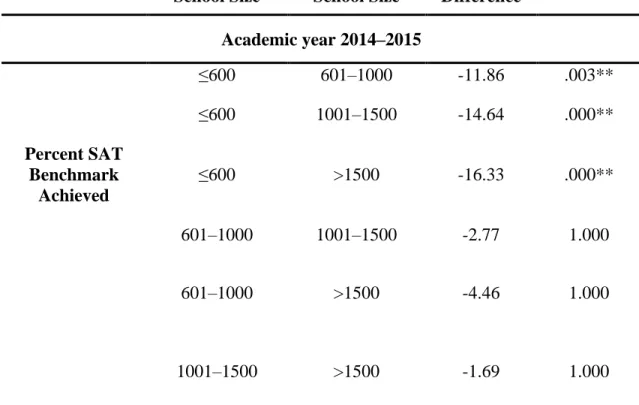
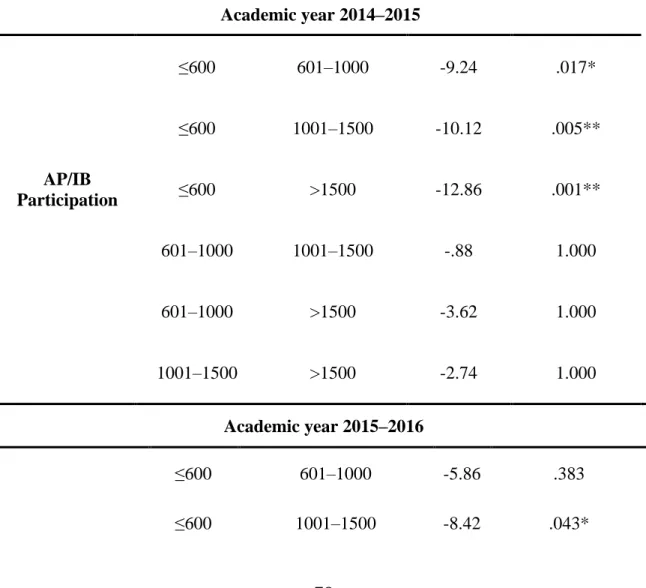
groups of School Size ... 77 Table 8. Differences in value of AP/IB Participation between different groups of School
Size ... 79 Table 9. Differences in value of Percent AP/IB Benchmark Achieved between different
groups of School Size ... 81 Table 10. Correlations between SAT Participation, Dropout Rate and School Size (First
analysis with the 2014–2015 year included) ... 84 Table 11. Regression Results: Criterion Variable—SAT Participation (First Analysis with the 2014–2015 year included) ... 84 Table 12. Correlations between SAT Performance, Dropout Rate and School Size (First
analysis with the 2014—2015 year included) ... 85 Table 13. Regression Results: Criterion Variable—SAT Performance (First Analysis with the 2014–2015 year included) ... 86 Table 14. Correlations between Percent SAT Benchmark Achieved, Dropout Rate and
School Size (First analysis with the 2014–2015 year included) ... 87 Table 15. Regression Results: Criterion Variable—Percent SAT Benchmark Achieved
(First Analysis with the 2014–2015 year included) ... 88 Table 16. Correlations between AP/IB Participation, Dropout Rate and School Size (First
analysis with the 2014–2015 year included) ... 89 Table 17. Regression Results: Criterion Variable—AP/IB Participation (First Analysis
with the 2014–2015 year included) ... 90 Table 18. Correlations between Percent AP/IB Benchmark Achieved, Dropout Rate and
School Size (First analysis with the 2014–2015 year included) ... 91 Table 19. Regression Results: Criterion Variable—Percent AP/IB Benchmark Achieved
(First Analysis with the 2014–2015 year included) ... 92 Table 20. Correlations between SAT Participation, Dropout Rate, Student Attendance
and School Size (second analysis with the 2015–2016 year included) ... 93 Table 21. Regression Results: Criterion variable— SAT participation (second analysis
with the 2015–2016 year included) ... 94 Table 22. Correlations between SAT performance, Dropout Rate, Student Attendance and School Size (Second analysis with the 2015–2016 year included) ... 95 Table 23. Regression Results: Criterion Variable—SAT Performance (Second Analysis
x
Table 24. Correlations between Percent SAT Benchmark Achieved, Dropout Rate, Student Attendance and School Size (Second analysis with the 2015–2016 year included) ... 97 Table 25. Regression Results: Criterion Variable—Percent SAT Benchmark Achieved
(Second Analysis with the 2015–2016 year included) ... 98 Table 26. Correlations between AP/IB participation, Dropout Rate, Student Attendance
and School Size (Second analysis with the 2015–2016 year included) ... 99 Table 27. Regression Results: Criterion Variable—AP/IB Participation (Second Analysis
with the 2015–2016 year included) ... 100 Table 28. Correlations between Percent AP/IB Benchmark Achieved, Dropout Rate,
Student Attendance and School Size (Second analysis with the 2015–2016 year included) ... 101 Table 29. Regression Results: Criterion Variable—Percent AP/IB Benchmark Achieved
(Second Analysis with the 2015–2016 year included) ... 102 Table 30. Correlations between SAT Participation, Dropout Rate, Student Attendance,
Teacher Retention and School Size (Third analysis with the 2016–2017 year
included) ... 104 Table 31. Regression Results: Criterion Variable—SAT Participation (Third Analysis
with the 2016–2017 year included) ... 104 Table 32. Correlations between SAT Performance, Dropout Rate, Student Attendance
and School Size (Second analysis with the 2015–2016 year included) ... 105 Table 33. Regression Results: Criterion Variable—SAT Performance (Third Analysis
with the 2016–2017 year included) ... 106 Table 34. Correlations between Percent SAT Benchmark Achieved, Dropout Rate,
Student Attendance, Teacher Retention and School Size (Third analysis with the 2016–2017 year included)... 108 Table 35. Regression Results: Criterion Variable—Percent SAT Benchmark Achieved
(Third Analysis with the 2016–2017 year included) ... 108 Table 36. Correlations between AP/IB Participation, Dropout Rate, Student Attendance,
Teacher Retention and School Size (Third analysis with the 2016–2017 year
included) ... 110 Table 37. Regression Results: Criterion Variable —AP/IB Participation (Third Analysis
with the 2016–2017 year included) ... 112 Table 38. Correlations between Percent AP/IB Benchmark Achieved, Dropout Rate,
Student Attendance, Teacher Retention and School Size (Third analysis with the 2016–2017 year included)... 113 Table 39. Regression Results: Criterion variable—Percent AP/IB Benchmark Achieved
xi
List of Figures
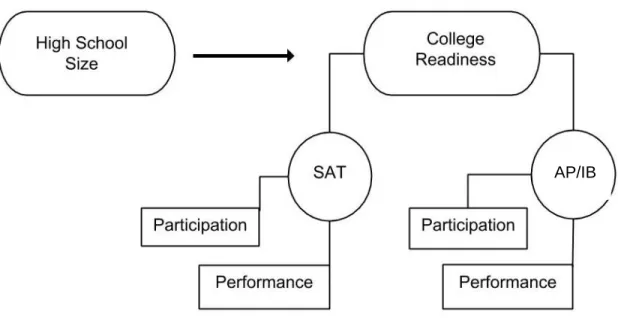
Figure 1. Independent versus dependent variables. ... 60
Figure 2. Controlled student characteristic variables ... 61
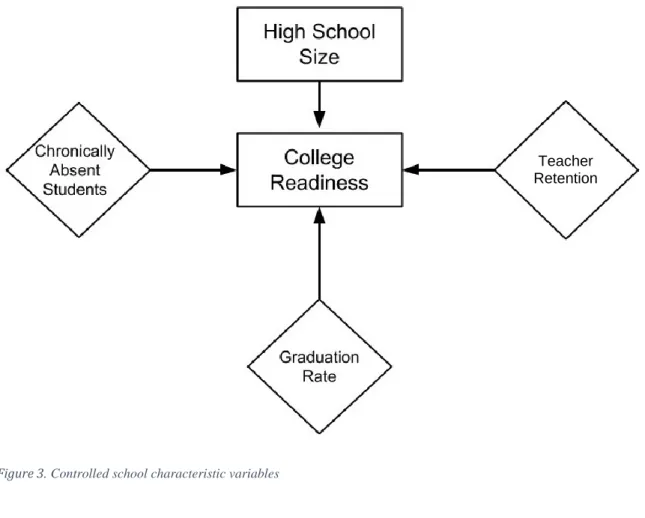
Figure 3. Controlled school characteristic variables ... 62
Figure 4. Controlled significant student and school characteristics. ... 63
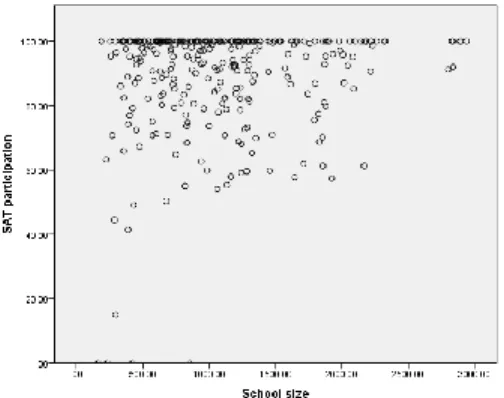
Figure 5. The relationship between the 2014-15 School Size and SAT Participation .... 136
Figure 6. Normal P-P plot of 2014-15 SAT Participation Regression Standardized Residual... 136
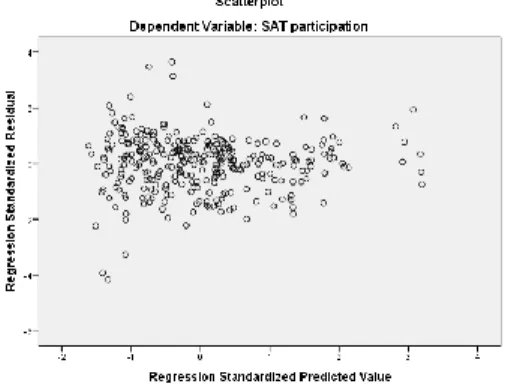
Figure 7. 2014-15 SAT Participation Homoscedasticity ... 137
Figure 8. The relationship between the 2015-16 School Size and SAT participation .... 138
Figure 9. Normal P-P plot of 2015-16 SAT Participation Regression Standardized Residual... 138
Figure 10. 2015-16 SAT Participation Homoscedasticity ... 139
Figure 11. The relationship between the 2016-17 School Size and SAT participation .. 140
Figure 12. Normal P-P plot of 2016-17 SAT Participation Regression Standardized Residual... 141
Figure 13. 2016-17 SAT Participation Homoscedasticity ... 141
Figure 14. The relationship between the 2014-15 School Size and SAT Performance .. 142
Figure 15. Normal P-P plot of 2014-15 SAT Performance Regression Standardized Residual... 143
Figure 16. 2014-15 SAT Performance Homoscedasticity ... 144
Figure 17. The relationship between the 2015-16 School Size and SAT Performance .. 145
Figure 18. Normal P-P plot of 2015-16 SAT Performance Regression Standardized Residual... 146
Figure 19. 2015-16 SAT Performance Homoscedasticity ... 146
Figure 20. The relationship between the 2016-17 School Size and SAT Performance .. 147
Figure 21. Normal P-P plot of 2016-17 SAT Performance Regression Standardized Residual... 148
Figure 22. 2016-17 SAT Performance Homoscedasticity ... 148
Figure 23. The relationship between the 2014–15 School Size and Percent SAT Benchmark Achieved ... 150
Figure 24. 2014–15 Percent SAT Benchmark Achieved Homoscedasticity ... 151
Figure 25. The relationship between the 2015-16 School Size and Percent SAT Benchmark Achieved ... 152
Figure 26. Normal P-P plot of 2015-16 Percent SAT Benchmark Achieved Regression Standardized Residual ... 153
Figure 27. 2015-16 Percent SAT Benchmark Achieved Homoscedasticity ... 153
Figure 28. The relationship between the 2016-17 School Size and Percent SAT Benchmark Achieved ... 154
Figure 29. Normal P-P plot of 2016-17 Percent SAT Benchmark Achieved Regression Standardized Residual ... 155
Figure 30. 2016-17 Percent SAT Benchmark Achieved Homoscedasticity ... 155
Figure 31. The relationship between the 2014-15 School Size and AP/IB Participation 157 Figure 32. Normal P-P plot of 2014-15AP/IB Participation Regression Standardized Residual... 157
xii
Figure 33. 2014-15 AP/IB Participation Homoscedasticity ... 158 Figure 34. The relationship between the 2015-16 School Size and AP/IB Participation 159 Figure 35. Normal P-P plot of 2015-16 AP/IB Participation Regression Standardized
Residual... 160 Figure 36. 2015-16AP/IB Participation Homoscedasticity ... 160 Figure 37. The relationship between the 2016-17 School Size and AP/IB Participation 161 Figure 38. Normal P-P plot of 2016-17AP/IB Participation Regression Standardized
Residual... 162 Figure 39. 2016-17 AP/IB Participation Homoscedasticity ... 162 Figure 40. The relationship between the 2014-15 School Size and Percent AP/IB
Benchmark Achieved ... 164 Figure 41. Normal P-P plot of 2014–15 Percent AP/IB Benchmark Achieved Regression
Standardized Residual ... 164 Figure 42. 2014-15 Percent AP/IB Benchmark Achieved Homoscedasticity ... 165 Figure 43. The relationship between the 2015-16 School Size and Percent AP/IB
Benchmark Achieved ... 166 Figure 44. Normal P-P plot of 2015-16Percent AP/IB Benchmark Achieved Regression
Standardized Residual ... 167 Figure 45. 2015-16 Percent AP/IB Benchmark Achieved Homoscedasticity ... 167 Figure 46. The relationship between the 2016-17 School Size and Percent AP/IB
Benchmark Achieved ... 168 Figure 47. Normal P-P plot of 2016-17 Percent AP/IB Benchmark Achieved Regression
Standardized Residual ... 169 Figure 48. 2016-17 Percent AP/IB Benchmark Achieved Homoscedasticity ... 169
1
Chapter I
INTRODUCTION
Background
Since 1918, both the concept and function of secondary education in the United States has been a subject of study (National Education Association of the United States, 1918). This field has involved studying the role of education in a democracy and ensuring that public education is organized to facilitate growth. Secondary education in particular should aim to facilitate productive growth and to enable students to pursue higher education if desired (National Education Association of the United States, 1918).
The American public education system of the 21st century was established to propagate the country’s democracy and to nurture future generations to exemplify the best of its political ideals. New Jersey’s public education system aligns with the mission set forth by the United States Department of Education (USDOE) and aspires to ensure that all children, regardless of their background or socio-economic status, graduate from high school ready for success in life, including post-secondary educational pursuits and the workforce (Education Transformation Task Force Initial Report, 2011, p. 3). To support these goals, districts in New Jersey spent, on average, $15,968 per pupil during the 2010– 2011 school year compared to a national average of $10,560 per pupil (US Department of Commerce 2013) and is subsequently ranked as one of the five highest ranking states in graduation rates (Aud & Hannes, 2011, p.216).
In New Jersey, a large percentage of students that graduate from its public schools are inadequately prepared for the academic rigors of college. In fact, a report by the
2
National Center for Higher Education Management Systems (NCHEMS, 2010) states that while 88.6% of ninth graders graduate high school in New Jersey within four years, only 60.8 % of these students enroll in college. The report by NCHEMS (2010), also found that only 25.7 % of the graduates manage to get a college degree. Additionally, one third of these students who enrolled in state colleges and universities required remedial classes in order to bridge the gap between high school and college (NJDOE, 2012; Education Transformation Task Force Initial Report, 2011, p.3). Of the New Jersey SAT participants from the class of 2013, only 46.1% met the SAT College and Career Readiness benchmark (College Board, 2014). This benchmark is associated with a 65% probability of obtaining a first-year college grade point average of B- or higher. For the State’s African American and Hispanic students, the percentage of achievement was much lower; only 16.5% African American and 23.8% Hispanic SAT takers from the class of 2013 met this benchmark. According to the College Board, similar trends can be observed nationally; only 42.6% of SAT takers from the same sample nationally was able to meet the college and career readiness benchmark, a figure that has remained relatively unchanged for quite some time (College Board, 2014).
According to the National Center for Public Policy and Higher Education & The Southern Regional Education Board (2010), there is a disparity between those who are college-eligible, which is defined as having earned a high school diploma, and those who are actually college-ready, meaning they are capable of succeeding in credit-bearing courses without the need for remediation. In 2007–2008, approximately 36% of first year students reported having to take a remedial course. This percentage was higher for African American and Hispanic undergraduate students, standing at 45% and 43% respectively
3
compared to 31% of White undergraduate students (The Condition of Education, 2011, p. 70).
One key issue in this disparity is the capacity of the schools in terms of their size or number of pupils. Keisling (1968) did a study of elementary schools in New York State and found a negative relationship between achievement tests and school size. In a 1972 study, Chambers concluded that a large school size possibly has a negative impact on the achievement and on the affective outcomes of student participation and satisfaction. Summers and Wolfe (1976) examined the school resources that may influence academic achievement. Summers and Wolfe (1976) also found that students’ socio-economic backgrounds largely determined their achievement. However, they was also found that learning increased in smaller elementary and high schools. Black elementary students seem to particularly benefit from being in smaller schools and low achievers also benefit from being in smaller senior high schools. Another study reporting an inverse relationship between school size and academic achievement was conducted in Indiana (Kuzienko, 2006). This study provides a methodologically sophisticated example of current research about the effects of elementary school size on both achievement in math and language arts, as well as average daily attendance.
The concept of school attachment or a student’s sense of belonging to his or her school community has been investigated across the fields of health, education, psychology and sociology under a variety of terms, including school bonding, school climate, teacher support and student engagement (McNeely, 2002; Blum & Libbey, 2004). An examination of the research literature across these fields revealed school connectedness is achieved when students experience high academic expectations and rigor with strong academic
4
support, physically and emotionally safe school environments and positive and respectful student-adult relationships (Blum, 2005). The Committee on Increasing High School Students’ Engagement and Motivation to Learn (2004) recommended the size of large comprehensive urban high schools be restructured to create smaller learning communities that foster close personal relationships and a sense of community between adults and students, and that promote students’ school connectedness.
According to Measuring Up 2004, the state-by-state report card on higher education, the timely completion of certificates and degrees remains one of the weakest aspects of performance in higher education (p. 9). While college enrollment has more than doubled since 1970, the completion rate of those enrolled has not demonstrated the same growth. In fact, of the first-time students who were enrolled in a 4-year institution full time in the fall of 2002 to pursue a bachelor’s degree, or its equivalent, only 57% achieved their goal within six years compared to 55% of an analogous cohort of students who sought the same in the fall of 1996 and earned their degrees within six years (The Condition of Education, 2011, p. 73–173).
A more educated workforce increases tax revenue and economic activity, reduces expenses for social services, improves savings for public health and recreational resources, and enhances civic responsibility and volunteerism (National Center for Public Policy and Higher Education, 2004). Able and Deitz (2014) determined that workers with an associate degree earned, on average, 21% more than those workers who had only earned a high school diploma over a four-decade period. For those workers with a bachelor’s degree, the average difference was 56% more than those with only a high school diploma over the same four-decades (p. 2–3).
5
According to Ruby K. Payne (2013), intellectual capital, which is defined as the ability to take existing information and turn it into useful knowledge and tools, has become the economic currency of the 21st century (p. 184). As more and more skilled labor is
needed because of the advent of this knowledge-based global economy, the American educational system has to ensure that the market need for skilled workers is met (Bernark, 2007; Hunt & Tierney, 2006). Between 1998 and 2008, there was a decrease of over 600,000 jobs that were formerly available to those with a high school diploma. During the same time period, over 10 million jobs were created for people who had obtained a college or technical degree (Bureau of Labor Statistics, 2013). A college education can no longer be an opportunity reserved for the privileged, as it has now become a basic economic necessity (Century, 2007).
Educational leaders, policy makers and researchers are seeking ways to bridge the gap between the college-eligible and the college-ready students while working within the confines of budget shortfalls and the growing demands for fiscal efficiency (McDonough, 2004). Various states, including New Jersey, are considering school size among the educational reforms that they are considering to improve public education. Recommendations stemming from prior research (e.g. Coleman, 1966, Fowler & Walberg, 1991; Greenwald, et al., 1996) promote reducing enrollment in large high schools in order to promote increased student learning (Conley, 2005; Chopin, 2003; Kuo, 2010; Schwartz, Stiefel & Chellman, 2008), but there have been no studies investigating how these outcomes align with students’ academic preparedness for college in the state of New Jersey.
6
Statement of the Problem
The American education system, as a whole, struggles to provide quality education to students and to prepare them for the highly competitive global market while being constrained by budget cuts and insufficient funding (Guilfoyle, 2009). As a result of budgetary shortfalls, many states have again renewed conversations regarding the closing and consolidation of schools due to either the reported underutilization of the schools or the failure of the schools to meet accountability measures; these decisions impact school size. There is evidence to suggest that smaller class sizes can boost achievement. For example, a study by Fowler & Walberg (1991) studies 293 public secondary schools in New Jersey and concludes that irrespective of socio-economic characteristics and grade levels, smaller schools and smaller school districts generate better educational outcomes. However, small class sizes are difficult to sustain when schools are cutting teaching positions at the same time that enrollments are increasing (Oliff, P. & Leachman, M., 2011).
This problem is compounded by a decrease in fiscal aid. For example, in 2018, a combined $32 million aid reduction was implemented in New Jersey. In fact, even 19 districts that are not spending sufficient amounts as per state guidelines are suffering from financial cuts, putting them at a particular disadvantage (Clark, A. & Rizzo, O., 2018). The recession in 2008–2009 had a statistically significant adverse effect on New Jersey school district funding. Since then, the percentage gap between per pupil funding and per pupil expenditure has grown from 13% in 2010 to 21% in 2012 (Chakrabarti, & Livingston, 2013). New Jersey, previously one of the balanced states, now falls $2,619 below its 2007 funding level. As a result, expenditure cuts were made across the board. Whereas districts had previously avoided cutting instructional expenditure, in 2011 and 2012 instructional
7
spending fell sharply as the pressure on school funding increased (Chakrabarti, & Livingston, 2013).
The effects of school closures and consolidations are often compounded by the fact that they are more likely to affect communities that are already disadvantaged. The Chicago Public Schools planned to close 54 schools for the 2013–2014 school year because of a $1 billion education budget deficient. The majority of students (88%) in the closed schools were Black students and approximately another 10% were Latino. Most students (95%) were receiving free or reduced-price lunch and 17% were classified as diverse learners (Gordon, M. F. et. al., 2018). Caref et. al. (2012) highlights that, of the students who lost their school, 88% were African American and 94% were from low income households. While data specific to New Jersey is not available, similar concerns were also raised regarding closures in New Jersey (Weber & Baker, 2014). Understanding the effect of school size can help aid educators and decision makers in formulating policies that are likely to improve college readiness.
Purpose of Study
The purpose of this non-experimental, quantitative, multi-year study was to investigate the relationship between high school size in New Jersey and the college readiness indicators as defined by the New Jersey Department of Education (NJDOE) for school years 2014–2015, 2015–2016 and 2016–2017. The NJDOE recognizes that high school students demonstrate college readiness behaviors prior to their graduation from high school. This includes taking college entrance exams and participating in rigorous coursework such as Advanced Placement (AP) or International Baccalaureate (IB) classes.
8
Research Questions
This study sought to determine the extent to which high school size impacts the college readiness of public students in the state of New Jersey. To do so, the following research questions were examined for three consecutive school years (i.e. 2014–2015, 2015–2016 and 2016–2017):
1. What is the effect of school size on college readiness of New Jersey public schools students when readiness is indicated by student participation and performance on the SAT and Advanced Placement (AP) or International Baccalaureate (IB) courses and exams?
2. How is the effect of school size on college readiness influenced by the school factors of student attendance, teacher retention and dropout rate?
Hypotheses
An analysis of the following hypotheses was conducted for each of the three school years examined in this study:
1. A statistically significant difference in the participation and performance of New Jersey public school students on the SAT or AP/IB courses and exams will be present as a function of high school size and college readiness.
2. A statistically significant relationship of high school size on college readiness will be present as influenced by the school factors of student attendance, teacher retention and dropout rate.
Null Hypotheses
An analysis of the following null hypotheses was conducted for each of the three school years examined in this study:
9
1. A statistically significant difference in the participation and performance of New Jersey public school students on the SAT or AP/IB courses and exams will not be present as a function of high school size and college readiness.
2. A statistically significant relationship of high school size on college readiness will not be present as influenced by school factors of student attendance, teacher retention and dropout rate.
Design and Methodology
This quantitative, causal-comparative study utilized annually published data from the NJDOE’s website representing the 2014–2015 through 2016–2017 school years and published during the 2015–2017 school years. This type of design was appropriate since I examined how a number of variables related to a major complex variable and to what degree this relationship existed (Gay, Mills, & Airasian, 2012). This design allowed me to predict the influence of the variables on the major complex variable.
The sample for this study consisted of 314 New Jersey public high schools excluding magnet, charter, alternative and vocational schools. All data representing each of the 314 schools were utilized in a multiple regression analysis and a hierarchical regression analysis.
Challenges surfaced in my examination of the extant literature on school size as a result of ambiguous labels of “large” and “small” being applied to the same size school by different researchers. In an effort to avoid misinterpretation of my study, I chose to avoid these terms all together when referring to school size and discussed my findings strictly in terms of the actual enrollment sizes of the schools using the range proposed by Lee and
10
Smith (1997), specifically enrollment of 600 students or less, 601–1,000 students, 1001– 1,500 students and enrollment of over 1,500 students.
Conceptual and Theoretical Framework
Two theoretical frameworks provided the foundation for the conceptual framework of this investigation. The theories related to economies of scale and school connectedness were used to understand the connection between school size and the post-secondary preparedness of high school students in this study.
Economies of Scale
Economies of scale exist when the unit cost of producing a particular good or service is inversely related to the size of the organization or facility producing it (i.e. the larger an organization is, the lower the cost to make a given product or deliver a given service). Conversely, diseconomies of scale exist when the cost of unit production increases with larger size. Fox (1981) summarized our earliest evidence of economics of size in schools and districts and identifies that economies of scale exist over ranges of enrollment. For urban high schools the general cost-minimizing size was said to be in excess of 1,500 students. In rural schools the cost-minimizing size was smaller.
School Connectedness
Blum (2005) defined school connectedness as a student’s belief that the adults in their school care about their learning and individual well-being. The Center for Disease Control and Prevention (2009) expanded this definition to include the influence of peers on students’ feelings of being connected to their school. According to research, when students feel connected to school, they are less likely to engage in delinquent behavior like
11
substance abuse and violence (McNeely, 2002; Blum, 2004), while concurrently demonstrating higher levels of academic success, school persistence, extracurricular participation and better attendance than their peers who report feeling less connected (Cotton, 2001).
Blum (2005) focuses on the advantages of a smaller school’s size such as connectedness, better safety and a more positive environment. Fox (1981) studies how having a larger school size can be beneficial in terms of cost of education, better management, specialization and similar concerns. This study combines aspects of the studies by Fox (1981) and Blum (2005) to develop a holistic understanding of school size and its effect on readiness.
Significance of Study
Research conducted prior to this study has garnered preliminary data regarding the impact of school size on various school and student characteristics and outcomes. Predominantly established in 2000, under the funding support of the Bill & Melinda Gates Foundation, the effectiveness of small schools to enhance the educational outcomes for students has received mixed reviews (Camera, 2017). This study provides policymakers, practitioners and researchers with information regarding the impact of school size on students’ college readiness.
Limitations
This study tries to identify and understand the relationship between school size and readiness using the theoretical frameworks provided by school connectedness and economies of scale. According to Gay et al. (2012), as this is a causal-comparative study, other interpretations for the findings must be considered (Gay et al, 2012, p.229). There
12
may be other factors that are influencing the results. The groups of causal-comparative research samples are naturally formed before the initiation of this research. Another limitation of the study is that the sample groups may not be similar, as the subjects of the study may differ along some other variable not taken into consideration in this study (Gay et. al., 2012, p.232).
In 2010, the New Jersey State Board of Education abandoned the Core Curriculum Content Standards (CCCS), replacing them with the Common Core State Standards (CCSS), which were designed to provide practitioners with grade-level expectations from kindergarten through high school about what students should know and be able to do in the areas of English Language Arts (ELA) and mathematics. Unlike the NJSBE’s CCCS, CCSS were specifically authored to target what students needed to know in order to be successful in college and in their careers (Muller & Bowman, 2014). This study did not take into consideration the effect these new standards had on student performance on the defined College and Career Readiness Indicators.
Readiness is a complicated quality to measure, so college entrance tests such as the SAT were used as a metric. It was acknowledged in this study that college readiness and career readiness were not solely functions of academic scores. However, a detailed exploration on how non-academic parameters, like engagement in extracurricular activities, affect readiness was beyond the scope of this research. Additionally, this study did not take the socioeconomic conditions of the schools or students into account. Essentially, a student from a socially or economically disadvantaged family is treated as equal to one from a family that does not have such constraints. Furthermore, this study does not account for the effects of urbanization. It was assumed that since the data was
13
from the same region, any such anomalies were evened out. Since academic excellence is a significant factor in determining readiness, it is assumed that these scores effectively reflected student readiness.
The unavailability of certain data points also posed a limitation. For example, teacher retention data was only available for 2016–17 year. Additionally, there were specific changes to the SAT exams in 2016, so that the test assessed reading and writing skills in a combined section. As a result, SAT performance data for the SAT mathematics exams alone were available for all three consecutive years. This caused some discrepancy between data from 2014–15 and the other two years. Specifically, while SAT exams reported a single benchmark before 2016 including areas such as mathematics, reading and writing, after 2016 there were individual benchmarks for each subject area. However, since the aim of this study was merely to assess how often the benchmarks were achieved, each year was analyzed using the corresponding benchmark, specifically for 2014–2015 school year the benchmark of 1550 was used, and for 2015–2016 and 2016–2017 school years the math benchmark of 530 was used.
Lastly, this study did not seek to take into account the differences that exist within schools of different sizes, including curriculum and instructional practices; the type, quality, or quantity of AP or IB classes offered to students; or the impact of the organization of faculty, administration, or students. This study did not distinguish between large schools housing schools within schools, or the differences in how small schools were created and organized (i.e. small by design versus small by default).
14
Delimitations
This study was restricted to comprehensive public high schools with grade configurations of 9–12 in the state of New Jersey. Private, charter, alternative, parochial, faith-based and vocational schools were not included in this study because of their unique characteristics. Additionally, this study only investigates the effects of school size on high school education. It is likely that school size in all grades may have some influence on college readiness. However, given the scope of this work, only high schools were considered.
The data used in this study was retrieved from the 2015 through 2017 NJDOE School Performance Reports for all public high schools within the state. The school size and the college and career readiness indicators drawn from the NJDOE school performance reports are the primary data sources. All data pertained to the 2014–2015, 2015–2016 and 2016–2017 school years. It should also be noted that readiness was measured using the dropout rate, and not the graduation rate, since any student who remains in school will eventually graduate. Therefore, the student dropout rate provides a valid indicator of the number of students who do not graduate and, therefore, are not ready. The New Jersey Department of Education defines a dropout as a student who “has terminated his or her education before graduation or when a district cannot verify that the student is pursuing an education toward a regular diploma in another educational location” and the dropout rate is a percentage of dropouts in a class (NJDOE, 2017a). For the purposes of this study, the dropout rate is used for calculations.
15
Definition of Terms
1. Advanced Placement (AP)/International Baccalaureate (IB) results refer to the results of the College Board’s Advanced Placement examinations and the International Baccalaureate Diploma Program examinations taken by New Jersey public high school students. These students may take one or more of these examinations and may receive advanced placement or credit, or both, upon entering college (NJDOE, 2017c)
2. College and career eligible is the fulfillment of state established criteria to earn a high school diploma (Conley, 2010).
3. College and career readiness is the level of preparation a student needs to enroll and succeed without remediation in a credit bearing, general education course in a postsecondary program that offers a certificate, associate degree, or baccalaureate without requiring remediation (Conley, 2007).
4. Chronic absenteeism is calculated by taking the number of chronically absent students, those that have missed 10% or more days of school and dividing that number by the total number of students enrolled at the school or district. (NJDOE, 2017c)
5. Dropout rate is the percentage of students that withdrawal from school prior to attaining their high school diploma (NJDOE, 2017a).
6. Economies of Scale exist when the unit cost of producing a particular good or service is inversely related to the size of the organization or facility producing it (Fox, 1981).
16
7. High School for the purpose of this study refers to public schools, grades 9-12, excluding private, magnet, charter, alternative, parochial, faith-based and vocational schools.
8. New Jersey performance report is a report produced annually by the New Jersey Department of Education communicating numerous school-based variables, including enrollment size, attendance, dropout rate, annual teacher retention, SAT performance and the like (NJDOE, 2017d).
9. SAT scores refer to the performance results that contain the information provided by the College Board’s SAT examination (Dorans, 1999).
10. School connectedness is defined as a student’s belief that adults and their peers in the school care about their learning and individual well-being (CDC, 2009).
Organization of Study
Chapter 1 of this study presents a brief review of the of role public education in the United States and an overview of the problems with the discrepancy between students that are college-eligible versus college-ready and its relationship to school size. Chapter 2 presents a review of the literature pertaining to school size and college readiness. An examination of extant literature on the history of school size related to economic, sociological and achievement studies was presented, as well as a review of the definitions of college readiness, existing preparation programs and student indicators of college readiness. Chapter 3 details the design methods and procedures for this study. Data was collected from the NJ School Performance Report. In Chapter 4 the data and statistical findings that emerged from this study were presented. Chapter 5 contains a statistical summary of this study and its findings, conclusions drawn from the findings, a discussion
17
of the implications and recommendations for educational policies and practice moving forward. The conclusion of the study is based on the research question: What is the strength and direction of the relationship between high school size and the college readiness indicators as reported on the New Jersey School Performance Report?
18
Chapter II
REVIEW OF THE LITERATURE
Introduction
During the 1930s, as America grappled with the economic hardships of the Great Depression, there were approximately 260,000 public schools in the United States that served 26 million students. A decade later, as America emerged slowly out of the depression, the number of public schools decreased to 220,000 schools. This was largely because the Great Depression made it necessary to minimize school expenditures, especially with regards to construction and the salaries of employees (Hendrick, 1972). Additionally, at the time, smaller schools often did not have enough pupils to organize into grade levels. Larger schools allowed for this possibility. This, in turn, resulted in teachers becoming more specialized in teaching different grade levels and subjects (Cubberley, 1922). After the Depression, this trend continued as both schools and school districts continued to be consolidated.
By 2011, the number of public schools in the country dwindled to 98,000 schools that had the charge of educating 48 million students (National Center for Education Statistics, 1993; 2014). Proponents of the school consolidation movement advocated for this change by suggesting that schools would be more efficient and effective if they were larger. Specifically, they argued that “single plants housing 500–2,000 students presumably could offer greater variety in subject matter, would provide teachers with the opportunity to track their students according to ability, and might put less strain on community resources” (Wasley & Fine, 2000). Larger schools could have better infrastructure, improved facilities, more experienced faculties, superior administrators and
19
could offer greater diversity in curricular and extra-curricular opportunities (Conant, 1959). While the Great Depression resulted in profound consequences for American schools, most significantly so during the early 1930s, the struggles of this time also served as the catalyst for modernizing public education and also standardizing it as a profession (Baughman, et al., 2001).
The 21st century finds many states across America and their school districts
struggling to overcome budget shortfalls and significant funding constraints despite counter demands to prepare even more students for future success in a now globally competitive market. As a result, the fiscal retrenchment of the 1930s has returned and statesmen, district administrators and the like have reengaged in conversations to increase the efficiency and effectiveness of schools through consolidation, specifically the elimination of schools and school districts; these decisions impact school size.
It has also been argued that this increase in school size, while economically enticing, may harm students and limit their achievements. Poor student performance has been linked to increased size of schools and school districts (Berry & West, 2008), which, over time, has led to serious consequences. The failure of students to complete college creates economic consequences for taxpayers and society as a whole (Belfield, 2008). A more educated workforce increases tax revenue and economic activity, reduces expenses for social services, improves savings for public health and recreational resources, and enhances civic responsibility and volunteerism (National Center for Public Policy and Higher Education, 2004). Given the serious repercussions that can result from the lack of readiness, the study presented here sought to explore the role of school size in various
20
performance parameters to understand the effect of school size on college and career readiness.
The purpose of this non-experimental, quantitative, multi-year study is to investigate of the effect of high school size on the college and career readiness indicators as defined by the New Jersey Department of Education (NJDOE) between the 2014–2015 and 2016–2017 school years. This review of literature is comprised of the following sections: the history of school size and consolidation; the effects that school size has on course offerings, attendance, teacher retention, student outcomes, dropout rate and college readiness; theoretical frameworks, synthesis; and the conclusion.
The purpose for the review is to identify studies that attempted to determine the significance of the school variable of school size and student variables of college readiness. The desire is to inform policymakers, government officials, educational leaders and researchers of the influences that school size has on students’ preparedness for postsecondary pursuits.
Literature Search Procedures
Searches were conducted to identify robust, relevant literature on each variable in this study. The literature reviewed for this study came from a variety of texts, government reports and academic articles obtained from EBSCOhost, ERIC, JSTOR, Sage, the Census Bureau, the United States Department of Education (USDOE) website and the New Jersey Department of Education’s (NJDOE) website. From the NJDOE website, New Jersey Performance Report data were examined to review the variables that were used in this study. Other data from the NJDOE website included school size, the percentage of students participating in the SAT, the percentage of students scoring 1550 or above on the SAT, the
21
percentage of students enrolled one or more AP or IB courses, the percentage of students that earned an AP Test score greater than or equal to 3 or IB Test score greater than or equal to 4 on at least one exam, and dropout rates. General intent-based searches were also conducted, utilizing Google Scholar.
Keywords used in the study included American Diploma Project, American public education, college preparedness, college readiness, district consolidation, dropout rate, economies of scale, graduation rate, high school size, history of school size, school connectedness, school consolidation, socioeconomic status, student achievement, student engagement and student outcomes.
Inclusion and Exclusion Criteria for Literature
In order to understand the effect of school size on college readiness, this work relied on available literature. However, in order to ensure reliability, only studies meeting certain criteria were contained in the review. Since this study was conducted on the public school system in the United States, only literature involving such schools were considered. Additionally, this literature review also used government reports, dissertations and peer-reviewed publications. The literature peer-reviewed here employed experimental, quasi-experimental, correlational, and meta-analysis designs to understand the effect of school size. When needed, federal and state legislation were used to provide background and contextual information. Also, as far as possible, literature older than 30 years has been employed solely to illustrate the beginnings of trends that later culminated in the present-day school system. All information used in this study strives to clarify and enhance the understanding of the problem of school size and its effect on readiness. A review of relevant literature is provided in the next section.
22
Existing Studies on the Effect of School Size on Student Outcomes
The effect of school size on such student outcomes like achievement and graduation rates have been of interest to parents, teachers, administrators and policymakers alike. The number of schools nationwide has decreased by 70% while the average school size has increased by a factor of five within the last 50 years (Nguyen, 2004). This nationwide trend of increased school size was the result of restructuring and consolidation initiatives. The impact of this restructuring and similar initiatives on student outcomes is now in question. Fowler and Walberg (1991) summarized the findings of school size effects of studies published between the 1960s and 1980s. Those in favor of the small school reform effort purport that student achievement in schools labeled as small is equal to, if not greater than, that of student achievement in schools labeled as large. The researchers examined the effect of high school size on educational outcomes while also taking into consideration district socioeconomic status and teacher qualifications. The outcomes examined included standardized test scores, retention rates, suspensions, employment and college enrollment. In their study, they found school size was one of the most significant factors effecting school outcomes. Their analysis revealed a negative relationship between school size and outcomes, which reinforced the studies cited in their research, which suggested that smaller schools may be more effective at improving students' educational outcomes (Fowler and Walberg, 1991).
Leithwood and Jantzi (2009) conducted a meta-analysis of 57 studies published after 1990 that observed the relationship between school size and various student and organizational outcomes. In their analysis, the majority of the evidence reflected favorably on smaller schools and found that students who typically struggle in school and students
23
from disadvantaged backgrounds benefit the most from enrollment in small schools. The study by Leithwood and Jantzi (2009) recommends that if a large proportion of an elementary school’s pupils is underprivileged, then school size should be limited to around 300 students. Similarly, schools catering to diverse groups of students should also be limited to less than 600 students. The recommended size for a high school is around 1000 students in area where diverse, socio-economically weaker students are present.
Howley and Bickel (1999) analyzed the correlation between the likelihood of academic excellence and the size of schools and school districts. Their research was carried out by formulating equations that allow test scores to be predicted from school size and socioeconomic status. The study ultimately related the size of the school to academic excellence and equity. It was seen that in poorer communities, smaller schools produce better results. The correlation between small school size and academic performance was so significant that it was seen to negate the effect of poverty by as much as 70%. Equity was also better in smaller schools in all states studied. However, the effect of district size was much weaker. Howley and Bickel’s study (1999) recommends policy options such as recommending upper limits to school size, rescaling the school system, and exploring the relationship between district size and school size in greater detail.
Werblow and Duesbery (2009) studied how the size of a school relates to performance of students in mathematics and dropout rates. The two research questions centered on whether smaller school sizes result in better performance in mathematics or lower dropout rates. No rationale is given for choosing mathematics as the subject for study. However, the studies cited by the researchers indicate that by concentrating on a single, easily quantifiable and objective subject, it may be possible to obtain more precise
24
results. A total of 16,081 students who took ELS (10th Standard) exams in 2002 were
chosen for the study. These students came from 752 US schools. This study used school size as the independent variable and employed six control variables employed, including ethnicity, socioeconomic status and gender. Interestingly, this study reports a nonlinear relationship between mathematics learning and school size, with both small and large schools outperforming medium sized ones. Werblow and Duesbery (2009) also note that dropout rates were better controlled by smaller schools.
School size has also been linked to student attendance. Using data from Texas schools Jones, Toma, & Zimmer (2008) develop a model linking school size and student attendance. This extensive study employs data from all public schools in Texas for 9 years, between 1993 and 2001. The study clearly illustrates that attendance is inversely related to class size, school size and school district size. Essentially, students were much more likely to attend classes in smaller schools with small class sizes. The results presented by Jones, Toma, & Zimmer (2008), though limited to a single state, are data intense and highlight the importance of smaller school sizes.
Using data from 2006 for North Carolina, Nelson (2008) establishes a link between school size and annual teacher attrition rate. This study identified that as the size of the school increased, the number of teachers who left the school increased simultaneously. Additionally, the study noted that as school size increased, class sizes also became unmanageable, lowering teachers’ job satisfaction. Therefore, increased school size is likely to lower job satisfaction and student performance, leading to low job satisfaction among teachers, which in turn can lead to low teacher retention.
25
From a brief survey of literature, it is clear that school size affects multiple parameters related to college and job readiness. These include factors like school attendance, performance of students and dropout rates. Before understanding the relationship between school size and college readiness, it is essential to explore existing literature in this field in order to develop a better understanding on how the various factors that may affect readiness are influenced by school size. The rest of this chapter primarily explores the necessary literature that links school size to dropout rates, achievement, teacher turnover, student attendance, etc. Additionally, the review will also explore the history of consolidation movement in the United States. This includes understanding the motivation and societal factors that facilitated the movement and the current direction of public school management in United States. This exploration of consolidation is aimed at giving context to the present study. However, before proceeding, it is essential to briefly discuss the focus and limitations of this literature review.
Focus of the Review
The literature review presented here focuses on the effect of high school size on college and career readiness. Since readiness cannot be measured directly, this review explores various metrics constituting readiness such as student dropout rate and teacher retention. It is hoped that these will help ascertain student readiness as the field develops. These metrics are already identified as factors influencing readiness. For example, Subedi and Powell (2016) identify student outcome and retention as factors affecting college readiness. Similarly, Rodriguez, (2009) states that high teacher turnover can have an adverse effect on readiness of students. The effect of course offerings and extracurricular participation on readiness is also well known (Greene & Forster, 2003). It is therefore
26
possible to study these parameters and understand the effect of school size on readiness. Therefore, given the lack of literature on the effect of school size on readiness, the logical approach is to study the effect of school readiness on these parameters.
Since the focus of this study is on public high schools in New Jersey schools, metrics such as annual school performance reports, SAT scores and student performance on various tests are used to measure readiness. Such objective metrics are chosen as they provide a quantifiable method for measuring readiness. Additionally, both college and career readiness are, to a great extent, dependent on academic performance.
Advance Placement (AP) exam scores, for example, have been linked to the likelihood of college enrollment by Chajewski, Mattern and Shaw (2011). In fact, using a national sample of 1.5 million students, these researchers reported that students who took AP classes and attended exams were 171% more likely to pursue a college degree than their peers. Dodd, Fitzpatrick, De Ayala and Jennings, (2002) report that of those who enter college, AP students were likely at least 10% more than their non-AP counterparts to attend college. Additionally, Keng and Dodd (2007) found that AP scores were a good predictor of college scores, especially in the corresponding subjects. Mattern, Marini, & Shaw (2013) related AP scores to student retention and found that students with AP scores were significantly more likely to graduate, even when accounting for other socioeconomic factors. For example, female students from minority ethnic groups with AP scores had a graduation rate of 41% while their counterparts had a lower graduation rate of 30%. Based on these studies, it is safe to assume that AP scores can be used to measure college readiness as they positively affect enrollment (Chajewski, Mattern, & Shaw, 2011), grades (Dodd,
27
Fitzpatrick, De Ayala, & Jennings, 2002) and graduation rates (Mattern, Marini, & Shaw, 2013).
Similarly, Conley et al., (2014) found that International Baccalaureate (IB) students are more likely to graduate college than their non-IB counterparts, since they find their post-secondary workload more manageable. Inkelas et al., (2013) reports that IB students were more prepared for college level courses than their counterparts, including those who took AP classes and earned high scores. Having an IB diploma clearly leads to better college readiness. In fact, Bergeron (2015) reports that 95% IB students enroll in 4-year university courses as opposed to 69% nationally in the US. Of these, IB students have a 79% college graduation rate compared to a national average of 39% (Bergeron, 2015).
Much like AP and IB exams, SAT scores can also be a valid indicator of college readiness. Kobrin (2007) linked SAT scores to college GPA and established that students with SAT score above 1180 were likely to obtain at least a B- in their first year of college, while those with a score lower than 800 were likely to get grades C or below. Studies (DeAngelo et al., 2011; Ober et al., 2018) also establish a positive correlation between SAT scores and college graduation rates.
This review focuses on the metrics employed by researchers such as SAT scores, AP Scores and IB scores to understand readiness and associated parameters. Efforts have been made to concentrate on US high schools. However, this review does have certain limitations as explained in the next section.
Limitations of the Review
The next section attempts to understand the current scientific understanding regarding the effect of school size on student readiness. However, the literature review
28
presented here is not without limitations. The studies make little distinction between urban and rural schools. Additionally, most of the literature presented does not directly address the question of college or career readiness. Since there is a lack of such literature, the review focuses on parameters that are likely to affect student readiness such as teacher retention, dropout rates, etc. The review also does not distinguish between students of various ethnic groups. Additionally, the effect of poverty and other socioeconomic indicators such as the crime propensity of the school neighborhood are not explored in detail.
Another point worth noting is that this review only considers five components of readiness (attendance, teacher turnover, dropout rate, student outcomes and course offerings) and their relation to school size. It is possible that readiness may be affected by other varied parameters as well. Occasionally, when literature is scarce, this review also relies on studies exploring the relationship between these parameters and elementary and middle school. Though this work concentrates on high school, it is assumed that the relationships in middle school will continue to hold good for high school as well. It should also be noted that readiness also has non-academic parameters such as participation in extracurricular activities. While the review does touch upon this topic, it is not investigated in detail. Such a study is beyond the scope of this thesis.
Despite these limitations, an attempt has been made to highlight the effect of school size on these parameters. Care has also been taken to ensure that studies that present opposing viewpoints are included whenever possible to highlight the complex effects school size and other characteristics can have on the parameters being presented.