Procedia - Social and Behavioral Sciences 199 ( 2015 ) 218 – 224
1877-0428 © 2015 The Authors. Published by Elsevier Ltd. This is an open access article under the CC BY-NC-ND license (http://creativecommons.org/licenses/by-nc-nd/4.0/).
Peer-review under responsibility of Hacettepe Üniversitesi. doi: 10.1016/j.sbspro.2015.07.509
ScienceDirect
GlobELT: An International Conference on Teaching and Learning English as an Additional
Language, Antalya - Turkey
The study of learning styles and its relationship with educational
achievement among Iranian high school students
Maria Rezaeinejad
a, Akbar Azizifar
a*, Habib Gowhary
aaEnglish Department, Ilam Branch, Islamic Azad University, Ilam, Iran
Abstract
Learning process has been one of the important aspects of human life. Student's learning styles are among the acquired factors. Based on their individual differences, different students use different learning styles for their learning. The main purpose of this study was to investigate the study of learning styles among high school students and its relationship with educational achievement. The statistical population under investigation included girl's high school students in the city of Ilam, Iran in the school year of 2014. The statistical population was consisted of 3958 students. The sample group was selected by the stratified random sampling method based on Morgan's table and through multiple-steps sampling. In order to assess the learning styles, the online questionnaire for learning styles, by Felder and Solomon is used. Collected data analyzed using SPSS software. According to correlation coefficients, among students in experiential field, there is a positive significant relationship between students learning styles who use Visual-Verbal learning style and their score means and among students in mathematics field, there is a positive significant relationship between students learning styles who use Active-Reflective and Visual-Verbal learning style and their score mean. In humanities field, there is no significant relationship between the students learning styles that use Sequential-Global, Visual-Verbal and Sensing- Intuitive learning styles and their score means. The Kruskal-Wallis test shown that there is a significant difference between humanities students score means with mathematics and experiential students that have Reflective learning style. There is a significant difference between score means of grade two students in all fields in Active-Reflective and Visual-Verbal learning styles and similarly in grade three students in all fields in Active-Active-Reflective and Sequential-Global learning styles.
© 2015 The Authors. Published by Elsevier Ltd.
Peer-review under responsibility of Hacettepe Universitesi. Keywords:Learning styles; Felder and Solomon; Educational Achievement
* Corresponding author. Tel: +989188430411;
E-mail Address: aazizifar2@gmail.com
© 2015 The Authors. Published by Elsevier Ltd. This is an open access article under the CC BY-NC-ND license (http://creativecommons.org/licenses/by-nc-nd/4.0/).
1. Introduction
Student's learning styles are among the acquired factors. Based on their individual differences, different students use different learning styles for their learning. Today, all theory-markers believe that individuals understand, organize, analyze, and process information and experiences in different ways. Despite all the different theories and models available in the field of learning styles. Learning styles are different between the two sexes. There is evidence that shows woman's learning style depends more on sympathy, collaboration and careful listening (Grasha, 1996). Learning styles theory suggests changing the traditional instructional methods to benefit from the individuals learning styles.
This study can complement the previous studies by its direct focus on the learning styles of students and its relationship with educational achievement. So it is designed to answer the following research questions:
1. What are the student's general educational characteristics? 2. What are the dominant students' learning styles?
2. Review of related literature
Today, thanks to a respectable stockpile of SLA research, there is a greater recognition of our need to gain a deeper understanding of our students, their learning differences, learning styles, learning difficulties and their predisposition to certain types of tasks to achieve their goals successfully (Pawlak, 2012). Moreover, there is a great deal of evidence that a mismatch between students’ learning styles and teacher’s instructional style may have a negative impact on classroom learning (Felder & Henriques, 1995; Mulalic, Mohd Shah & Ahmad, 2009). Iranian EFL learners are no exception to this rule; they are perhaps facing even more difficulties due to the mismatch between teaching and learning styles. Many Iranian teachers who are the product of a traditional educational system, do not seem to be aware of their students’ styles and just try to draw upon a limited number of teaching styles within their comfort zone. It should be noted that few studies have addressed the relationship between perceptual learning and teaching styles in Iran (e.g. Alemi, Daftari & Tobolcea, 2011; Azizi-Pajoh, 2007; Hayati, 2008).
2.1. Definition and concept of learning styles
Learning styles are seen as characteristic cognitive, affective, and psychological behaviors that serve as relatively stable indicators of how learners perceive, interact with, and respond to the learning environment. The concept of learning styles has been applied to a wide variety of student attributes and differences (Felder and Brent, 2005). Learning style refers to an individual’s habitual and preferred way of absorbing, processing and retaining new information and skills. According to Capretz (2006) each learning style has its own strengths and weaknesses and therefore a person who sticks to one style is never going to be an ideal learner (Moradkhan and Mirtaheri, 2011).
Language learning styles have attracted a great deal of attention and have been the focus of a number of L2 studies since Reid’s influential work in 1987. Reid (1995) categorized the learning styles into three major categories: sensory or perceptual learning style, cognitive learning style, and affective/temperament learning style. Sensory or perceptual learning style lends itself to the physical environment in which we learn, and involves using our senses in order to perceive data. Reid categorized perceptual learning styles into six major types: Visual (visual learners prefer seeing things in writing), Auditory (these learners learn best when they listen), Kinesthetic (these learners prefer active participation), Tactile (these learners prefer hands-on work), and Group (these learners like to participate in group activities), and Individual (these learners learn best when they are alone).
2.2. Dimensions of Felder and Solomon learning styles
The Index of Learning Styles (ILS) is a forty-four-item forced-choice instrument developed in 1991 by Richard Felder and Barbara Solomon to assess preferences on the four scales of the Felder-Silverman model.
Table 1. Dimensions of Learning and Teaching Styles
Preferred Learning Style Corresponding Teaching Style
Sensory perception intuitive Concrete content abstract
Visual input auditory Visual presentation verbal
Inductive organization deductive Inductive organization deductive
Active processing reflective Active student participation passive
Sequential understanding global Sequential perspective global
3. Methodology 3.1. Participants
The statistical population under investigation included female high school students in grade two and three in the city of Ilam, Iran in the school year of 2014. The statistical population was consisted of 3958 students. The sample group was selected from the high school students of the mentioned region by the stratified random sampling method based on Morgan's table. The research statistical sample included 360 students.
Table 2. Frequency distribution of population and sample based on field and grade of students Field
Grade
Humanities Mathematics Experiential Total N n N n N n N n
Two 142 13 847 77 1057 96 2046 186 Three 408 37 514 47 990 90 1912 174
Total 550 50 1361 124 2047 186 3958 360
3.2. Instrument
In order to assess the learning styles, the online learning styles questionnaire is used. The research instrument was the “Index of Learning Styles (I.L.S.)”, which is designed based on Felder and Solomon (1997) learning styles model. This questionnaire consists of 44 questions. The questions do not have cultural dependency and are selected keeping simplicity for responding in mind. This questionnaire is able to assess the four aspects of learning, consisting of eight learning styles as follows:
1. Processing aspect: Active-reflective learning styles 2. Perception aspect: Sensory-Intuitive learning styles 3. Input aspect: Visual-Verbal learning styles
4. Understanding aspect: Sequential-Global learning styles
The process of answering the questionnaire was done as a group. The students were informed about how to answer the questions on the questionnaire that had been translated in to Persian (Farsi) and they were asked to answer all questions carefully. The questionnaire is attached to this report as appendix.
3.3. Validity and reliability of instrument
To gain access to the desirable and generalizable data, an instrument must be valid and reliable. A test is valid when it measures what it is supposed to measure. A test is reliable when same questions, have same answers in different situations. In this study, validity and reliability of the tests were not conducted because the used instrument was standardized.
3.4. Procedure and data analysis
Collected data have been analyzed using SPSS win version 21. In differential section, correlation coefficients and nonparametric compare means tests will be reported.
By noting the conducted researches about the learning styles, the current research is a comparison of learning styles. This learning style comparison is between two groups of students (grade two and grade three) and among three groups of different majors. The research also investigates the relationship between learning styles and students' educational achievement and their major and grade.
4. Results and discussion 4.1. Differential statistics
4.1.1. Kruskal-Wallis test for grade two students in all fields
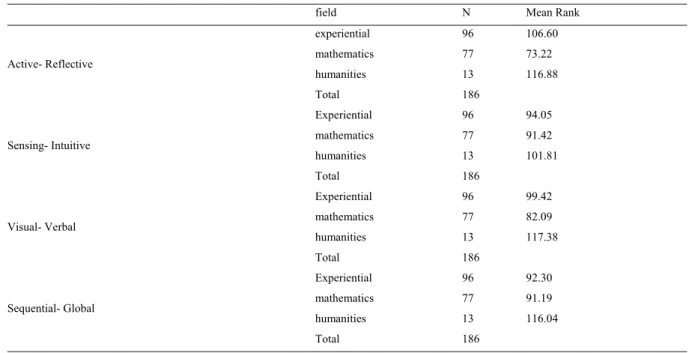
To compare students score means with different learning styles, the Kruskal-Wallis test have been used. The data and Chi-Square show there is a significant difference between score means of grade two students in all fields in Active- Reflective and Visual- Verbal learning styles.
On the other hand, according to mean ranks table, at the %99 significance level, it can be said that there is a significant difference between humanities students score means with mathematics and experiential students score means that have Active- Reflective learning style.
Table 3. Mean ranks in Kruskal-Wallis test for grade two students, in all fields
field N Mean Rank
Active- Reflective experiential 96 106.60 mathematics 77 73.22 humanities 13 116.88 Total 186 Sensing- Intuitive Experiential 96 94.05 mathematics 77 91.42 humanities 13 101.81 Total 186 Visual- Verbal Experiential 96 99.42 mathematics 77 82.09 humanities 13 117.38 Total 186 Sequential- Global Experiential 96 92.30 mathematics 77 91.19 humanities 13 116.04 Total 186
According to mean ranks table, at the %95 significance level, it can be said that there is a significant difference between humanities students score means with mathematics and experiential students score means that have Visual- Verbal learning style.
Table 4. Chi-Square test statistics for grade two students in all fields
Active-Reflective Sensing- Intuitive Visual- Verbal Sequential- Global Chi-Square 19.458 .447 7.417 2.592
df 2 2 2 2
Asymp. Sig. .000 .800 .025 .274
4.1.2. Kruskal-Wallis test for grade three students in all fields
To compare students score means with different learning styles, the Kruskal-Wallis test have been used. The data Chi-Square show there is a significant difference between score means of grade three students in all fields in Active- Reflective and Sequential- Global learning styles.
On the other hand, according to mean ranks table, at the %99 significance level, it can be said that there is a significant difference between humanities students score means with mathematics and experiential students score means that have Active- Reflective learning style.
Table 5. Mean ranks in Kruskal-Wallis test for grade three students, in all fields
field N Mean Rank
Active- Reflective Experiential 90 76.74 mathematics 47 81.60 humanities 37 121.16 Total 174 Sensing- Intuitive Experiential 90 91.55 mathematics 47 76.06 humanities 37 92.18 Total 174 Visual- Verbal Experiential 90 84.43 mathematics 47 83.11 humanities 37 100.54 Total 174 Sequential- Global Experiential 90 92.47 mathematics 47 95.68 humanities 37 65.03 Total 174
According to mean ranks table, at the %99 significance level, it can be said that there is a significant difference between humanities students score means with mathematics and experiential students score means that have Sequential- Global learning style.
Table 6. Chi-Square Test Statistics for grade three students, in all fields
Active- Reflective Sensing- Intuitive Visual- Verbal Sequential- Global Chi-Square 21.770 3.407 3.324 9.866
df 2 2 2 2
4.2. Correlation Coefficients
4.2.1. Correlation coefficients for all of students in experiential field
According to correlation coefficients table, at the %99 significance level, it can be said that there is a negative significant relationship between students learning styles who use Sequential-Global learning style and their score means (Sig.=.009 and Spearman's rho = -.191).
At the %95 significance level, it can be said that there is a positive significant relationship between students learning styles who use Visual- Verbal learning style and their score means (Sig.=.019 and Spearman's rho =.172).
The findings also show that there is no significant relationship between the students learning styles who use Active- Reflective and Sensing- Intuitive learning styles and their score means.
Table 7. Correlation coefficients for all of students in experiential field
Active- Reflective Sensing- Intuitive Visual- Verbal
Sequential- Global Correlation Coefficient .186 .125 .172* -.191**
Sig. (2-tailed) .061 .092 .019 .009
N 186 186 186 186
** Correlation is significant at the 0.01 level (2-tailed). * Correlation is significant at the 0.05 level (2-tailed).
4.2.2. Correlation coefficients for all of students in mathematics field
According to correlation coefficients table, at the %99 significance level, it can be said that there is a positive significant relationship between students learning styles who use Active- Reflective and Visual- Verbal learning style and their score means (in Active- Reflective: Sig.=.007 and Spearman's rho =.240) and (in Visual- Verbal: Sig.=.000 and Spearman's rho =.530)
The findings also show that there is no significant relationship between the students learning styles in mathematics field who use Sequential- Global and Sensing- Intuitive learning styles and their score means.
Table 8. Correlation coefficients for all of students in mathematics field
Active- Reflective Sensing- Intuitive Visual- Verbal
Sequential- Global Correlation Coefficient .240** .145 .530** -.033
Sig. (2-tailed) .007 .108 .000 .714
N 124 124 124 124
** Correlation is significant at the 0.01 level (2-tailed).
4.2.3. Correlation coefficients for all of students in humanities field
According to correlation coefficients table, at the %99 significance level, it can be said that there is a negative significant relationship between students learning styles who use Active- Reflective learning style and their score means (Sig.=.001 and Spearman's rho = -.457).
The findings also show that there is no significant relationship between the students learning styles that use Sequential- Global, Visual- Verbal and Sensing- Intuitive learning styles and their score means.
Table 9. Correlation coefficients for all of students in humanities field
Active- Reflective Sensing- Intuitive Visual- Verbal
Sequential- Global Correlation Coefficient -.457** .001 -.192 .053
Sig. (2-tailed) .001 .996 .182 .715
N 50 50 50 50
**. Correlation is significant at the 0.01 level (2-tailed). 5. Conclusion
The current research results show that there is a significant relationship between the learning styles and educational achievement. This result is similar to the results of other researches, like Mohammadzadeh and Izadi(2011), Moradkhan and Mirtaher(2011) and Najafi Kalyani et al ( 2010) which show relationship between learning styles and educational advancement. Najafi Kalyani et al (2010) showed that in investigating the relationship between learning styles by Meyers-Brigs and educational advancement, there is relationship between sensational-intuitive aspect and educational advancement. This was the only relationship from all four aspects of personality by Meyers-Brigz. The research results are different to some other researches such as Esfandabad and Emamipour( 2008) which show that there is no relationship between learning styles and educational achievement.
References
Alemi, M., Daftari, P., Tobolcea, I. (2011). Mismatches between learner's style and teacher's style in L2: A concern for communication. Journal of Language Teaching and Research, 2(2), 323-330.
Azizi Pajoh, SH. (2007). The association between learning style preferences of Iranian EFL learners and grammar learning (tenses), reading skills and level of proficiency. Unpublished master’s thesis, Azad University, Science & Research Branch, Tehran, Iran.
Capretz, L. F. (2006). Clues on software engineers’ learning styles. International Journal of Computing & Information Sciences. Retrieved from
www.//http.IJCIS.com.
Felder, R. M., Henriques, E. R. (1995). Learning and teaching styles in foreign and second language education. Foreign Language Annals, 28 (1), 21-31. Retrieved from http://onlinelibrary.wiley.com/doi/10.1111/j.1944-9720.1995.tb00767.x/abstract
Felder, R.M. Brent, Rebecca. (2009). Active Learning: an Introduction. ASQ Higher Education Brief, 2(4). Felder, R. M. Brent, Rebecca. (2005). Understanding Student Differences. Journal of Engineering Education.
Grasha, A. F. (1996). Teaching with style: A practical guide to enhancing leaning by understanding teaching and learning styles. Pittsburgh: Alliance Pulishers.
Hayati, B. (2008). On the relationship between perceptual learning style and reading comprehension, grammar and vocabulary learning of Iranian EFL learners. Unpublished master’s thesis, Alameh Tabatabaii University, Tehran, Iran .
Mohammadzadeh Edmolaee, R., Izadi, S. (2011). Learning Styles as Predictors of High School Students' Educational Performance. Studies in Learning & Instruction Vol. 2, No. 2.
Moradkhan, Dennis., Mirtaheri, Samin. (2011). The Relationship between Iranian EFL learners’ Perceptual Learning Styles and their Teachers’ Teaching Styles. Journal of English Studies, Islamic Azad University, Science & Research Branch, 1(4), 41-52.
Mulalic, A., Mohd Shah, P., & Ahmad, F. (2009). Perceptual learning style of ESL students. European Journal of Social Sciences, 7(3), 101-113. Najafi Kalyani. M, Karimi, Sh, Jamshidi, N (2010). Comparison of learning styles and preferred teaching methods of students in Fasa University
of Medical Sciences. Arak Medical University Journal (AMUJ). 12(4): 89-94.