1
Exploring the potential of community
mobilisation with women’s groups to
improve child growth among
underserved tribal communities of
Eastern India
Jennifer Saxton
A thesis submitted for the degree of Doctor of Philosophy
The UCL Institute for Global Health
30 Guilford Street
London
WC1N 1EH
2
Declaration
I,
Jennifer Saxton
, confirm that the work presented in this thesis
is my own. Where information has been derived from other
sources I confirm that I have indicated this in the thesis.
Signed
___________________________
3
Abstract
Background: India is home to one-third of the world’s undernourished children. Rural tribal areas are disproportionately affected. Community-based behaviour change interventions are central to addressing undernutrition. Most interventions have used didactic educational methods but have had a limited impact; fewer studies have tested participatory approaches. This thesis explores the potential of a participatory intervention to reduce child undernutrition in rural tribal communities of Eastern India.
Methods: We conducted a cross-sectional nutrition survey of 36 village-clusters in three districts of Jharkhand and Orissa: 18 clusters had been exposed to community mobilisation with women’s groups to improve child health and nutrition; 18 control clusters matched the intervention areas on population and health-service characteristics. We also conducted focus groups with caregivers of young children.
Results: There were no group differences for child anthropometry. Levels of undernutrition were extremely high: 40% of children were experiencing global acute malnutrition, 60% were stunted, and 24% had mid-arm-circumference measurements in the moderate-severe malnutrition category. There were significant group differences for hand washing, water treatment, birth spacing, measles vaccination and awareness of child undernutrition that favoured the intervention group; there were no differences for child feeding practices, health-service uptake or child morbidity. The analyses identified a multitude of undernutrition determinants including strong protective effects of hand washing, and diarrhoea as a major risk factor. The focus groups revealed extreme food insecurity, problematic feeding and hygiene practices, and inadequate health services.
Conclusion: Community mobilisation with women’s groups does not appear to have reduced child undernutrition in this context, but has the potential to improve important nutrition behaviours. There is scope to improve and combine this intervention with complementary strategies, but until the wider problems of food insecurity, poverty and poor health-services are addressed community mobilisation with women’s groups, on its own, is unlikely to meaningfully impact on undernutrition.
4
Acknowledgments
I would like to express my sincere thanks to Audrey Prost, my primary PhD supervisor, for sharing her wisdom and for her attentiveness and support throughout this process. I would also like to thank Andrew Seal, who as my secondary supervisor has made valuable contributions to this work, particularly his technical guidance during the nutrition survey. This PhD would not have been possible without my wonderful colleagues at Ekjut. I have been endlessly impressed with their passion, dedication and hard work. So many people were involved in making this project a success, including Prasanta Tripathy, Nirmala Nair, Shibanand Rath, Suchitra Rath, Rajendra Mahapatra, Rajkumar Gope, Vijay Singh, Aparna Bajpai, Mary Menuka Hemrom and all of the office staff who were involved in the data entry and training. I am also indebted to the growth monitors and their helpers who were so focused in training, and so efficient in data collection. Thank you to all the participants in the study, who gave up their precious time to take part. I will always have fond memories of the time I spent in CKP and Keonjhar.
Thank you to my lovely colleagues here at the UCL Institute of Global Health, in particular Marko Kerac without whom I may not have found a place here, James Beard for his invaluable work designing the nutrition survey database and Nadine Seward for her statistical assistance. It has been a pleasure working in this department, and I shall miss everyone very much.
Thank you to my family and friends who have been so supportive throughout my PhD. In particular, I would like to thank Laura Webber, Akshay Patel and my sister, Anna Miskelly for their proofreading efforts, and Heather Bailey for her friendship and encouragement. Special thanks go to Akshay Patel, for keeping me going when times got tough, and for believing in me.
5
Table of contents
Declaration ... 2 Abstract ... 3 Acknowledgments ... 4 Table of contents ... 5 List of tables ... 10 List of figures ... 12 List of boxes ... 13 List of abbreviations ... 14Glossary of local terms ... 16
Chapter 1 ... 17
Background ... 17
1.1 Introduction ... 17
1.2 The global burden of undernutrition ... 17
1.2 Causes of undernutrition: the UNICEF conceptual framework ... 18
1.3 Timing of growth faltering ... 21
1.4 International focus on undernutrition ... 22
1.5 Hunger and undernutrition in India ... 23
1.6 Differences in undernutrition between social groups ... 26
1.7 National initiatives to improve health and nutrition ... 27
1.8 State-level initiatives ... 35
1.9 The importance of community-based behaviour change interventions in rural India ... 44
Chapter 2 ... 45
Literature review ... 45
2.1 Introduction ... 45
2.2 Efficacy or effectiveness? ... 45
6 2.4 Existing reviews of community-based behaviour change interventions to improve
child growth ... 47
2.5 Literature review parameters ... 48
2.6 Literature search methods ... 51
2.7 Characteristics of included studies ... 52
2.8 Grading the quality of evidence ... 66
2.9 Impact of health education on child growth... 67
2.10 Impact of behaviour change and communication on child growth ... 68
2.11 Impact of mixed behaviour change approaches on child growth ... 69
2.12 Impact of multi-component interventions and cognitive-behavioural therapy on child growth ... 70
2.13 Review limitations ... 70
2.14 Summary ... 71
Chapter 3 ... 73
Rationale for the PhD study ... 73
3.1 Moving beyond traditional behaviour change approaches ... 73
3.2 Community participation ... 74
3.3 Defining community mobilisation ... 78
3.4 Thesis aim, objectives and research questions ... 80
3.5 The intervention: community mobilisation with women’s groups... 81
3.6 The development of a new cycle of women’s groups for maternal and child health ... 85
3.7 Situating the intervention within a typology of community participation ... 85
3.8 Potential pathways from women’s group activities to improved child growth ... 87
Chapter 4 ... 92
Nutrition survey methods: design, data collection and analysis strategies ... 92
4.1 Survey design and setting ... 92
4.2 Ethical approval ... 96
4.3 Role of the researcher in the nutrition survey ... 97
4.4 Census of children under-three ... 97
4.5 Nutrition survey participants ... 98
4.6 Growth monitor recruitment and training ... 98
4.7 Nutrition survey content and indicators ... 100
4.8 Referral pathway ... 101
7
4.10 Sample size calculation ... 101
4.11 Sampling strategy ... 102
4.12 Data collection ... 103
4.13 Response rate ... 103
4.14 Data quality and preparation ... 104
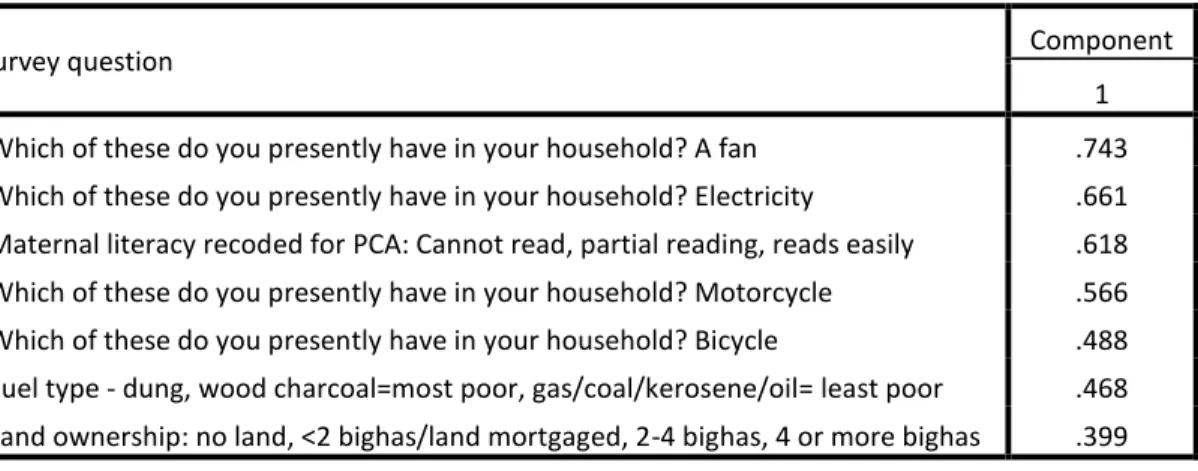
4.15 The development of socio-economic quintiles ... 107
4.16 Statistical approaches ... 115
4.17 Analysis overview ... 117
Chapter 5 ... 122
Were levels of child undernutrition lower in intervention areas compared to control areas? ... 122
5.1 Chapter overview ... 122
5.2 Association between intervention exposure, child wasting and acute malnutrition ... 122
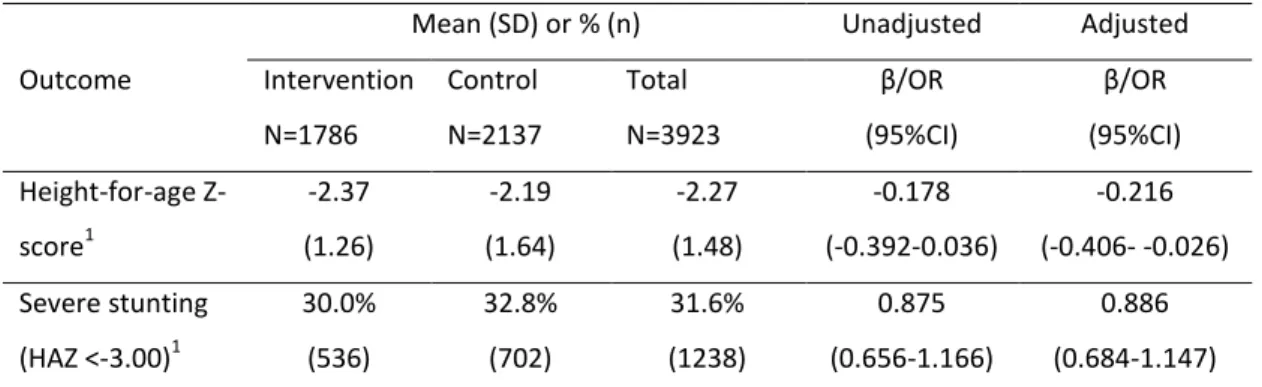
5.3 Association between intervention exposure and child stunting ... 125
5.4 Association between intervention exposure and child underweight ... 128
5.5 Association between intervention exposure and child mid-to-upper arm circumference ... 130
5.6 Discussion ... 131
5.7 Conclusion ... 140
Chapter 6 ... 141
Associations between intervention exposure and health behaviours ... 141
6.1 Chapter overview ... 141
6.2 Pregnancy-related behaviours ... 142
6.3 Breastfeeding and young child feeding indicators ... 146
6.4 Prevention and management of childhood illnesses ... 150
6.5 Hygiene and sanitation ... 154
6.6 Provision and uptake of health and nutrition services ... 158
6.7 Maternal and child health indicators ... 160
6.8 Discussion ... 166
6.9 Conclusion ... 179
Chapter 7 ... 181
Determinants of undernutrition ... 181
7.1 Chapter overview ... 181
8
7.3 Analysis stages ... 183
7.4 Determinants of stunting in children 6.00-23.99 months ... 184
7.5 Determinants of wasting in children 6.00-23.99 months ... 190
7.6 Determinants of underweight in children 6.00-23.99 months ... 196
7.7 Determinants of mid-upper-arm circumference in children 6.00-23.99 months .. 202
7.8 Discussion ... 208
7.9 Variable limitations ... 217
7.10 Conclusion ... 220
Chapter 8 ... 221
Focus Group Discussions ... 221
8.1 Introduction ... 221
8.2 Methods ... 221
8.3 Thematic analysis stages ... 223
8.4 Qualitative findings ... 225
8.5 Triangulation of qualitative findings with the nutrition survey ... 235
8.6 Discussion ... 240 8.7 Limitations ... 243 8.8 Conclusion ... 244 Chapter 9 ... 245 Discussion ... 245 9.1 Introduction ... 245
9.2 The nutritional status of children in the study areas ... 246
9.3 What is driving undernutrition in the study areas? ... 247
9.4 How effective were the women’s group cycles for the reduction of undernutrition? ... 254
9.5 How could ‘cycle 2’ be improved to impact on nutrition? ... 257
9.6 The role of the government: system reforms ... 266
9.7 Wider potential for women’s groups: the power of civil society organisations ... 271
9.8 Effective undernutrition reduction: learning from others ... 273
9.9 Limitations of the PhD work ... 278
9.10 Future research ... 280
9.11 Conclusion ... 281
References ... 282
9 Appendices: chapter 2 ... 311 Appendices: chapter 4 ... 319 Appendices: chapter 5 ... 320 Appendices: chapter 6 ... 340 Appendices: chapter 7 ... 385 Appendices: chapter 8 ... 405
10
List of tables
Table 1.1 National Health and Nutrition Programmes in India ... 31
Table 1.2 Additional Jharkhand State Government and Government-linked NGO Health and Nutrition Programmes ... 36
Table 1.3 Additional Orissa State Government and Government-linked NGO Health and Nutrition programmes ... 38
Table 1.4 Government community and mid-level health workers ... 42
Table 2.1 Description of health education interventions ... 54
Table 2.2 Description of behaviour change and communication interventions ... 59
Table 2.3 Descriptions of other behaviour change interventions ... 63
Table 4.1 Extent of participation in the women’s groups intervention by district ... 107
Table 4.2 Factor loadings of variables included in socio-economic quintiles ... 110
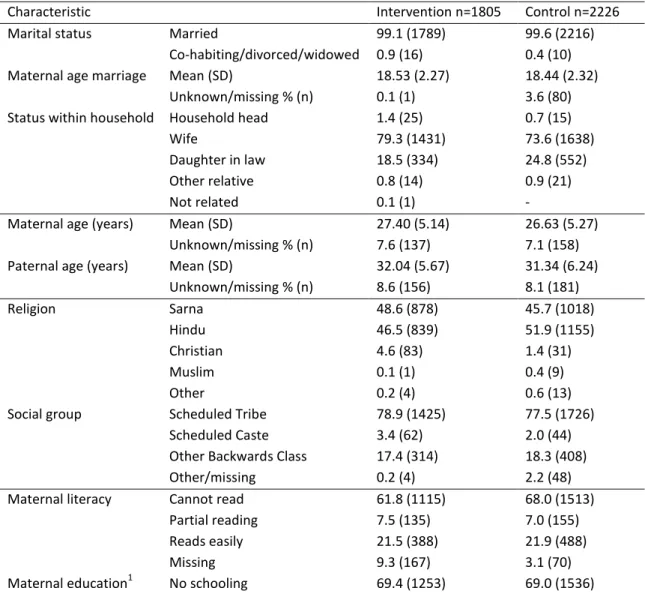
Table 4.3 Socio-demographic characteristics by exposure group: % (n) unless stated ... 111
Table 4.4 Socio-demographic and other exposure group differences ... 114
Table 5.1 Associations between intervention exposure, child wasting and acute malnutrition adjusted for socio-demographic variables ... 123
Table 5.2 Association between intervention exposure, child height-for-age Z-score and severe stunting adjusted for socio-demographic variables ... 125
Table 5.3: Associations between intervention exposure, child weight-for-age Z-score and severe underweight, adjusted for socio-demographic variables ... 128
Table 5.4 Association between intervention exposure, child mid-to-upper arm circumference, moderate and severe malnutrition in unadjusted and adjusted GEE models ... 130
Table 6.1 Rationale and details for self-reported pregnancy behaviour models ... 143
Table 6.2 Associations between intervention exposure and self-reported pregnancy behaviours, adjusted for socio-demographic variables ... 145
Table 6.3 Rationale and details for self-reported breastfeeding and young child feeding models ... 146
Table 6.4 The association between intervention exposure and maternally reported infant and young child feeding practices, adjusted for socio-demographic variables ... 149
Table 6.5 Rationale and details for the prevention and management of childhood illnesses models ... 150
11 Table 6.6 The association between intervention exposure and the prevention and
management of childhood illnesses, adjusted for socio-demographic variables ... 153 Table 6.7 Rationale and details for hand washing and water treatment models ... 154 Table 6.8 The association of intervention exposure with self-reported hand washing and treatment of drinking water, adjusted for socio-demographic variables ... 157 Table 6.9 Rationale and details for models assessing maternal awareness of child underweight and reported use of growth monitoring services ... 158 Table 6.10 The association of intervention exposure with maternal awareness of child
underweight and reported use of growth monitoring services, adjusted for socio-demographic variables ... 160 Table 6.11 Rationale and details for perceived low birth weight, prematurity, recent childhood illness and maternal health models ... 161 Table 6.12 The association between intervention exposure and other maternal and child health indicators, adjusted for socio-demographic variables ... 165 Table 7.1 Potential determinants of undernutrition for consideration in univariate models .. 182 Table 7.2 Final model estimates for determinants of height-for-age z-score in children 6.00-23.99 months in the control areas (n=1227) ... 187 Table 7.3 Final model estimates for determinants of weight-for-height Z-score in children 6.00-23.99 months in the control areas (n=1244) ... 194 Table 7.4 Final model estimates for determinants of weight-for-age Z-score in children 6.00-23.99 months in the control areas (n=1265) ... 200 Table 7.5 Final model estimates for determinants of mid-upper-arm circumference in children 6.00-23.99 months in the control areas (n=1273) ... 206 Table 8.1 Livelihoods, household shocks and coping: data collected during the nutrition survey ... 237
12
List of figures
Figure 1.1 The UNICEF Conceptual Framework ... 18
Figure 1.2 The Indian State Hunger Index, from Menon et al, 2009 ... 25
Figure 2.1 Flowchart of literature review process ... 52
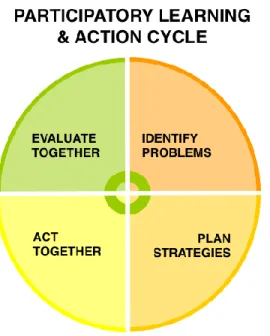
Figure 3.1 The Women’s Group Participatory Learning and Action Cycle ... 83
Figure 3.2 A spidergram representing the position of the women’s groups along five dimensions of participation ... 86
Figure 3.3 Potential pathways within the UNICEF conceptual framework through which the women’s groups could improve child growth outcomes ... 90
Figure 4.1 Map of India showing states and union territories ... 93
Figure 4.3 Flowchart of participants during sampling, data collection and retained in the final analyses ... 106
Figure 5.1 Distribution of weight-for-height Z-scores in the intervention clusters ... 124
Figure 5.2 Distribution of weight-for-height Z-scores in the control clusters ... 124
Figure 5.3 Distribution of height-for-age Z-scores in the intervention clusters ... 127
Figure 5.4 Distribution of height-for-age Z-scores in the control clusters ... 127
Figure 5.5 Distribution of weight-for-age Z-scores in the intervention clusters ... 129
Figure 5.6 Distribution of weight-for-age Z-scores in the control clusters ... 129
13
List of boxes
Box 2.1 Definitions of selected community-based behaviour change approaches ... 50
Box 2.2 Search terms: ... 51
Box 3.1 Pathways to improved child nutrition: priority areas addressed by women’s groups .. 89
Box 8.1 Insecure livelihoods and low income ... 226
Box 8.2 Increasing food prices and food price volatility ... 227
Box 8.3 Pressure on environmental resources ... 228
Box 8.4 Coping strategies in times of food shortage or loss of income ... 229
Box 8.5 Exclusive breastfeeding and “insufficient milk” ... 230
Box 8.6 Timeliness and quality of weaning foods ... 231
Box 8.7 Suboptimal hand washing and hygiene practices ... 232
Box 8.8 Perceived local burden of undernutrition ... 233
Box 8.9 The importance of functioning health services ... 234
14
List of abbreviations
ANC Antenatal care
ANM Auxiliary Nurse Midwife
AOR Adjusted Odds Ratio
ARI Acute Respiratory Infection ASHA Accredited Social Health Activist
AWC Anganwadi Centre
AWW Anganwadi Worker
BMI Body Mass Index
BPL Below Poverty Line
CBT Cognitive Behavioural Therapy
CHC Community Health Centre
CHW Community Health Worker
CMAM Community Management of Acute Malnutrition DFID Department for International Development (UK) DLHS District-level Household and Facility Survey DHS Demographic and Health Survey
DWCD Department for Women and Child Development EBF Exclusive Breastfeeding
FANTA Food and Nutrition Technical Assistance GAM Global Acute Malnutrition
GEE Generalised Estimating Equations
GoI Government of India
HAZ Height-for-age Z-score
ICDS Integrated Child Development Services IFPRI International Food Policy Research Institute IPC Integrated Food Security Phase Classification IYCF Infant and Young Child Feeding
MDG Millennium Development Goal
MoHFW Ministry of Health and Family Welfare MUAC Mid to Upper Arm Circumference NCHS The National Center for Health Statistics NFHS National Family Health Survey
NGO Non-governmental organisation NRHM National Rural Health Mission
OBC Other Backward Class
ORS Oral Rehydration Solution PDS Public Distribution System
PNC Postnatal care
PRADAN An Indian NGO involved in livelihood and micro-credit activities PRI Panchayati Raj Institution
15
Rs Indian Rupees
SAM Severe Acute Malnutrition
SC Scheduled Caste
SD Standard Deviation
ST Scheduled Tribe
TBA Traditional Birth Attendant
UN United Nations
UNFPA United Nations Population Fund UNICEF United Nations Children’s Fund VHC Village Health Committee
VHSCs Village Health and Sanitation Committees
WAZ Weight-for-age Z-score
WHO World Health Organisation WHZ Weight-for-height Z-score
16
Glossary of local terms
Adivasi An umbrella term used to describe tribal groups in India, meaning ‘original inhabitants’
Amul A brand of milk and milk powder
Bidi A handmade cigarette
Bigha Approximately 0.5 acres of land
Benga saag Centella Asiatica, a herb found in wet areas (near streams) and containing zinc and other micronutrients
Panchayat Panchayati Raj Institutions include three levels of decentralised government: village, block, district-level; Panchayat refers to the village-level or to a group of connected villages
Dimri A summer fruit
Gram sabha Village council
Ho A tribal group originating from Jharkhand
Juang The Government of India has classified Juang communities as a ‘particularly vulnerable’ tribal group; the group originates from Orissa Kendu Kendu is a summer fruit, rich in vitamin A; its leaves are also used for
making ‘bidi’ cigarettes
Kodhei Summer fruits
Mahto A tribal group
Muh-Juthi A Mahto group festival held for infants at seven months to celebrate the child’s consumption of food for the first time
Munda A tribal group living in Jharkhand and Orissa Paddy Rice or rice field
Pita alu A type of potato
Santhal One of the largest tribal groups in India Sarna Ho tribal religion
17
Chapter 1
Background
1.1 Introduction
This chapter provides a general overview of child undernutrition, globally and in India. I begin with a brief summary of the global burden of undernutrition, its causal pathways, and the timing of growth faltering. I then describe recent international initiatives to address this issue and methods to monitor hunger and malnutrition. Finally I describe undernutrition in India, and the states of Jharkhand and Orissa. The chapter concludes with a discussion of the importance of community-based behaviour change interventions to improve child growth amongst those most at risk of undernutrition in rural India.
1.2 The global burden of undernutrition
Undernutrition contributes to 2.2 million under-five deaths annually, the vast majority occurring in twenty low and middle-income countries (Black et al. 2008;Gottlieb et al. 2009). Stunting (low height-for-age), wasting (low height) and underweight (low weight-for-age) are significant independent risk factors for under-five mortality (Victora et al. 2008). Elevated mortality risks are not limited to severe cases: even mild-to-moderate weight-for-age deficits significantly increase vulnerability to a wide range of potentially fatal childhood diseases and all-cause mortality (Caulfield et al. 2004). Stunting and wasting can also impair cognitive development, and the combination of stunting, severe wasting and intra-uterine growth restriction (IUGR) has been estimated to account for 21% of disability adjusted life years among children under-five (Black et al. 2008). In the longer-term, child undernutrition increases adult susceptibility to a range of morbidities such as heart disease, high blood pressure and kidney damage (Kinra et al. 2008;Victora et al. 2008). There is also a strong association between
18 stunting and lowered work productivity, which has been directly linked to diminished earning potential (Victora et al. 2008).
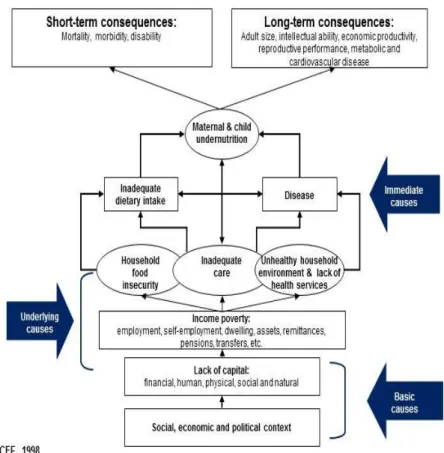
1.2 Causes of undernutrition: the UNICEF conceptual framework
The causes of undernutrition are multi-level, interwoven and nearly always underpinned by poverty and inequality. The UNICEF conceptual framework identifies three levels of causality: basic, underlying and immediate (UNICEF 1990;UNICEF 1998). An adapted version, extended by Black et al (2008) is shown in Figure 1.1.
19 At the basic level is the social, economic and political context, which could include issues such as escalating food prices, lack of government spending on health, and absence of social security. The model also highlights the lack of five different forms of ‘capital’ as a basic cause; social capital refers to ‘connections within and among social networks’ and human capital to investment in education and training, which can have intrinsic value for health (OECD 2010). It is important to note that social capital is a complex construct and, depending on the context, does not necessarily result in improved health outcomes (Kunitz 2004). Kunitz argues that there are ‘mixed and uncertain consequences of group membership’ including the burden of expected reciprocal acts and coercion by the wider group to provide resources or to behave in a certain way. The chances of this are exacerbated where poverty levels are high, state provision of resources is low and community groups are expected to fill the gaps, often with little choice about who to work with to achieve these goals. At the kinship level, expectations may place a heavy burden on family members, and on some (such as women) more than others, which has the potential to erode life opportunities and be harmful for health. Whilst ‘primary and secondary ties may bind us together…they may also imprison and divide us’ (Kunitz 2004). The next level in the framework illustrates underlying causes of undernutrition. This includes income poverty, which is in turn linked to three overlapping underlying risk factors: household food insecurity, unhealthy household environment and lack of health services, and inadequate care. Care refers to both women and children, and although it is given equal importance to the other domains in the framework, it may be the most neglected in practice in favour of food-focused activities (Engle 1999;Engle et al. 2000). A greater focus on the care of women may be particularly valuable in some South Asian societies, where women play a subservient role, their nutrition and education is of low priority, and they have limited control over their own lives, childcare practices and health-seeking behaviour (Bolam et al. 1998;Gillespie 1997). Given recent international attention on undernutrition, and an increasing awareness of intergenerational effects relating to the poor care and low status of women, this could result in ‘care’ receiving greater prominence in nutritional programmes (Black et al. 2008;Scaling Up Nutrition 2010).
The final level of the model specifies the immediate causes of undernutrition: poor dietary intake and disease. The World Health Organisation (WHO) has defined eight core infant and young child feeding indicators that represent optimal dietary intake: early initiation and
20 exclusive breastfeeding under six-months, continued breastfeeding to one year, timely introduction of solid, semi-solid or soft foods (at 6-8 months), minimum dietary diversity (≥4 food groups per day for children 6-23 months), minimum meal frequency (which varies by age and breastfeeding status), minimum acceptable diet (a composite of the previous two indicators) and consumption of iron-rich foods (World Health Organisation 2009). The extent to which these recommendations can be followed varies. For example, flesh foods are iron-rich but may be too costly or culturally unacceptable for some households.
In terms of disease prevention, the WHO has developed immunisation schedules to prevent common childhood illnesses, such as measles. They also recommend routine deworming and vitamin A supplements in particular regions (World Health Organisation 2011b;World Health Organisation 2012). They further advocate for the use of Oral Rehydration Solution to manage diarrhoea, and in malarial zones families are advised to sleep under insecticide treated nets (Fischer Walker et al. 2009;World Health Organisation 2007). Common indicators of childhood infection (such as those measured in Demographic and Health Surveys) are fever, cough and diarrhoea and are all linked to an increased risk of undernutrition (DHS 2013).
The UNICEF framework was not intended as a universal model of undernutrition but as a guide to identify potential causes for consideration at the ‘assessment and analysis’ stage of programme planning. This then enables prioritising of the problems that are driving undernutrition and the creation of a context-specific plan of action (the ‘triple A’ approach) (UNICEF 1990;UNICEF 1998). It may be necessary to create different action plans for different nutritional indicators. One country-level analysis identified a negative correlation between stunting and wasting in Latin America, no correlation in Africa, and a strong positive correlation in Asia, indicating that stunting and wasting may have different determinants requiring different interventions (Victora et al. 2005).
Nutrition action plans should also involve consideration of the interaction and interdependency between different components of the framework. For example, an agricultural programme aimed at improving food security could negatively affect the ‘care of women’ if this resulted in an increase to already excessive workloads. Any health and nutrition programme would have the potential to change the dynamic between the different components of the framework, and ensuring that this does not have detrimental results requires good governance, inter-sectoral communication and commitment (Pelletier 2002;UNICEF 1990;UNICEF 1998). Overall, when
21 applied correctly, the UNICEF model allows consideration of the full range of causes, contexts and pathways to undernutrition, which should avoid treating the manifestation of undernutrition alone without addressing distal causes that maintain these pathways (Pelletier 2002).
1.3 Timing of growth faltering
Epidemiological studies have identified the most vulnerable time-points for growth faltering, their associated risk factors and their proximal determinants. Evidence suggests that child undernutrition can begin in the womb: intra-uterine growth restriction (IUGR) from poor maternal nutrition during pregnancy may lead to linear growth deficits that are largely irreversible after two years (De Onis 2008). The linear growth potential of children may also be pre-set by maternal short stature, anaemia and young age at first pregnancy (<18 years): these factors increase the risk of low birth weight, which is in turn associated with stunting. Early pregnancy compounds the intergenerational transmission of undernutrition because it prematurely stops maternal growth, preventing women from reaching their full height potential (De Onis 2008).
A second critical time-point for growth is during the first two years of life. The WHO recommends early initiation of breastfeeding (within one hour of birth) and exclusive breastfeeding until six months of age (World Health Organisation 2011a). Early initiation is important because the colostrum in the first few days provides immune protection to the infant (Uruakpa et al. 2002). Late breastfeeding initiation may not only reflect colostrum discarding, but also pre-lacteal feeding, which increases infection risks and is a common cultural practice in parts of South Asia (Bamji 2003;Edmond et al. 2006;Fikree et al. 2005). Non-exclusive breastfeeding of infants under-six months in settings where it is difficult to hygienically prepare bottles and where formula milk is not affordable increases the likelihood of suboptimal feeding, infections and undernutrition (Weisstaub and Uauy 2012;World Health Organisation 2008a). When children reach six months of age, solid, semi-solid and soft foods should be introduced into their diet (World Health Organisation 2009). If the timing of this transition is inappropriate, if feeding frequency is inadequate, or if the quality and diversity of foods are poor, this increases the risk of impaired physical growth and cognitive development (Arabi et al. 2012;Bhutta et al. 2008;Black et al. 2008). Poorer cognitive outcomes may be a direct result of
22 brain damage from inadequate dietary quality, an extreme example being the development of cretinism due to an iodine-deficient diet (World Health Organisation 2001b). Poorer cognitive outcomes may also be an indirect result of children lacking the energy to explore their environments and demand social stimulation from adults (De Onis 2008).
1.4 International focus on undernutrition
The timing of growth faltering has recently captured international attention through the ‘1000 days’ concept. This emphasises the time period from day one of conception through to the age of two years as a critical window for child growth (1000 days 2011). The Scaling up Nutrition initiative (SUN) identifies 13 evidence-based direct interventions to reduce undernutrition, and further indirect governance-related activities required to coordinate effective action to tackle undernutrition; this built on the work of the Lancet maternal and child undernutrition series (Horton 2008;Scaling Up Nutrition 2010). Direct interventions refer to nutrition-specific interventions relating to the underlying and immediate determinants of undernutrition in the UNICEF framework. These include infant and young child feeding, hygiene and hand washing, micronutrients and deworming for mothers and children, food fortification with micronutrients, and therapeutic feeding for undernourished children. Indirect actions include tackling the basic causes of undernutrition (such as ensuring adequate incomes) and improving governance so nutrition can be integrated into other government sectors to allow a coordinated approach (Scaling Up Nutrition 2010).
The chances of achieving several of the Millennium Development Goals (MDGs) will hinge on improvements in nutrition. The 1000 days concept and the SUN initiative have made an important contribution by stimulating additional commitment and financial support from unilateral and bilateral organisations, Non-Governmental Organisations (NGOs) and governments of target countries (Department for International Development 2010). However, current data suggest that MDG 1 (eradicate extreme poverty and hunger) and MDG 4 (reduce under-five mortality by two-thirds between 1990-2015) are unlikely to be achieved by 2015 (Requejo et al. 2012). India and China, due to their large population sizes, play a key role in the overall attainment of MDGs 1 and 4. Whilst China is on track to meet both goals, in India achieving MDG 1 ‘will require interventions of great magnitude in disadvantaged states’, and there has been ‘insufficient progress’ on MDG 4 (Bhutta et al. 2010;UNICEF India 2010a).
23 The annual Global Hunger Index is one source of information used to monitor progress towards MDGs 1 and 4 (IFPRI 2006). This was developed by the International Food Policy Research Institute (IFPRI) who defines ‘hunger’ according to three measures: 1) undernourishment (the proportion of people consuming <1800 calories per day); 2) underweight in children under-five years (weight-for-age z-score <-2.00); and 3) under-five mortality. The index weights all three indicators equally and generates a score from 0 to 100, with lower values representing lower levels of hunger: <5=low, 5-9.9=moderate, 10-19.9=serious, 20-29.9=alarming, ≥30=extremely alarming. 120 developing countries have data available for all three measures, although several of them were excluded from the 2012 ranking because they scored very low. Of the remaining countries, Azerbaijan has the lowest ranking (i.e. the least hunger) and Burundi the worst ranking, in 79th place. India is also poorly ranked for hunger, placed 65th in 2012, and has shown little sign of improvement since 1996 and 2001 rankings, and no change since 2011. India ranked second worst for prevalence of child underweight in 2012 according to the Global Hunger Index (IFPRI 2012).
1.5 Hunger and undernutrition in India
It is surprising that India ranks so highly on the hunger index. It is the world’s largest democracy and also one of the world’s largest and fastest growing economies, with national growth for 2011/12 at 15.68% (Indian Planning Commission 2012). For the year 2011, India’s Gross Domestic Product per capita was $1489 ($1055 in 2007) (The World Bank 2012). Increasing income tends to be matched by lowering levels of undernutrition, yet India is home to one third of the world’s undernourished children (Haddad and Zeitlyn 2009). In absolute numbers this amounts to an estimated 61 million stunted and 25 million wasted children under-five (UNICEF India 2010b). Building on the Global Hunger Index from 2008, Menon and colleagues developed the India State Hunger Index (ISHI) to show the national distribution of ‘hunger’ (Menon et al. 2009). This is illustrated in Figure 1.2. It is evident that, although there is some variation, much of India has alarming levels of hunger, and Madhya Pradesh is the worst affected.
India’s national nutrition survey, the National Family Health Survey (NFHS) provides separate estimates for stunting and wasting in children by state. The most recent NFHS-3 data from 2005/6 indicate substantial between-state differences (Ministry of Health and Family Welfare 2006;Paul et al. 2011). With the exception of Meghalaya in the North East and Gujarat in the
24 West, the worst rates of stunting and wasting are centred in the Central and Eastern states (Ministry of Health and Family Welfare 2006;Motherchildnutrition.org 2007). Two of the Eastern states, Jharkhand and Orissa, are the focus of this PhD thesis.
Stunting trends for children under-three in Jharkhand show an overall reduction from 54% in 1998/9 to 47% in 2005/6, but an increase in wasting (28% to 36%); Orissa has seen an overall decrease in stunting (49% to 44%) and wasting (30% to 24%) (Ministry of Health and Family Welfare 2006). State-level estimates disguise the markedly higher rates of stunting and wasting in rural compared to urban areas. According to the NFHS-3 stunting amongst under-fives in rural Jharkhand was 53.4% and wasting was 34.1% compared to 34.8% and 24.6% in urban areas. In rural Orissa stunting estimates were 46.5% and wasting was 20.5% compared to 34.9% and 13.4% in urban areas respectively (Ministry of Health and Family Welfare 2006).
A recent analysis of the NFHS-3 identified that 36% of faltering in height-for-age Z-score had already taken place at birth (Mamidi et al. 2011), highlighting the importance of addressing maternal undernutrition in this context. To put NFHS-3 wasting estimates into a global context, unless there has been a food shortage, prevalence tends to be less than 5% amongst under-fives in most countries, with South Asia being the exception (De Onis 2008). In terms of international standards of acceptability the WHO considers wasting of 10-14% as ‘serious’ and ≥15% ‘critical’, highlighting the need for action in many parts of India (Fernandez et al. 2002;World Health Organisation 2013).
The NFHS survey is supposed to be conducted every seven years (Ministry of Health and Family Welfare 2006). Critics suggest this time frame is too infrequent to effectively monitor undernutrition and target interventions, and there is an argument for ‘more frequent, slimmer surveys’ (Haddad and Zeitlyn 2009). NFHS trends also conflict with National Nutritional Monitoring Bureau data from rural villages in nine Indian states, including Orissa, that show a slow decline in underweight and wasting but an increase in stunting over a similar time period (Deaton and Dreze 2009;National Nutrition Monitoring Bureau 2006).
25 Figure 1.2 The Indian State Hunger Index, from Menon et al, 2009
Given increasing global food prices and several poor monsoons in the years since the NFHS-3, the more recent Hungamaa survey in 2011 provided an important update on child undernutrition (Hungamaa 2011). This survey included the 100 lowest ranking districts on UNICEF’s Child Development District Index covering 6 states: Jharkhand, Orissa, Bihar, Madhya Pradesh, Rajasthan and Uttar Pradesh; 12 high ranking districts from Kerala, Himachal Pradesh and Tamil Nadu served as a comparison (Hungamaa 2011;UNICEF 2011). The results indicate that although there has been a decline in undernutrition since the NFHS-3, levels of underweight (40%) and stunting (~60%) remain excessive in these high burden districts
26 (Hungamaa 2011). Overall, the available data indicates slow progress towards reducing child undernutrition. At current rates of decline in underweight India may not reach its Millennium Development Goal until 2043 (Haddad and Zeitlyn 2009).
1.6 Differences in undernutrition between social groups
There are large within-state differences for undernutrition that go beyond the rural-urban divide. These often have social determinants that are linked to caste and class (Subramanian et al. 2006). People from adivasi groups (meaning ‘original inhabitants of the land’) are described as ‘Scheduled Tribes’, and together with people from ‘Scheduled Caste’ groups (SCs, formerly known as ‘untouchables’) are amongst the most underserved socially excluded groups in India. This is reflected in poorer health and nutrition outcomes (Government of India 2005a;Haddad et al. 2012;Subramanian et al. 2006). For example, NFHS-3 analyses indicate that underweight amongst under-fives may be as high as 55% amongst Scheduled Tribes and 48% amongst Scheduled Castes (this is compared to 43% from Other Backward Class groups, and 34% in all other groups). Further analyses indicate that even when education and poverty are equal, health outcomes are still substantially worse for adivasi and Scheduled Caste groups (Kumar et al. 2010a).
Social group disparities in health outcomes may be a result of caste-based discrimination and exclusion from quality healthcare (Thorat and Sadana 2009). Observational evidence converges with this hypothesis, and highlights that beliefs about ‘untouchability’, ‘impurity’ and ‘pollution’ through touch and ingestion compromise the delivery of health and nutrition programmes (Mamgain and Diwakar 2012;Thorat and Sadana 2009). Monitoring of the midday meal scheme for preschool and primary school children in 550 villages across five states by the Indian Institute for Dalit Studies identified the following issues: segregated seating by caste; denial of meals for SC children, serving SC children last; punishing SC children requesting food first; poorer quality and lower quantity of food for SC children; serving SC children from a distance (Acharya 2012;Thorat and Sadana 2009). An Action Aid study of 555 villages across 11 states in rural areas pointed to economic as well as social exclusion of SC groups, for example being unable to sell milk to private buyers or cooperatives because of perceived ‘pollution’ of goods (Shah et al. 2006;Thorat and Sadana 2009). There is also evidence that health and nutrition programmes are designed in a way that may inadvertently exclude marginalised groups. For
27 example, ‘fair price’ shops that enable poorer people to buy subsidised grain are often located in ‘higher caste’ areas, and run by elite groups which has resulted in some underserved groups being unable to access their entitlements (Swain and Kumaran 2012).
1.7 National initiatives to improve health and nutrition
There are several government initiatives designed to improve health and nutrition in India that are discussed here, and outlined in Table 1.1.
National Initiatives
Two national government departments are responsible for maternal and child health and nutrition: the Ministry of Health and Family Welfare (MoHFW) and the Department for Women and Child Development (DWCD). This involves some inter-sectoral collaboration to coordinate different elements of some of the larger programmes. There are two major national nutrition and health programmes: the Integrated Child Development Services (ICDS) and the National Rural Health Mission (NRHM). Several other programmes are also highly relevant to nutrition, including the Targeted Public Distribution System for food security, the National Rural Employment Guarantee Scheme, the Total Sanitation Campaign, numerous Self Help Group initiatives for income generation, and more recently health and nutrition groups for adolescent girls. These programmes and sub-programmes are summarised in Table 1.1.
Many of these programmes have suffered from design and implementation problems, although this varies considerably within and between states (Gragnolati et al. 2006a;Haddad and Zeitlyn 2009;Paul et al. 2011). Self-help group (SHG) initiatives for example show an uneven spread, with North Eastern areas seeing lower response rates and higher attrition of groups than Southern areas. This is partly due to lack of access to banks in rural areas, lack of transparency, accountability, and participant knowledge about entitlements (Rajalakshmi 2010). According to some reports, the National Rural Employment Guarantee Scheme has also failed many rural communities: a recent survey in Jhabua district (Madhya Pradesh) showed a mean of 11.51 days of employment, far below the ‘guaranteed’ 100, with just 0.48% of households getting work for the full duration (Singh 2010). Furthermore, the programme focuses on manual labour jobs that are low paid, and excludes some people with disabilities and illness (Dreze 2010).
28 The National Rural Health Mission
The National Rural Health Mission was designed to be a decentralised scheme to increase the coverage and quality of primary health care and increase community involvement with health services in rural India. A new cadre of health worker (the Accredited Social Health Activist or ASHA) was created to facilitate this process (Ministry of Health and Family Welfare 2005). Whilst the NRHM has seen some improvement to infrastructure, the coverage and quality of care remains suboptimal. For example, there is still a considerable ‘unmet need’ for contraception and inadequate access to safe abortion (Paul et al. 2011). Some criticisms include an excessive focus of the ASHA on implementing the JSY voucher scheme (which offers a financial incentive to women to give birth in institutional facilities) at the expense of other activities (Paul et al. 2011). There are also shortfalls in ASHA training and overall financing of the NRHM. There is also evidence of bias in the allocation of yearly funds towards politically visible schemes that are not necessarily the most effective for improving health, but are more likely capture votes (Paul et al. 2011).
The Targeted Public Distribution System
The Targeted Public Distribution System has encountered difficulties in identifying appropriate beneficiaries. This is partly due to flawed assessment methods to identify households that are eligible for Below Poverty Line cards. This has resulted in many deserving households being excluded from the scheme, whilst richer households benefit (Swain and Kumaran 2012). There is also ‘leakage’ of grain as it travels down the supply chain leading to large shortfalls by the time it reaches villages (Singh 2010). Attempts to increase coverage of the programme have also been problematic, with supply calculations based on population size from the 2001 census which has grown considerably since then. Coupled with inappropriate distribution of below poverty line cards, this is unlikely to improve food security (Singh 2010).
The more recent draft National Food Security Bill has attempted to resolve some of the issues with the Targeted Public Distribution System, and has pledged to provide subsidised food grains to 75% of the rural population (Government of India 2011b). But the bill has been controversial for continuing its targeted approach without improving eligibility assessments, despite evidence that a general non-targeted scheme may work more efficiently and equitably (Khera and Dreze 2011). There are also unresolved issues in terms of lack of accountability and weak monitoring systems (Swain and Kumaran 2012).
29 There may still be scope to improve the system before the food security bill is finalised (Haddad et al. 2012). This will be even more important given continually escalating food prices worldwide: a recent Rabobank report predicts that global food prices will have increased by 15% by mid-2013 (Singh 2012). National food prices are also escalating: for example, Food Price Watch identified a 25% increase in the price of rice in India in the first and second quarters of 2012, but noted decreases in rice prices in most other regions of South Asia (World Bank 2012). This is further undermining the food security of the poorest households and increasing the risk of undernutrition.
The Integrated Child Development Services (ICDS)
The Integrated Child Development Services (ICDS) is pitched as India’s ‘flagship nutrition programme’ (Ministry of Women and Child Development 2013). However, it is not considered successful despite being ‘well designed and well placed’ for that purpose (Gragnolati et al. 2006a). It has suffered from implementation difficulties and inequitable service coverage. Gragnolati and others have identified bias towards the supplementary nutrition aspect of the ICDS (which is also affected by leakage and irregular food supplies) at the expense of other ICDS components such as counselling for feeding and caring practices (Gragnolati et al. 2006a;Paul et al. 2011;Saxena 2012). These behaviour change elements of the ICDS may be even more likely to be side-lined in the context of growing food insecurity due to escalating food prices. The focus on supplementary nutrition has also diverted attention away from pregnant women and children under-two with more time spent providing services for 3-6 year old children (Gragnolati et al. 2006b;Paul et al. 2011). As a result there have been missed opportunities to conduct home visits to provide support and advice for infant and young child feeding, or to give specific support to vulnerable households (Paul et al. 2011). Research also indicates that there is less ICDS contact by poorer households compared with richer (Haddad and Zeitlyn 2009). There remains a bias in funding and coverage of ICDS services towards richer states, whilst poorer states with the highest levels of undernutrition remain underserved, reflecting state differences in political leadership and commitment to reducing undernutrition (Haddad and Zeitlyn 2009).
The Anganwadi centre (AWC) is the central venue from which many current programmes (such as the ICDS) and newly introduced community schemes operate (such as ‘Sabla’, for female
30 adolescent empowerment). Sabla alone will increase the regular use of AWCs from 2-3 adolescent girls per week to 15-20, whilst the AWC is also used for early child development activities and supplementary feeding for children under six (Department for Women and Child Development 2010;Singh 2010). There is often inadequate space, toilets and drinking water at AWCs, and it will be impossible for many of these programmes to run without significant expenditure on facility improvement (Department for Women and Child Development 2010;Singh 2010). Although Anganwadi workers (AWWs) are supposed to have daily contact with community members, this is not always the case and there is little community ownership or active involvement in the implementation of the ICDS. Only 25% of village leaders have given overt support for the scheme e.g. by making space for the AWC or helping identify beneficiaries (Gragnolati et al. 2006a).
The AWW is a government employee and is not directly accountable to communities, in terms of AWC opening hours, her attendance and the services she provides. There has been a recent shift towards accountability within the ICDS, and more monitoring is taking place. For example social audits of the ICDS were held recently in Orissa and Andhra Pradesh (Haddad and Zeitlyn 2009).
The Indian Planning Commission has recently drawn up plans to reform the ICDS and improve the quality of infrastructure and management of Anganwadi Centres (Indian Planning Commission 2011). This includes greater decentralisation of services by converting the ICDS into ‘mission mode’ and increasing ownership of the ICDS by community members (including women’s groups) so services are more responsive and appropriate for local needs, and should result in more effective public health action (Indian Planning Commission 2011;Paul et al. 2011). The ICDS will also include a greater focus on younger children, a continued emphasis on growth monitoring, and strategies to engage families in behaviour change (Indian Planning Commission 2011). Many of the planned changes reflect those recommended in a recent Lancet report of universal health care coverage in India (Paul et al. 2011). There are also plans to include a World Bank proposal to introduce a second AWW in districts with the highest burden of undernutrition, which has the potential to increase the coverage and quality of implementation of the ICDS (Ministry of Women and Child Development et al. 2006;Paul et al. 2011;Working group on children under six 2007).
31 Table 1.1 National Health and Nutrition Programmes in India
Programmes and associated initiatives
Key actors Intended beneficiaries Description Integrated Child Development Services(ICDS) (1975-)
Ministry of Health and Family Welfare (MOHFW), ICDS supervisors, Block level Child Development Project Officers, CARE India; Anganwadi Workers (AWWs)
Children <6 years pregnant and lactating women
AWWs deliver services via community-based Anganwadi Centres and home visits. This includes nutrition, sanitation, vaccination/health counselling, ANC, PNC, iron tablets, growth monitoring, referral of undernourished children, organisation/ facilitation of community meetings, pre-schooler development, provision of meals/take-home rations, registration of births and deaths. ICDS Supplementary Nutrition Programme Low-income pregnant and lactating women, children <6 years
Food provision 300 days/year (300 calories, 8-10g protein for <6s; 500 calories, 20-25g protein for women). Additional rations for underweight children. National Rural Health Mission/NRHM (2005-2015) MOHFW, Department for Women and Child Development (DWCD), Panchayati Raj
Institutions, Rural Water Scheme, Education dept, Norway India
Partnership Initiative, UNICEF, AWWs, Auxiliary
Underserved rural areas, women and children
Health-service strengthening: patient-welfare societies for community participation, public-private partnerships to improve hospital management; improving quality of health facilities, especially for institutional deliveries (e.g. creating neonatal intensive care units).
NRHM Janani Suraksha Yojana (JSY) scheme
Pregnant women and newborn infants
Aims to increase institutional deliveries. ASHAs incentivised to identify pregnant women and accompany to health facilities for delivery. They also conduct ANC/PNC visits, support breastfeeding and immunisations, and diagnose and treat malaria.
32
and Nutrition Days Nurse Midwives, ASHAs discussion of health issues, case-finding and referral of undernourished children, data collection (disability, disease, deaths).
Reproductive and Child Health II (RCH 2005-2010)
MoHFW, DWCD, Care India, UNICEF, United Nations Population Fund, ICDS, AWWs
Women, children <5 years
Aims to reduce infant and maternal mortality. Activities include promotion of contraception, improving safe motherhood services, provision of adolescent sexual/reproductive health services, improving referral systems, use of verbal autopsy tools. Child-based strategies include routine <5 nutrition/ immunisation checks, oral rehydration solution for diarrhoea, identification of feeding problems and essential newborn care.
RCH Teen girls groups (Balika Mandals)
Adolescent girls Aims to improve maternal/child health & nutrition by working with teenage girls. Focuses on improving knowledge/practices around sexual/reproductive health and gender issues.
Sabla-part of Rajiv Gandhi Scheme for Empowerment of Adolescent Girls (200 district pilot) MoHFW, ICDS, NRHM, AWWs/CHWs, Non-Governmental Organisations (NGOs)
Girls 11-14 years (not at school) and all girls 15-18 years
Integrated nutrition and health package delivered via AWCs by various health workers and NGOs. Girls are trained to ‘upgrade’ home, life and vocational skills, and health, hygiene and childcare education. Also aims to return ‘out of school’ girls to mainstream education. Food rations are provided 300 days/year (600 calories, 18-20g protein, and micronutrients), Iron and folic acid, health checks and referral are also provided.
Indira Gandhi Matritva Sahyog Yojana (2010-12): 52 district pilot MoHFW, DWCD, ICDS, AWW, AWW-helper Pregnant/lactating women >19 years, and first two children
Conditional cash transfers for pregnant/lactating women who fulfil certain maternal and child health-related activities to create an ‘enabling
environment for improved health and nutrition’ (4000 IRPs, 3 instalments, 2nd trimester to 6 months of age). Also provides ANC/PNC, promotes service-use, and supports breastfeeding. AWW and helper are incentivised for this.
33
Targeted Public Distribution System (1997-)
MoHFW, DWCD, Panchayati Raj & private institutions
Households with ‘Below Poverty Line’ cards
Provides essential food items and monthly household entitlement to 35g of grain at subsidised cost, to improve food security of poorer households. Total Sanitation
Campaign (1999-)
Govt of India (GOI), Panchayati Raj Institutions, Community-based Organisations, NGOs Rural poor communities
To provide clean water, and develop sanitation facilities to eradicate open defecation in rural areas. Includes information, education and
communication methods about sanitation. Financial incentives are available for household toilet construction. There are also efforts to install toilets and provide clean water at schools and AWCs.
National Rural Employment Guarantee Scheme (2005-)
GOI, state governments, Panchayati Raj
Institutions
Rural communities 100 days of guaranteed annual paid employment for rural adults. Minimum wage is set by the state government. Aims to increase income, strengthen livelihoods and prevent distress migration. Worksites should provide drinking water, shade and crèche facilities within 5km of the household.
National Rural Livelihood Mission (1999-)
GOI, Governing Council (GC), Executive Committee (EC)
Households with below poverty line cards in rural communities
Income generation strategies via self-help groups (SHGs). Aims to create SHGs, up-skill members to manage the SHG & ‘take up microenterprises’, provide a revolving fund to strengthen thrift/credit mechanisms, form credit links with banks, subsidise/give technical input for microenterprise.
National Agriculture Development Programme (2007-)
GOI, state governments, Department of
Agriculture/allied departments
Rural communities Aims to incentivise state governments to increase investment in agriculture. Involves the development of agricultural plans considering: eco-climatic conditions, resources, local needs/crops. It also seeks to: ‘reduce yield gaps’ in key crops via focused interventions, maximise economic return to farmers, and increase productivity of agricultural sectors with holistic approaches.
34
National Horticulture Mission (2005-2012)
GOI, Department of Agriculture, state & district GCs/ECs, Technical Support Groups
Rural communities Focus on holistic growth of horticulture sector via research, technology promotion, post-harvest management, processing and marketing, guided by regional ‘agro-climatic’ conditions. Aims to increase food production and crop diversity, improve nutrition security/income of farmers, develop technologies, create jobs for youth, and build human resource capacity.
35
1.8 State-level initiatives
There are also state-specific initiatives, and here I focus on programmes in Jharkhand and Orissa where my PhD study is based (Tables 1.2 and 1.3). I then provide details of the main cadres of community and mid-level health workers and their involvement in the delivery of government programmes (Table 1.4).
At the start of this PhD project, the Government of Orissa had a formal Nutrition Plan in place, including provision for four senior posts committed to: monitoring and evaluation, training, behaviour change and communication and nutrition (Government of Orissa 2009). The nutrition plan was created in collaboration with the National Government of India, with inputs from the Norway India Partnership Initiative, The UK Department for International Development, UNICEF and the United Nations Population Fund. It aimed to target the most vulnerable, with inbuilt flexibility of implementation strategies and extra funding to maximise coverage, and sought to strengthen linkages with other government initiatives (especially the ICDS).
Jharkhand did not have an equivalent nutrition plan containing any new innovations or programmes over and above what was already present in national guidelines, although there was provision for small extra financial incentives to AWWs and helpers, and four additional government-NGO linked programmes (Government of Jharkhand 2009).
36 Table 1.2 Additional Jharkhand State Government and Government-linked NGO Health and Nutrition Programmes
Programmes Key actors Intended beneficiaries Description The Dular programme (2009-2011) Department for Women and Child Development (DWCD) and UNICEF /IKEA social initiative
Children <2 years
Aimed to enhance Anganwadi Worker (AWW) coverage and effectiveness with ‘overlay’ ‘local resource groups/LRGs (4-5 local women, motivated and known to particular parts of the community). LRGs focused on mortality, morbidity and undernutrition reduction of <2s (e.g. via promotion of appropriate feeding practices and diarrhoea treatment. LRGs also supported AWWs in preparing food, home visits and identifying pregnant and lactating women.
The USAID micronutrient and child blindness project (Feb 2008-) USAID, DWCD, UNICEF, The Micronutrient Initiative, Integrated Child Development Services (ICDS) Mothers and children
A health and nutrition package delivered in ‘Mother & Child Health and Nutrition Months’ plus biannual vitamin A to reduce maternal and child anaemia. Interventions include iron folic acid provision, de-worming tablets, nutrition and health education, behaviour change and communication (e.g. for hand washing, improved infant and young child feeding and malaria prevention). The project also focuses on advocacy, staff capacity-building, improving supply systems and the use of data in planning and decision-making.
The Vistaar project (2006-2011)
USAID, National & State Governments, DWCD and Ministry of Health and Family Welfare
Mothers and children
Aimed to improve maternal, newborn and child health and nutrition. Reviews were
conducted to gauge available evidence for programmes on: complementary feeding, newborn care, delay of marriage/first birth, Village Health Committees (VHCs) and Community Health Worker performance/support. Findings are being used to translate knowledge into practice and decision-making. The project is now giving technical input to maternal and child health programmes, running demonstration and learning projects to fill knowledge gaps and conducting advocacy and capacity-building activities around review themes.
37
Ranchi Low Birth Weight Project (2006-)
State government,
Krishi Gram Vikas Kendra, the Child In Need Institute
Mothers and children
‘Quasi experimental action research’ that uses a community-based life-cycle approach to reduce low birth weight, and improve maternal and child health and nutrition through behaviour change. Community-based trained volunteers (Sahiyas) work with VHCs to improve diet, reduce workload in pregnancy, ensure ANC provision from health facilities, improve child feeding and caring practices, raise community awareness of health issues, link communities to health systems, and ‘ensure provision of mandated public health services’ via monthly meetings with Auxiliary Nurse Midwives and AWWs.
38 Table 1.3 Additional Orissa State Government and Government-linked NGO Health and Nutrition programmes
Programmes Key actors Intended beneficiaries Description Pustikar
Diwas (Feb 2009)
Anganwadi workers (AWWs), UNICEF, UK Department for International Development (DFID), United Nations Population Fund, National Rural Health Mission (NRHM), Accredited Social Health Activists (ASHAs), Norway India Partnership Initiative (NIPI)
Underweight and wasted children
This initiative aims to enhance the referral system for children identified as severely underweight or wasted during Village Health and Nutrition Days, including treatment referrals, nutrition advice, and medical checks at primary and community health centres as appropriate.
The Infant Mortality Rate Mission (2001-2012)
State Government, Integrated Child Development Services (ICDS), AWWs, Auxiliary Nurse Midwives (ANMs), NIPI, Doctors, allied health professionals
Pregnant and lactating women, newborn infants
AWWs and ANMs identify and transport mothers and neonates for urgent institutional care to reduce Infant and maternal deaths. They also use information, education and
communication strategies (IEC) e.g. for breastfeeding and maternal health. The mission also provides additional training for doctors and health workers in maternal care.
Mission Shakti, Orissa, (since 2001)
CARE India and Non –governmental organisations: APMAS, PRADAN, LOKADRUSTY, ACCESS, EDI and BISWA
Women/ young women
Aims to promote women’s empowerment by creating and strengthening self-help groups (SHGs). Technical advice is provided for income generation, to make credit/market links, resource mobilisation, business plan development,
39
block level, ‘Shakti Sahayikas’, trained for 6-months on micro-entrepreneurships. Activities are now becoming more health focused (e.g. linking with NRHM & ICDS).
Community mobilisation with women’s groups (Nov 2010)
Ekjut, DFID, state government, NRHM, ICDS, Technical Management Support Team
Women and children Piloting of community mobilisation with women’s groups in five villages for improved maternal and child health and nutrition. Bimonthly meetings, facilitated by AWWs and ASHAs, are used to discuss, prioritise and implement solutions to local health and nutrition problems.
Midday Meal Programme (1995-)
SHGs, state government, Department of School Education and Literacy
Primary school children School meal provision to government and government-aided primary school children aged 6-10 for 210 days per year. Aims to improve nutritional status, school enrolment and
attendance. SHGs prepare and deliver food, and procure rice. MAMATA
(2011)
State government, AWWs Pregnant women >19 years, first two pregnancies
A conditional cash transfer scheme (four instalments starting in pregnancy to 9 months post-partum) that aims to reduce maternal and neonatal mortality and improve health and nutrition. Pregnant women receive money for registering at the AWC, attending for ANC, and attending village health and nutrition days for immunisations.
40 Government community and mid-level health workers
There are three main cadres of community and mid-level health workers: Anganwadi Workers (AWWs), Auxiliary Nurse Midwives (ANMs), and Accredited Social Health Activists (ASHAs). Table 1.4 details their employee status, key roles and responsibilities, and their coverage in Jharkhand and Orissa. This highlights the considerable overlap between the roles of different health workers and their ever-expanding responsibilities. This has led to tension between different health worker cadres (Grover 2010). The proposed ICDS reforms include three workers (one ASHA and two AWWs) but the plans do not clearly allocate their roles in health and nutrition activities, so there is potential for more role overlap (Indian Planning Commission 2011).
There are also informal and voluntary community-health workers and Traditional Birth Attendants (TBAs) known as Dais. Although TBAs are recognised by the WHO and the Government of India, they are not sanctioned by the government and are paid by families to attend home births, mostly in rural areas. TBAs are usually self-taught or informally trained by family members or other Dais (Dadhich 2009). Some have undertaken a six-day government training in safe delivery and newborn care, but this has ceased since the promotion of institutional delivery and the JSY voucher scheme (Sagdopal 2009;Saravanan et al. 2011). Anganwadi workers
AWWs are central to the delivery of the ICDS. They have complained of being under-resourced (e.g. having non-functional weighing scales for growth monitoring) and many have experienced long delays in payment (Rajalakshmi 2010). Inadequate training has led to a poor understanding of the growth chart, resulting in data being sent elsewhere for interpretation, delaying feedback to caregivers and action for undernourished children (Rajalakshmi 2010). The excessive workload of AWWs has led to prioritisation of tasks that may be less important for the community but satisfy the demands of supervisors. In a qualitative study, AWWs perceived their most important task to be report writing, whilst growth monitoring was a much lower priority (Dongre et al. 2010). More streamlined data collection could improve data quality and allow AWWs more time with community members. Strengthening data management systems, such as computerising records, would allow easier analysis of programme performance and to plot nutrition trends for more responsive action (Gragnolati et al. 2006b).