Herausgeber GSWP
Prof. Dr. Sebastian Kinder • Prof. Dr. Rainer Rothfuß • PD Dr. Olaf Schnur • Jun.-Doz. Dr. Timo Sedelmeier • Dr. Gerhard Halder
10/2013
Migration driven by Electrification
The Impact of Electrification on
Growth Dynamics of Rural Areas
in Developing Countries
Hauke Diederich
Herausgeber GSWP
Prof. Dr. Sebastian Kinder • Prof. Dr. Rainer Rothfuß • PD Dr. Olaf Schnur • Jun.-Doz. Dr. Timo Sedelmeier • Dr. Gerhard Halder
Submitted as Diploma
thesis
on July 4
th2011
First Supervisor: Prof. Dr. Rainer Rothfuss
Second Supervisor
: Dr.
Gerhard Halder
Table of Contents
Table of Contents ... II List of Figures ... IV List of Tables ... V Abbreviations and acronyms ... VI Abstract ... VII Acknowledgments ... VIII
1 Introduction ... 1
2 Problem Statement ... 3
2.1 Energy and Poverty ... 3
2.2 Electrification as a Key Component of Rural Development ... 5
2.3 Rural Electrification in Nicaragua ... 8
2.4 Rural-urban Migration and its Assessment ... 11
3 Theoretical and Conceptual Basics ... 15
3.1 Migration... 15
3.1.1 Laws of Migration ... 15
3.1.2 Migration Patterns ... 16
3.1.3 Migration & Electrification ... 19
3.2 The Sustainable Livelihood Framework ... 20
3.2.1 Households’ livelihood assets ... 22
3.2.2 Transforming Structures and Processes ... 25
3.2.3 Vulnerability Context ... 26
3.2.4 Livelihood strategies ... 27
3.3 Adapting the Sustainable Livelihoods Framework ... 28
3.3.1 Geographic Capital ... 28
3.3.2 Sustainable Livelihoods and Migration ... 29
4 Research Design and Methodology ... 31
4.1 Research Questions and Hypotheses ... 31
4.2 Methodology ... 32
4.2.1 Scope and Scale of the Analysis ... 32
4.2.2 Methods of Analysis ... 33
4.2.3 Sequence of Work ... 37
4.3 Challenges Encountered ... 38
5 Findings ... 43
5.1 Case study I: Village with mini-hydro power ... 43
5.1.1 El Naranjo ... 43
5.1.2 Livelihood Analysis ... 46
5.1.3 Migration ... 62
5.2 Case Study II: Villages with Micro-hydro Power ... 68
5.2.1 Ocote Tuma ... 68
5.2.2 Livelihood Analysis ... 71
5.2.3 Migration ... 77
5.3 Case Study III: Village without Access to Electricity ... 80
5.3.1 Rosa Grande ... 80 5.3.2 Livelihood Analysis ... 82 5.3.3 Migration ... 87 5.4 Summary ... 89 6 Conclusions ... 95 References ... 99 Literature ... 99 Key Informants ... 107
Annex I: Maps of the case studies ... 108
Annex II: Questionnaires ... 111
List of Figures
Figure 1: Primary energy demand and HDI ... 5
Figure 2: Number of people without access to electricity 1970 – 2030, by region (2000) ... 5
Figure 3: HDI and electricity access, 2007 ... 6
Figure 4: Share of people without electricity access for developing countries, 2008 ... 9
Figure 5: Map of Nicaragua: Electrification rate ... 10
Figure 6: World rural and urban population, 1961-2050 (2008) ... 11
Figure 7: Share of population living in rural areas 1961-2050 (2008) ... 12
Figure 8: Mobility transition ... 17
Figure 9: Model of the Polarisation-Reversal-Hypothesis ... 18
Figure 10: The Sustainable Livelihood Framework ... 22
Figure 11: Number of total and surveyed households ... 36
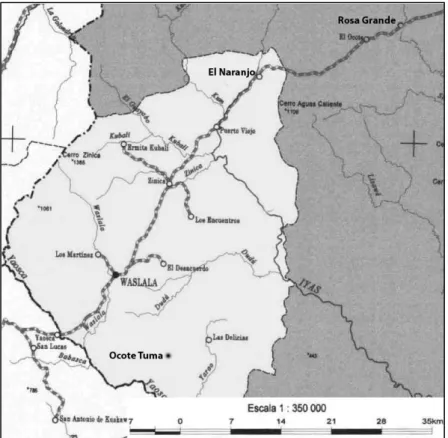
Figure 12: Map of Nicaragua and location of the Municipio de Waslala... 40
Figure 13: Map of the Municipio de Waslala ... 42
Figure 14: Photo of El Naranjo’s main road ... 43
Figure 15: Household’s income generation in El Naranjo (grouped) ... 45
Figure 16: El Naranjo: monthly electricity expenditures ... 47
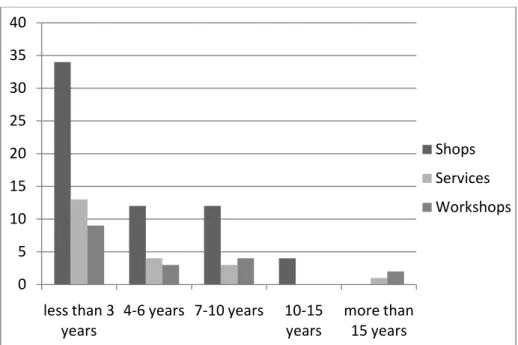
Figure 17: El Naranjo: Number of business, sorted by years of operation and type ... 52
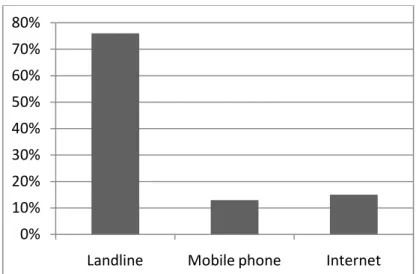
Figure 18: Share of households using ICT at least once a month ... 54
Figure 19: El Naranjo: Purpose of ICT use as a share of total technology user ... 54
Figure 20: El Naranjo: Approximate Changes in stock of staples and coffee (Jan-Dec) ... 55
Figure 21: El Naranjo: Duration of residency ... 63
Figure 22: El Naranjo: Recent migrants (<3 years), sorted by groups ... 64
Figure 23: El Naranjo: Main occupation of migrants ... 65
Figure 24: El Naranjo: Origin of recent migrants ... 66
Figure 25: El Naranjo: Importance of basic infrastructure to recent migrants... 67
Figure 26: El Naranjo: Importance of electricity to recent migrants in the home-business sector ... 68
Figure 27: Photo of Ocote Tuma’s centre ... 69
Figure 28: Ocote Tuma: Population grouped by source of income. ... 70
Figure 29: Ocote Tuma: Monthly electricity expenditures ... 71
Figure 30: Ocote Tuma: Years of operation (shops) ... 74
Figure 31: Ocote Tuma: Duration of residency ... 78
Figure 33: Ocote Tuma: Origin of recent migrants ... 80
Figure 34: Rosa Grande: Population grouped by source of income ... 81
Figure 35: Rosa Grande: Households’ means of lighting (n=59) ... 84
Figure 36: Rosa Grande: Years of operation (shops) ... 85
Figure 37: Rosa Grande: Duration of residency ... 87
Figure 38: Rosa Grande: recent migrants (< 3 years) by group ... 88
Figure 39: Rosa Grande: Origin of recent migrants (<3 years) ... 88
Figure 40: Rosa Grande: Importance of basic infrastructure to recent migrants ... 89
Figure 41: Capital assets endowment in all case studies ... 90
Figure 42: Map of El Naranjo: Source of income and migration ... 108
Figure 43: Map of Ocote Tuma: Source of income and migration ... 109
Figure 44: Map of Rosa Grande: Source of income and migration ... 110
List of Tables
Table 1: Energy and the MDGs ... 4Table 2: Rural-Urban net migration as a component of urban growth in Nicaragua, 1950-2000 ... 13
Table 3: Capital assets ... 25
Table 4: Trends, shocks and seasonality ... 27
Table 5: Number of farmer in Waslala and their land tendency ... 41
Table 6: El Naranjo: Male and female population break down ... 44
Table 7: Size of farms in El Naranjo and Municipio Waslala ... 48
Table 8: El Naranjo: Exposition and coping capacity ... 58
Table 9: El Naranjo: Male and female population ... 69
Table 10: Ocote Tuma: ICT’s use by group (as share of group) ... 75
Table 11: Rosa Grande: Male and female population ... 81
Table 12: Size of farms in Rosa Grande and the Municipio of Waslala ... 83
Table 13: Retrospective evaluation of the life/community situation before and after electrification (as % of the respective community) ... 93
Abbreviations and acronyms
EnDev GIZ’ Energising Development programme
FAO Food and Agricultural Organisation
FDI Foreign Direct Investment
FODIEN Fondo para el Desarrollo de la Industria Eléctrica Nacional
(National Fund for the Development of the Electricity Industry)
GDP Gross Domestic Product
GIZ Gesellschaft für Internationale Zusammenarbeit
(German Development Cooperation)
GTZ Gesellschaft für Technische Zusammenarbeit
(German Technical Cooperation)
HDI Human Development Index
ICS Improved cooking stove
ICT Information and communication technology
IDB Inter-American Development Bank
IDS UK’s Institute of Development Studies
IFAD International Fund for Agricultural Development
IMF International Monetary Fund
MCH Micro central hidroeléctrica (=micro-hydropower plant)
MDG UN’s Millennium Development Goals
MEM Ministerio de Energía y Minas
Ministry for Energy and Mining
mz Manzana (=0.68ha)
PCH Pequeña central hidroeléctrica (= mini-hydropower plant)
PRSP IMF’s Poverty Reduction Strategy Paper
PV Photovoltaic
RAAN Región Autónoma del Atlántico Norte
Autonomous Region of the Northern Atlantic
SHS Solar-Home-System
SL Sustainable Livelihood
SLF Sustainable Livelihood Framework
SIS “Second income shop”
Abstract
Despite the fact that there have been many electrification projects in developing countries, little research has been done on their impacts on migration patterns. Most countries experience considerable rural-urban migration with controversial effects on rural communities. This study investigates whether electrification contributes to sustainable rural development and, thus, slows down the rural exodus. The study reports on research findings from three case studies in rural Nicaragua, two with access to electricity and one without. It aims to provide insight into the scope and depth of impacts of electrification on rural livelihoods and the links between electricity provision and rural migration. Structured and semi-structured interviews as well as participatory rural appraisal techniques allowed for the gathering of qualitative and quantitative data. The Sustainable Livelihood Framework provided a conceptual framework to evaluate the impacts. It was found, that lighting provided positive impacts on the rural poor’s livelihood, but a higher one on the productive sector. All three case studies did not suffer from rural-urban migration, but have shown significant in-migration in the last years. However, the village without electricity supply attracted mostly farmers and day labourers from the nearby uplands, whereas the electrified communities attracted more businessmen and craftsmen. Thus, the study concludes that electrification is a key factor to incentivise skilled labour migration.
Acknowledgments
This thesis would not have been possible without the help, input, support and encouragement of several individuals. First, I would like to thank Gerhard Halder and Klaus Hornberger for their assistance and guidance throughout the research process. I have appreciated your patience and support. I would also like to thank Rainer Rothfuß for mentoring and sharing his insight, expertise and feedback.
My sincerest thanks goes to the staff at the German International Cooperation (GIZ). In particular, I would like to thank Carsten Hellpap and Robert Heine for their willingness to collaborate with me and for their help in organizing this project. A special thanks to my research assistants Alisson Figueroa and Oscar Gomez. I will forever remember the long and funny days in the field and the good conversations we shared together. A special thanks Is also needed for Nathalie Caraballo, Torsten Uhlig and Candace Vinke for their technical and linguistic support.
I would also like to extend my sincerest gratitude to the people of El Naranjo and Ocote Tuma for their friendly smiles, hospitality and willingness to share their culture with me. I was truly humbled by your kindness.
1
Introduction
In our modern society energy is a ubiquitous resource: after work one drives home leaving the car in the lighted garage with its electrically opened door. Then (s)he gets a cold beer out of the fridge and relaxes in front of the TV while simultaneously checking eMails and facebook. It is hard to imagine a life without these amenities.
Nevertheless, worldwide 1.4 billion people still lack access to electricity and mostly rely on firewood or kerosene as their only energy source. While most cities have electricity, energy scarcity is mainly experienced in rural areas of developing countries: nine out of ten people without access to electricity live in these regions [OECD/IEA 2010].
Average living conditions in rural areas of developing countries are generally described as poor. However, the global community has decided to change this through the Millennium Development Goals (MDG) – a blueprint for international development agreed upon by the United Nations member states that aims to half the population living in poverty by 2015 while at the same time ensuring environmental sustainability.. The International Fund for Agricultural Development (IFAD), an UN agency, estimates that “at least 70% of the world’s very poor people” live in rural areas [IFAD 2010:16]. Therefore, access to clean energy technologies is seen as a key component of rural development and several governmental projects support this in order to improve living conditions and ensure sustainable rural livelihoods.
The higher living standard of many city dwellers obviously encourages people to move from poor rural areas to the countries supposedly richer urban counterparts. This process, known as rural exodus, was also seen in Europe during the 19th century industrialization and nowadays is
observed in many developing countries. In particular, Latin America was affected by this trend when cities grew to megacities and many young, well educated people left rural areas. The proximity of the United States of America with its large labour market for immigrants further boosted this emigration.
How does electricity supply relate to this kind of migration? Does rural electrification significantly improve living standards and hence reduce rural-urban migration? Do rural villages with electricity supply become a “centre for development”? In order to investigate these questions I have selected three case studies in Nicaragua, a country were two out of
three households in rural areas lack electricity supply. However,, the current Sandinista government is making effort to improve the living standards of the rural poor. This study compares the economic and demographic development of three villages: one with a mini-hydropower plant (PCH, for its Spanish acronym), one with a micro-mini-hydropower plant (MCH) and one without electricity supply.
Chapter 2 provides an outline of the problem and gives an overview of electrification and migration in developing countries. The importance of electricity supply in rural development is briefly discussed, as well as, the linkage between energy and poverty. A short overview on the state of electrification in the research area and programmes targeting electricity supply is also provided.
The sustainable livelihood framework is used to systemise information and compare the case studies. The framework and its adaptation to the study’s needs are discussed in chapter 3. Furthermore, the section sets out the theoretical basics of migration and thus builds the foundation for further analysis.
On the basis of previous’ chapter’s discussion the research questions are defined and hypotheses are derived in chapter 4. Until today there are very few studies focussing on the impact of electrification on migration. Therefore, a mix of methods was used to investigate a broad range of livelihood aspects that need to be included in this study. The methods, as well as the scope and scale of the analysis are explained in depth in this section and the sequence of work is described. Last, a sketch of the Nicaraguan municipality of Waslala provides an overview of the study area and local circumstances
Chapter 5 is the core of the empirical work. An evaluation of dweller’s livelihoods in three villages is provided to form a basis for the analysis. People’s livelihood assets and strategies are assessed with regard to their migratory movements in the past years. A comparison of the three case studies completes this chapter.
Finally, in chapter 6 the basic hypothesis are reviewed and the results are summarised. This section integrates the findings into the theoretical framework and seeks to enhance and further develop the approaches used.
2
Problem Statement
2.1 Energy and Poverty
Sustainable energy supply, electricity and cooking energy, is crucial to development. However, there are discussions on the importance of electricity supply and its link to development. Before reviewing the role of energy for poverty reduction the topic is introduced by discussing the political dimension and access to energy-policies.
Energy is one of the big cross-over topics of the 21st century since it is an important element of sustainable development. However, in the 1990s international organizations began to focus on economic reforms largely due to the strength of the Bretton-Woods institutions and relative weakness of the UN at the time. Energy and especially access to energy was not seen as a priority since there was little chance to create profit-making-businesses through basic energy supply [Lucas 2003]. Today, energy-issues are back on the agenda. After a superb development of European manufacturer of renewable energy equipment, new markets needed to be developed. The MDGs, as the leading targets in the field of international development, attaches importance to the elimination of poverty and, thereby, draws the donor’s attention to rural issues. The “developed world” recognised that “[e]nergy plays a critical role in underpinning efforts to achieve the MDGs” [DFID 2002:7] and, finally, the World Bank and the International Monetary Fund (IMF) replaced their macroeconomic-focussed
Structural Adjustment Programs with more participatory and people-centred Poverty
Reduction Strategy Paper (PRSP), thus giving more attention to rural peoples needs [IDA 2009;
Modi et al. 2005; BMZ 2007].
There is no MDG goal specifically on energy; nonetheless, energy is crucial to many MDGs. But there is little doubt about that “[s]ustainable development will not become a reality unless close attention is paid to the services that energy provides” [Cherni/Hill 2009:646]. Table 1 summarises some contributions of modern energy supply to the MDGs. The term “modern energy” refers to both electricity supply and improved cooking stoves (ICS). Main advantages include lighting, refrigeration and improved information and communication technologies (ICT) on the electricity supply side and improved air quality and efficiency for the ICS.
Millennium Goal Importance of energy
1: Extreme poverty and hunger • Lighting: income generation in evening hours
• Machines increase productivity
• Staple foods need to be cooked
2: Universal primary education • Electricity is needed for better schooling with ICTs
• Lighting allows students to study in evening hours
3: Gender equality and women’s empowerment
• Reduced indoor air pollution
• Public lighting increases women’s security
• Efficient stoves may reduce women’s
workload, free time and thus increase income activities
4: Child mortality • Less respiratory infections through better indoor air quality
• Electricity permits water purification
5: Maternal health • Better medical services including medicine refrigeration (e.g. vaccines)
• Lower workload (less firewood is needed)
6: HIV/AIDS, malaria and other major diseases
• Lighting enables night availability of medical services
• Access to ICT may provide better health
information
7: Environmental sustainability • Decreased demand for firewood results in lower rates of deforestation
• Cleaner, more efficient fuels result in
reduced greenhouse gas emissions
Table 1: Energy and the MDGs
Sources: DFID 2002:80/81; GTZ 2009
Studies confirm that there is a relation between economic, as well as, human development and energy. Figure 1 relates the countries per capita primary energy demand to its Human Development Index (HDI)-score. It seems that an HDI score of 0.7 can be achieved with a very low energy demand (below one ton of oil equivalent (toe) per capita). Scores beyond 0.75 almost always require a higher per capita energy demand. At the same time a maximum is achieved when the energy demand reaches four toe per capita. Beyond this point no increased welfare (according to the HDI) is measured. Furthermore, the figure shows the difference between OECD and non-OECD countries: the former generate higher well-being with the same energy inputs. Thus, low energy inputs are not the only obstacle to development. Nevertheless
energy efficiency is still significantly lower in non-OECD countries and efforts to improve this situation can be expected to produce some positive results.
Figure 1: Primary energy demand and HDI
Source: adapted from Kumar, undated:6
2.2 Electrification as a Key Component of Rural Development
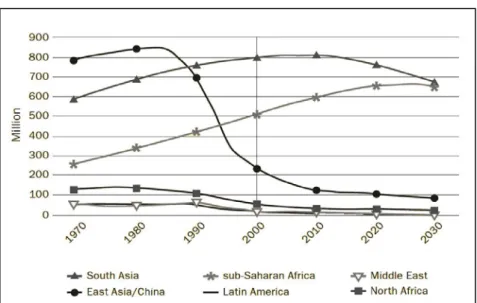
Electricity is the most versatile form of energy. It can easily be transformed into mechanical work (by an engine), heat (by an electric stove) or light (in a bulb). However, 1.4 billion people still do not have access to electricity [UNDP/WHO 2009]. This figure has hardly changed within the last 40 years although the regional distribution has In the 1970s almost four in five electricity lacking people lived on the Asian continent. Today it is “only” every second (see Figure 2), but the situation in sub-Saharan Africa is worse than ever, although the electrification rate is slowly increasing [IEA 2002:380].
Figure 2: Number of people without access to electricity 1970 – 2030, by region (2000)
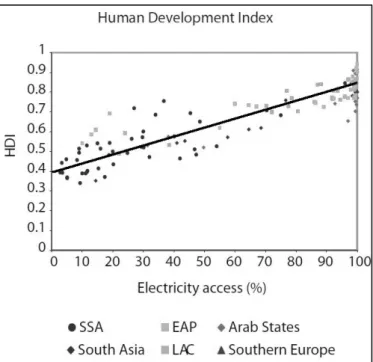
The relation between human development and energy consumption was discussed in the previous chapter. Similar relationships can be established between access to electricity and well-being. Figure 3 points out this linkage. However, in contrast to the exponential relationship between the HDI and the primary energy demand, this one is rather linear. This points out the importance of “access to energy”-programmes: regions without access hardly develop, while there is big range of development between countries with some energy consumption. Low electricity access rates mostly in sub-Saharan Africa (SSA) correlate with lower well-being and higher electrification rates usually align with higher levels of development. However, there are few in-depth evaluations of rural electrification programmes and their contribution to sustainable development [Ilskog 2008]
Looking at the micro-level, rural electrification has a high impact on development. In particular, the productive sector depends on electricity. The most obvious benefit of electrification, the light, has a huge impact on production: business hours are prolonged and production becomes more flexibile, which allows individuals to pursue different livelihood activities [Kooijman-van Dijk / Clancy 2010]. Other benefits include the development of new businesses; and the availability of electric machines and fridges to establish carpenter’s shops and sell refrigerated beverages.
Figure 3: HDI and electricity access, 2007
One study found that rural electrification with renewable energy technologies is not “considered to be directly pro-poor oriented” in any case [Kürschner et al. 2009:43]. Specifically, high costs of the technology itself (esp. if photovoltaics are used) and high complementary investments such as electric appliances exclude the very poor from profiting from the programmes [Valencia/Caspary 2008]. Yet, limited market for services and luxury goods limits the chances for poorer villages to benefit from the above stated advantages for the productive sector [Koijman-van Dijk 2008].
However, Cherni and Hill (2009) argue that there are several methodological difficulties linking energy supply and impacts on the livelihood. Typical economic measures are good for analysis in developed economies, but are “ill-suited” for assessing impacts in countries where large informal economies dominate. Economic measures, such as gross domestic product (GDP) per capita, cannot evaluate rural areas since most income is generated in subsistence farming and not measured by the GDP. Furthermore, few businesses in these areas are registered and the informal sector is predominant. Cherni and Hill conclude that “conventional methods of wealth assessment are unhelpful [...] when applied to rural livelihoods” [ibid: 645]. Therefore, it is crucial to complement quantitative measures with qualitative data and enhance the quality of plus verify quantitative data. The methodology of this study is further elaborated in section 4.2.
Obstacles to Rural Electrification
Rural electrification is a prominent element of nearly all national development strategies. However, it is quite a challenging task since there are several obstacles to overcome. Kaygusuz, a Turkish energy scientist, nicely summarises the “dilemma of rural electrification” as follows:
“The crux of the rural electrification dilemma is that electricity is an expensive, high-quality energy source that practically all rural people want but only some can afford.” [Kaygusuz 2011:942]
Furthermore, electricity is labelled and seen as a basic need and, hence, people expect and claim cheap electricity services. Indeed maintaining a reliable, high-quality service is expensive and despite high governmental subsidies electricity usually is more expensive than other basic services, such as water and schooling [ibid.]. Electricity access by itself is of little use, if no additional investments are made in appliances to profit from services electricity provides for
the productive use; often such complementary investments are lacking and, hence, the impact of electrification programmes is rather small [Valencia/Caspary 2008].
Another obstacle which is not only observed in developing countries is a lack of information of policy maker. This includes technical knowledge as well as the mechanisms for promoting renewable energy technologies and developing appropriate financing structures. As a result the normative framework and national regulation is underdeveloped and does not provide incentives for investments in renewable energy technology [AMUNIC 2008]
2.3 Rural Electrification in Nicaragua
Lack of electricity supply is a significant problem in poor economies, particularly in South Asia and sub-Saharan Africa (see Figure 2). On a relative scale, Latin America is well-off. However, there are intra-regional differences: Figure 4 illustrates the share of people without access to electricity globally. Most notable is the disparity between sub-Saharan Africa and South America: all countries in South America have electrification rates above 75% compared to rates below 50% in SSA [UNDP/WHO 2009:11].
In Latin America only three countries have rates below 75%: Haiti, Honduras and Nicaragua. However, the situation in, for instance, Nicaragua is getting better: in 1971 only 30% of Nicaraguan households had access to electricity. This rate increased gradually to 65% in 2009 or 390.000 dwellings without access to electricity. The Inter-American Development Bank (IDB) estimates that 50.000 of these are connected illegally to the grid which leaves 340.000 households without access to electricity [IDB 2010:1]. The supply situation in rural areas in Nicaragua is worse: in 2008 only 42% of the households could count on electricity [UNDP/WHO2009].
The Government of Nicaragua has set ambitious targets to accelerate electrification efforts. Central American countries agreed on a common goal: In 2020 nine in ten households should have access to electricity. In order to achieve this target, the government set a milestone of an electrification rate of 85% by 2014. At the same time, the power park fleet is to be changed: by 2020 renewable energy should account for 90% of the national electricity generation [IDB 2010:14]. Reaching this target will be a challenge: today’s electricity mix is dominated by conventional thermal power plants. Renewable energy sources (mainly hydropower and geothermal) represent only 25% of the mix, but, according to the IDB, only 5.2% of their full potential has been developed [INE 2011; IDB 2010]. According to Humberto Reyes, the director of the national Fund for the Development of the Power Industry, the focus will be on the development of hydropower. Only communities without access to a river or wide-spread communities will be electrified with solar home systems [GIZ 2011]. The most challenging task concerns the disparities within the country. Figure 5 (on p. 10) shows the discrepancies between the relatively well developed west of the country and large parts of the Northeast and East. In many of these areas less than one in five households has access to electricity.
Figure 4: Share of people without electricity access for developing countries, 2008
Figure 5: Map of Nicaragua: Electrification rate
Source: INIDE 2005c (adapted)
The biggest programme in the Nicaraguan electricity sector is the multi-donor Programa
Nacional de Electrificación Sostenible y Energía Renovable (PNESER). The programme has a
volume of US$ 381 million of which US$ 113 million is designated to rural electrification by grid extension. Within this project approximately 117.000 of the remaining 340.000 households will be connected to the electricity grid by 2014 [IDB 2010].
The German Development Cooperation (GIZ), formerly German Technical Cooperation (GTZ),
carries out rural electrification projects through the Dutch-German Partnership Energising
Development (EnDev). The programme is funded by the Dutch governmental development
cooperation (DGIS) and the German counterpart (BMZ). EnDev develops projects of rural electrification in more 22 countries in Africa, Asia and Latin America. In Nicaragua the
programme has three different components: a) grid extension and densification, b) Photovoltaics (PV) for households and c) Micro hydro power plants. Through this program ten thousand households have been provided with electricity. Two hydropower plants co-financed by the GIZ are used as case studies in this paper.
2.4 Rural-urban Migration and its Assessment
The world’s population is increasing and particularly towns and cities are growing. Fifty years ago two billion people lived in rural areas whereas only one billion people lived in their urban counterparts. However, intense urbanisation and rural exodus led to fast growing cities.
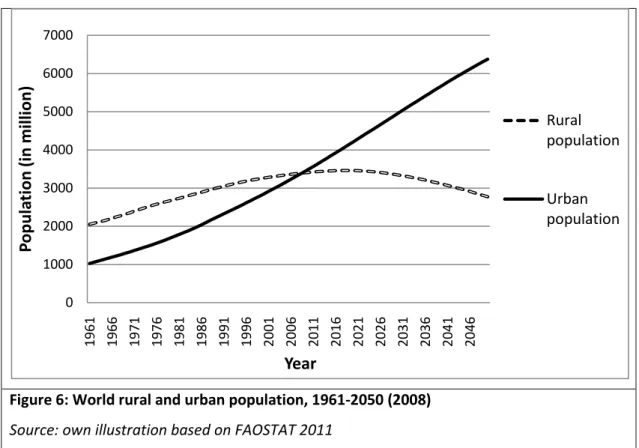
In 2009 the world’s urban population (3.43 billion) exceeded the rural population (3.40 billion) for the first time in history. As shown in Figure 6 the Food and Agricultural Organisation (FAO), a UN body, estimates that the number of rural dwellers will start to shrink around the year 2020 while urban areas will continue to grow [FAOSTAT 2011]. Although the total rural population is still growing, people tend to leave these areas. According to a FAO study some 800 million people left the countryside in the past 50 years and moved to a city [FAO 2006]. The situation is the same all over the world: the share of people living in rural areas is decreasing. However, this trend started earlier in some countries and later in others; in Europe
Figure 6: World rural and urban population, 1961-2050 (2008)
Source: own illustration based on FAOSTAT 2011 0 1000 2000 3000 4000 5000 6000 7000 1961 1966 1971 1976 1981 1986 1991 1996 2001 2006 2011 2016 2021 2026 2031 2036 2041 2046
Po
pu
la
tio
n (
in
m
illio
n)
Year
Rural population Urban populationthe urbanization started along with the industrialization. Labour was needed in the new industrial towns and the industrialization of the farming industry decreased the need for workers in the countryside. Thus, people left the land in search of a better life in the city. In Latin America, colonization led to disparities in living standards with relatively developed central regions and poor peripheral regions. Trade and economic policy after independence (e.g. liberalization and imports substituting industrialization) favoured investment in central regions and thereby sharpened internal disparities. At the same time urgently needed land reforms were never undertaken and rural populations continued to be discriminated against. These and other factors caused significant rural-urban migration and increased the urbanization level from 25% (1925) to 41.4% (1950) and eventually to 80% in 2008 [Cerrutti/Bertoncello 2003, FAOSTAT 2011, Gans 2001a].
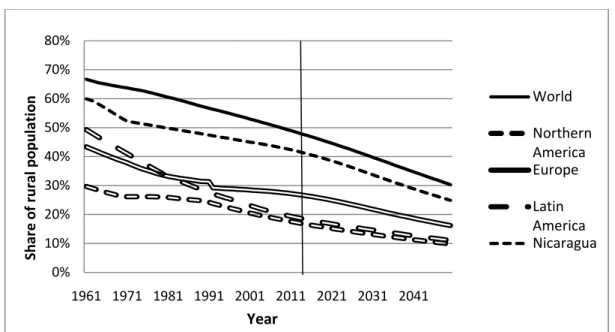
Today, Latin America is the second most urbanised region in the world after North America. This is largely due to development that has taken place in the past 50 years (see Figure 7). Latin American urbanization has outpaced European urbanization and the continent is getting close to being as urbanised as North America. Nowadays, only one in five people in Latin America live in the countryside. By 2050 it will be one in ten. Nevertheless, there are large differences between countries within the region -Argentina, Uruguay and Venezuela (among others) have already reached an urbanization level of more than 90%; whereas, in other countries such as Guyana and Guatemala, more than half of the population is rural [FAOSTAT 2011].
Figure 7: Share of population living in rural areas 1961-2050 (2008)
Source: Own illustration based on FAOSTAT 2011 0% 10% 20% 30% 40% 50% 60% 70% 80% 1961 1971 1981 1991 2001 2011 2021 2031 2041 Sha re of rura l po pul at io n Year World Northern America Europe Latin America Nicaragua
Many countries in Central America (especially the smaller countries) have historically faced rapidly changing political situations and armed conflicts. This is also reflected in their urbanization process. Table 2 illustrates the share of rural-urban net migration in urban growth in Nicaragua and Latin America. Nicaragua has had high rural-urban migration with a steeply decreasing share of rural population until 1970. The curve then flattens as net migration to urban areas decreases to almost nothing between 1980 and 1990. Why is this?
Internal conflicts in Nicaragua are certainly one reason. The 1979’s Sandinista revolution and the following contra-war against the Sandinistas from 1981 until 1990 may have held people back in the country or made them flee out of Nicaragua. The Sandinista government, contrary to the previous one, pursued a policy of rural development. A land reform guaranteed small scale farmer access to land and co-operatives were formed in the 1980s. Since small scale farming is more labour intensive, more peasants were needed in the country [Fitzgerald 1985]. Furthermore, Managua, Nicaragua’s capital and biggest city was completely destroyed by an earthquake in 1972 and then Somoza’s government did not show much interest in reconstructing urban dwellings. So, both push- and pull-factors both contributed to rural migration.
Rural exodus is typically associated with negative impacts. Generally, economists have a positive perception of the free flow of labour, whereas social scientists and the non-governmental sector tend to be more reserved. For instance, Momagri - a Paris-based development NGO, outlines the consequences for urban development and infrastructure which cannot “accommodate these populations”: “shanty towns represent most urban growth”, which absorb many of the migrants [Bianco, undated]. Furthermore they bring up high urban unemployment rates and unfavourable health conditions of slum dwellers. Growing cities have serious environmental problems and face socio-economic challenges: Coy and
1950 - 1960 1960 - 1970 1970 - 1980 1980 - 1990 1990 - 2000 Nicaragua 31.5 39.8 17.7 1.0 10.3 Latin America 46.4 45.8 42.3 41.6 38.4
Table 2: Rural-Urban net migration as a component of urban growth in Nicaragua, 1950-2000
Kraas (2003) mention for instance the development of “diffuse Zentralität” (diffuse centrality) and upcoming inhomogeneity of urban spaces, among other challenges for urban planning. Fast urbanization concentrates poverty in urban areas; the United Nations Population Fund (UNFPA) calls this “Urbanization of poverty”. However, the fund emphasises the chances for a development aid since people are easier to reach in cities than in dispersed settlements. Nonetheless, the overall evaluation of rural-urban migration seems to be negative [UNFPA 2007].
An economic view of the phenomenon is provided by the World Bank’s World Development
Report 2009 which is subtitled “Reshaping Economic Geography”. To explain the “clustering of
talented people” in cities basic economic laws are applied: “factors of production [...] move to places where they will earn the highest returns” and “skilled labor [...] earns higher economic return where it is abundant” [IBRD 2009:146]. Therefore, rural-urban migration is, economically, highly desirable in order to increase returns of inputs. The report suggests that there is no negative impact on the “stock of knowledge”, such as a brain drain, in rural areas. Quite contrary the authors argue that migrants keep “strong and active links” with their home community and “bring back ideas, knowledge, expectations of good governance and links to leading markets” [IBRD 2009:159]. The problem is seen in local policy-makers who have been “conditioned” by outdated literature on the danger of a rural exodus.
However, the World Bank only considers impacts of migration in the areas where (human) capital is accumulated. And, indeed, there is little doubt that “internal migration in LDCs [Least Developed Countries; H.D.] is welfare-improving in receiving regions” [de Haan 1999:29], but the effects on peripheral regions is much less studied. However, studies indicate that there are positive impacts of out-migration in the country. First, family migrants help overcome liquidity gaps and investment in means of production. Taylor and Lopez-Feldman [2010] showed that rural households in Mexico with family migrants “significantly increased incomes as well as the productivity of land” [ibid:82]. However, they also found that these positive effects take time to be realised and analysed in the long run.
3
Theoretical and Conceptual Basics
3.1 Migration
When thinking of migration, Europeans usually refer to foreigners from developing countries who migrate to Europe. The term is commonly used for these types of permanent and international movements of people, but migratory movements are not always permanent, nor international. In fact, the largest movement of people is non-permanently and internal: every year dozens of millions are travelling within China to be with their families for Chinese New Year. Sixty million Chinese people travelled on the last day of the 2006 festivities. Similar mass-movements occur on Thanksgiving in the US and on Christmas in European countries [IBRD 2009].
Despite the huge media coverage on international migration, it is not the largest flow of people. Instead, internal movements from “economically lagging to leading rural areas” [IBRD 2009:147] are more significant. Therefore, it is important to distinguish the different forms of migration carefully. Generally there are sub-types of both, internal and international migration and criteria for classifying types of migration: e.g. time (permanent or temporarily); distance (long or short); decision-making (voluntary or forced); reasons (e.g. economic or social) [Ellis 2003; Johnston 2000].
3.1.1 Laws of Migration
Migration and its analysis has been a key topic in geography for many years. The German-British geographer Ernst Georg Ravenstein was one of the founders of modern research on migration. In the late 19th century he wrote a series of papers titled “The laws of migration” in
which he derives a series of “laws” from his analysis of human movements in European countries [Ravenstein 1889]. Later Grigg [1977] summarised his work and condensed eleven basic laws of migration. Some of the “laws” that are relevant to this study are as follows: (1) “The majority of migrants go only a short distance” and (2) “[m]igration proceeds step by step” [Grigg 1977:42]. Thus, internal rural-rural and rural-urban migration is a first step, before transboundary migration might take place. These first two laws are widely accepted and countless times proved.
(10) “The major direction of migration is from the agricultural areas to the centres of industry and commerce”. This migration flow (9) “increases in volume as industries and commerce
develop and transport improves” [Grigg 1977:43]. However, the volume of migration from rural areas directly into industrial centres is “excessively small” and migration would still happen step-by-step. Ravenstein concludes that the main reasons of migration are economic. (11). While most of his “laws” were valid throughout the years, the last one remains to be controversial. Many authors point out that important causes for migration are not only economic ones, but based on social processes and historical and cultural criteria [see Bähr 2010; Ellis 2003; de Haan 1999]. Ravenstein based his research on British Census data spanning from 1841 until 1881. Later he included those from other European countries and North America [Ravenstein 1889].
3.1.2 Migration Patterns
As shown in the previous sections there are different reasons and forms of migration. However, these reasons are not fixed, but change over time. In order to analyse this change in migration patterns, two hypotheses will be used here: for the analysis of spatial mobility flows Zelinksy’s hypothesis of mobility transition and for the analysis of urban and spatial development Richardson’s polarisation-reversal-hypothesis.
Mobility Transition
Wilbur Zelinsky, an American geographer, analysed these different mobility patterns and found that “[t]here are definite patterned regularities in the growth of personal mobility through space-time”. He argues that these regularities are “an essential component of modernization process[es]” [Zelinsky 1971:221-22] and that they depend on the type of society, i.e. the stage of development of the country. Figure 8 illustrates these trends and the respective stages of modernization.
Zelinsky published his “Hypothesis of mobility transition”, which links the two “axiomatic items”: the theory of demographic transition and Ravenstein’s laws of migration. The theory of demographic transition suggests that the more developed a society is, the lower its death- and birth rates; this is why migration becomes a more crucial factor for demography [Caldwell et al. 2006; Zelinsky 1971].
Forms of mobility
1.International
2.Frontierward (internal) 3.Rural-urban
4.Urban-urban and intra-urban
5.Circulation 6.Urban-rural
Phases
I: The pre-modern traditional society II: The early transitional society III: The late transitional society
IV: The advanced society
V: A future super-advanced society
Figure 8: Mobility transition
Source: adapted from Gans 2001b and Zelinsky 1973
The first stage of a pre-modern traditional society shows constant and approximately equal levels of fertility- and death-rates. There is “little genuine residential migration” and only “limited circulation”. In the second phase, in Europe initiated by the Agricultural Revolution, the death rate starts to fall while fertility remains on the same level. This leads to an increase in population particularly in rural areas and therefore a “massive movement from the countryside to [old and new] cities” is recorded [Zelinsky 1971:230] as well as movements of rural pioneers to the agrarian frontier, if arable land is available. At the same time there is an outflow of people moving to foreign countries. Inter- and intra-urban migrations, as well as circulation show a significant growth [Caldwell et al. 2006; Zelinsky 1971].
The subsequent late transitional society is affected by a rapid decline in birth rate and, thus, a decelerated natural increase of population. Therefore, there is less pressure for migration and Zelinsky found declining movements in almost all categories. However, forms of mobility which are less influenced by population trends show a different picture: circulation (e.g. commuting into/out of a city) increases and urban-urban and intra-urban migration reaches a peak [ibid.]. Finally a stage is reached where both, fertility and death rates are low. Most “developed” countries are today in this phase of an advanced society. Migratory movements are basically the same as in the previous phase: intra-urban migration remains at a high level, whereas
other forms of permanent migration decrease and, partly, incline to zero. “Particularly the economic and pleasure-oriented” circulation becomes an important factor [Zelinsky 1971:230]. The upcoming phase, the super-advanced society, might be relevant in the future. Some authors argue that a birth rate that is too low to replace an area’s population will usher this new stage with a declining and ageing population [Caldwell et al. 2006; Galor 2005]. Zelinsky states that in this age “nearly all residential migration may be of intraurban and intraurban variety” [Zelinsky 1971:231]; since all other forms were already declining in earlier stages. Due to better information and communication technologies some migratory movements might be needless and circulation may decelerate, but remain at a high level. Counterurbanisation is added by some researches as a trend of urban-rural migration that already emerges in the fourth phase [Berry 1980; Gans 2001b]. It is caused by overcrowded cities and an “increase in the array of lifestyles” [Berry 1980:19].
Zelinsky’s hypothesis was widely discussed in the academic world. The work was found valuable as a framework for systemising migration patterns; however criticisms concern the missing link between mobility transition and technological, social and economic development and the unidirectional linkage to demographics [Bähr 2010]. Furthermore, it was noted that the approach is only a description and systematisation without explaining the illustrated development [inter alia Woods et al. 1993].
Polarisation Reversal
Analysing the development of “urban structures” in developing countries Harry W. Richardson found similar movements as the above mentioned on counterurbanization. He describes polarization reversal as “the turning point when spatial polarization trends [...] give away to a process of spatial dispersion out of the core region” [Richardson 1980:67]. The approach is based on centre-periphery model and similarly as Zelinsky’s hypothesis divided into five stages.
Figure 9: Model of the Polarisation-Reversal-Hypothesis
In the beginning, development and population tend to concentrate in a core region that is favoured by natural and/or political factors and guarantees economies of scale through accumulation of labour and capital. However, this centralization creates immense disparities between the core and the peri-core region and the “monocentric spatial structure becomes inefficient and costly” [ibid.]. In phase two, congestion and rising land costs trigger intraregional decentralization into the peri-core region. Figure 9 illustrates this change and the diversification in the allocation of foreign direct investments (FDI).
In the third phase, which is the crucial stage for Richardson, conditions emerge that make reallocation into other regions reasonable. This leads to the diffusion of technology and knowledge and to human migration from the core region to other regions. This interregional dispersion is the main feature of the polarization reversal hypothesis [Heineberg 2006; Richardson 1980]. In subsequent stages intra-regional decentralization occurs in the subregions, similarly to the early decentralization within the core region. Finally, a urban-industrial hierarchy emerges with little regional income disparity [ibid.].
3.1.3 Migration & Electrification
There is very little research done on the impact of electrification on migration and very few papers were published. In the previous chapter the contribution of electrification to rural development was discussed and, hence, this section mainly focuses on the interrelation of upgrading rural areas and migration.
Back in 1983 Rhodes, then working for the US Agency for International Development (USAID) in Manila, Philippines, worked on “Rural Development and Urban Migration” and asked “[c]an we keep them down on the farm?” [Rhodes 1983:34]. He founds that “there is little or no empirical evidence” that “rural electrification […] reduce[s] rural-urban migration”, apart from generating permanent maintenance staff, who stay in the area [ibid:52]. His conclusion is that despite potentially increased agricultural and rural enterprise productivity rural electrification increases the urban integration and therefore leads only to a “very weak slowing of rural-urban migration in both the short and long run” [ibid:58].
Another study by Bilsborrow et al. [1987] analyses the impact of different variables that may lead to rural-out migration (e.g. off-farm employment opportunities, education, age, electricity
supply) in Ecuador applying quantitative metrics. The findings are quite similar to Rhodes’: “no pattern is observed between electrification and migration” [Bilsborrow et al., 1987:199]. However younger studies suggest the contrary: electrification usually involves an improvement in the infrastructure of information and communication technologies (ICT). Several studies investigate the impact of these improvements on migration [LaRose et al. 2007; Moon et al. 2010]. Although the studies focuses on rural America and South Korea, respectively, they found a significant influence of improved internet infrastructure on migration intentions: Elder people appreciated the new technology as an upgrading of their community and tend to stay there, whereas younger rural dwellers realised job opportunities in the cities and, thus, were more likely to leave for urban areas [Moon et al. 2010].
Furthermore an important factor for rural-urban migration is the alluring urban lifestyle; and electricity plays an important role since its unavailability “is among the most visible signs of rural–urban and rural rich–poor socioeconomic gaps” [Kaygusuz 2011:942]. Therefore, electrification may decrease rural-urban-migration since one of the “most visible signs” is eliminated. On the other hand, people might expect a “more fulfilling way of life” in a city [Benson/O’Reilly 2009:608]; this is what is discussed, mostly in sociology, as “lifestyle migration”.
3.2 The Sustainable Livelihood Framework
The impact of electrification is universal and influences almost all areas of rural livelihoods. Therefore, the sustainable livelihood framework (SLF) was chosen for structuring data and guiding analysis. The approach is a powerful tool to improve the understanding of livelihoods, particularly those of the poor. It provides a broader view of poverty than an economic-centred one. The approach is rooted in literature on food insecurity and famines (see Sen 1981). This is why it provides strength for understanding vulnerability.
UK’s Institute of Development Studies (IDS) developed the SLF in the early 1990s and published the most important early papers [Chambers/Conway 1991, Scoones 1998]. Later it was applied in development research and by international development agencies, NGOs and UN agencies. Particularly the British Department for International Development (DFID) championed and refined the approach. DFID developed Sustainable Livelihoods Guidance Sheets which “aim to
stimulate reflection and learning”, as well as, give assistance to development practitioners [DFID 1999a:2].
But what is a sustainable livelihood? In his definition Scoones (1998) refers to the both single terms “sustainability” and “livelihood”:
“A livelihood comprises the capabilities, assets (stores, resources, claims and access) and activities required for a means of living: a livelihood is sustainable if it can cope with and recover from stress and shocks, maintain or enhance its capabilities and assets, while not undermining the natural resource base.“ [Scoones 1998:5 drawing from Chambers/Conway 1991]”
This is an adapted version of the definition from this study. Operationalising this connection of
sustainability and rural livelihoods the framework suggests that a person's livelihood is
composed of five capital assets (human, social, physical, natural and financial capital) which are the starting point for developing a livelihood strategy. The context for developing this strategy is determined by the household’s vulnerability (grouped to shocks, trends and seasonality) and the institutional set-up (grouped into structures and processes). Figure 10 illustrates the interrelation of the framework’s components. This section briefly explains each of the components and its functions within the framework.
The framework is designed to be used at all stages of the programme cycle and provides different benefits for the single steps. In practice it is widely used in the development world for project planning and policy analysis. However, the actual application in project monitoring and evaluation is limited [DFID 2010; Hostetler 2005; Koijman-van Dijk 2008].
Figure 10: The Sustainable Livelihood Framework
Source: Own illustration based on DFID 1999b:1 and Scoones 1998
3.2.1 Households’ livelihood assets
One core principle of the SLF is that it is people-centred and holistic; therefore it seeks to achieve a complete understanding of people’s capital endowments, whether tangible or not. In order to yield a livelihood outcome, a combination of more than one asset is needed. A rural dweller that is well endowed with financial capital, but lacks arable land, will not have a high livelihood outcome. In particular, poor people need to combine everything they have to satisfy their needs. Scoones identified four different types of capital: Natural capital, economic or
financial capital, human capital and social capital, but “other forms of ‘capital’ can be
identified”, he added [Scoones 1998:8]. That is what DFID did when they added physical
capital to the list and, thus created the asset pentagon. The capital assets are described as
follows and summarised in Table 3 (p. 25).
Human Capital
The term human capital represents all skills and knowledge which are needed to pursue a livelihood strategy as well as good health and the ability to work. Scoones summarises human capital for household-level analysis as the “amount and quality of labour available” [ibid:7].
While it is part of the asset pentagon and therefore the basis for achieving a livelihood outcome, human capital usually is an end in itself: good health conditions and access to education are core dimensions of human development and the MDGs, as well. However, human capital is needed in order to make use of other types of capital assets; without knowledge how to make use of one’s assets, any asset endowment is useless [ibid; DFID 1999b].
Social Capital
Social Capital is probably the most debated capital asset. It is described as “social resources [...] upon which people draw when pursuing different livelihood strategies” [ibid:8]. This includes:
- Networks (vertical and horizontal) that increase people’s ability to work together and
to guarantee better access to institutions;
- Formalised groups with commonly accepted rules, norms and sanctions; and
- Relationships of trust that facilitate co-operation and form informal safety nets.
It is mainly because of social capital that the relation of household assets and Transforming
Structures and Processes is two ways. Structures and processes are formed through social
capital. In this interrelation political capital, having and using the right to partake in decision-making, plays a major role. Some authors argue that political capital should be the sixth capital asset in a capital hexagon (mainly championed by the Overseas Development Institute; see Baumann 2000; Farrington et al. 1999). In this study, political capital will be included in social capital. Although it definitely is important, all aspects of importance to rural livelihoods can be included into the social capital’s networks-groups-relationship scheme or into the
Transforming Structures and Processes. Social capital is important when it comes to economic
relations. Mutual trust increases the efficiency and lowers the cost of working together. Networks and member-associations are also a convenient tool for community governance and to reduce the depletion of public goods, such as common infrastructure (physical capital) and shared resources (natural capital). Non-members, potential free-riders, can be banned from using these resources, while all members commonly agree on terms of use [DFID 1999b; Bowles/Gintis 2002; Scoones 1998].
Natural Capital
The term natural capital usually refers to the natural resource stocks and environmental services (e.g. hydrological cycle, pollution sinks), which are used to generate livelihood outcomes. This capital asset includes tangible and intangible goods as well as public and private ones. Therefore, everything from trees for firewood and construction to the atmosphere and the biodiversity is included. There are close links to the vulnerability context, since stresses and/or shocks are often related to the environment and therefore, to natural
capital. In rural areas most people live from farming or fishing and need to gather firewood for
cooking. Air pollution, for instance, compromises people’s health and hence the ability to pursue certain livelihood strategies. For these reasons Transforming Structures and Processes are needed to support people in sustainably using natural capital [Scoones 1998; DFID 1999b].
Physical Capital
All basic infrastructure and means of production that contribute to livelihoods are grouped in this category. Generally, infrastructure (e.g. transportation, water & energy supply, sanitation, access to information) refers to public goods. However, many of these services can only be accessed for a fee. Housing is one of the few infrastructure goods which are, just like the producer goods, privately owned. Basic infrastructure is a core dimension of rural development. Physical capital is a pre-condition for increasing other capital assets; without adequate infrastructure time is allocated to non-productive activities such as the collection of firewood and water and without access to appropriate ICT knowledge human capital cannot be generated. Thus, means of production are needed to increase peasant’s productivity [DFID 1999b].
Financial capital
Financial capital is essential for any livelihood strategy.. Financial capital includes stocks as well as inflows of money. Remittances and access to credits are covered in this category, as well. Financial capital is the most versatile capital asset since it can be (more or less easily) converted into other forms of capital, how and at what “exchange rate” is determined by the
Transforming Structures and Processes. This context itself can be influenced by financial capital
which is transformed into political power. Financial capital can be directly employed to achieve livelihood outcomes, when used to buy shelter or food [Scoones 1998; DFID 1999b].
Capital asset Description Importance
Human Skills, knowledge, ability to labour and good health which allow pursuing a livelihood strategy
Needed to make use of other types of capital
Intrinsic value
Social Networks, formalised groups and relationships of trust upon which people draw pursuing their livelihood strategy
Improved economic efficiency Community governance
To avoid “free-rider” problems with public goods
Natural Stocks of natural resources Environmental services
Rural dwellers usually derive all or most of their income from resource-based activities Links to human health and
vulnerability
Physical Basic infrastructure Producer goods
Pre-condition for generation of other capital assets
Producer goods increase farm efficiency
Financial Available stock and inflow of money Essential for every livelihood strategy Most versatile capital asset
Directly employed to achieve livelihood outcomes
Table 3: Capital assets
Sources: DFID 1999b; Bowles/Gintis 2002 and Scoones 1998
3.2.2 Transforming Structures and Processes
Institutions, organizations, policies and legislation shape livelihoods within the framework. They determine access to and terms of exchange between livelihood assets as well as returns of livelihood strategies.
Structures
DFID describes structures as the “hardware of the framework” and includes all organizations, private as well as public, which are responsible for or active in legislation and policy or any kind of economic activity (e.g. delivery of services, trade). Structures can be identified at any level (vertical structures) and in different breadth (horizontal structures). This differentiation is most
obvious in governing organizations since they span from the local (sub-)mayor to supranational organizations and from the more general mayor’s office to specialised local governmental organizations, such as the national extension service. Structures are important to make processes work, to enact and enforce laws, to build and regulate markets and to arrange social life in communities. The absence of well working structures is a large obstacle to development. Within these structures it is important that the poor are represented and affordable services are provided to them. Development agencies further promote private sector development in order to increase the efficiency of markets [DFID 1999b].
Processes
If structures are the hardware of a livelihood system, processes are the software; they
determine how the agents – structures and people- work and interact. Several sub-categories are identified within processes. Policies provide a framework for development agencies and inform the process of legislation. North, a political scientist, therefore describes institutions as “the rules of the game in a society” [North 1990:3]. These rules are informal practices that are created and accepted by the agents to reduce uncertainties and create regularities which in turn increase the market’s efficiency. The institutions are created within a framework of social norms and beliefs (culture), which are part of the processes itself.
3.2.3 Vulnerability Context
Obviously, livelihoods are influenced by their environment. Capital assets are affected by the vulnerability context and the decision to pursue a certain livelihood strategy is usually taken considering its vulnerability. Vulnerability is subdivided into three widely accepted groups: Shocks, trends and seasonality. The latter two are usually universal, whereas the first one may be idiosyncratic. In their first description of rural livelihood systems Chambers and Conway [1991] described stresses, which later were disaggregated into trends and seasonality, and shocks as the following:
“Stresses are pressures which are typically continuous and cumulative, predictable and distressing, such as season shortages, rising populations or declining resources, while shocks are impacts which are typically sudden, unpredictable and traumatic, such as fires, floods and epidemics.” [Conway 1987; Conway/Barbier 1990 according to Chambers and Conway 1991:10]
Examples Effects
Trends Population trend Economic trend Technological trend
Slow & steady
Usually more predictable
Important influence on output of livelihood strategy
Shocks Health shocks and death (human or livestock)
Natural disaster/shocks Conflict (armed or unarmed) Economic shocks
Directly destroys assets
Unpredictable with usually harsh consequences
International economic shocks may trickle down
Seasonality Of prices Of harvest
Of employment opportunities
Magnitude is less predictable
Enduring source of hardship for the poor
Causes insecurity
Table 4: Trends, shocks and seasonality
Source: adapted from DFID 1999b
However, not all of the above listed examples are negative: trends may be either positive or negative. A trend can favour one group and endanger another one at the same time. Particularly the poor are more often unable to develop a livelihood strategy that transforms trends into positive livelihood outcomes, whether the trend is predicted or not. Generally their livelihood strategy is rather unable to cope with stresses, while others with a different composition of assets are more resilient. In principle, the vulnerability context cannot be influenced; it “lies furthest outside people’s control” [DFID 1999b:4]. Changes of vulnerability are in most cases a result of alterations of the Transforming Structures and Processes (e.g. policy changes). Turning it around, one aim of the SL approach is to build resilience and/or reduce vulnerability through favouring structures and processes [Scoones 1998; DFID 1999b]
3.2.4 Livelihood strategies
People seek to develop a livelihood strategy that is as resilient as possible. Despite the enormous diversity of livelihood strategies on all levels (individuals, households, communities...) Scoones divided them into three broad categories [Scoones 1998]:
- Agricultural intensification or extensification, either capital-led (drawing on financial
capital) both strategies require significant amounts of natural capital (farmland and if needed water for irrigation)
- Livelihood diversification to widen the income earning portfolio, particularly as a
coping strategy in order to build resilience
- Migration, either voluntary (e.g. for employment opportunities or to build a business)
or (quasi-) involuntary (“in need”-situation, marriage, eviction or displacement)
However, pursuing a certain strategy is not a static, but dynamic process. Different strategies are combined to a “livelihood portfolio” of a household: different household members have different income sources and may live in different places (permanently or temporarily). For an analysis the underlying livelihood goals should be identified.
3.3 Adapting the Sustainable Livelihoods Framework
The SLF provides a good framework for collecting and organising data, however some adjustments have to be made to meet the specific requirements for this study. This chapter outlines two of them: the geographic capital as well as the intensification of the linkage with migration issues.
3.3.1 Geographic Capital
Bird and Shepherd [2003] introduced geographic capital as a new dimension to highlight the importance of “the spatial patterning of disadvantage” [ibid.:593]. It includes “physical or frictional distance” from economic or political centres, urban agglomerations, coast and/or communication links. The geographical capital is not thought to be a sixth (or even seventh) capital asset. However, Hostetler, a Canadian geographer, includes the geographic capital into the asset pentagon [Hostetler 2005:117]. The entity of “the natural, physical, social and human capital of an area” builds the geographic capital, which in turn result in “spatial poverty traps” if it is low [Bird/Shepherd 2003:592]. These spatial poverty traps are both, a result of development policy and an obstacle to them. Studies have shown, that “[d]eficits in geographic capital were intervening factors in limiting the effectiveness” of development projects [Hostetler 2005:225; Bird et al. 2010a].
Bird et al. (2010b) suggest several factors that contribute to spatial poverty gaps:
- Poor agro-ecology can hinder the people from fulfilling their basic livelihood needs
- Institutional, political or governance failures occur, if remote and hardly accessible
areas are out-of-reach for governmental officers and therefore have a “more weakly articulated contract with citizens”. This may compromise service delivery and hamper its monitoring and effectiveness.
- Stigma and exclusion: Stereotypes based on ethnicity, race, language, religion or
culture may lead to discrimination against people living in certain areas. This is the main factor for spatial poverty gaps in urban and peri-urban areas.
- Physical isolation and inadequate infrastructure: low population densities lead to
higher per-capita-cost for basic services. A key explanatory factor for spatial inequality within countries is a lack of public infrastructure in remote areas [Kanbur/Venables 2005 according to Bird et al. 2010b].
Spatial poverty gaps are major barriers to development for communities, particularly in rural areas of developing countries, and will be included in this study. However, the existence of these gaps does not vary between single households in a village and therefore they should not be seen as capital assets which vary by household. Spatial poverty gaps shape the way in which processes work, determine and restrict livelihood options. Therefore, geographic capital will be discussed in the section on Transforming Structures and Processes.
3.3.2 Sustainable Livelihoods and Migration
As shown before, movements of people are an important policy issue on all levels. However, the impact of such movements is poorly understood and in turn inadequate policy programmes are designed. Livelihood approaches can be used to develop a better understanding of the rural poor’s reasons for migration. People’s decisions are very complex and vary between gender, generation, social status and individual situation. Movements do not have sectoral, nor geographical borders: people switch freely between professions and countries without being held back by professional or language barriers. For instance, many Latin American immigrants in the US do not speak English and sustain themselves within the Latin community. In the SLF migration can be understood as movement of human capital (and