Persistent link: http://hdl.handle.net/2345/bc-ir:108369
This work is posted on eScholarship@BC,
Boston College University Libraries.
Boston College Electronic Thesis or Dissertation, 2019
Copyright is held by the author. This work is licensed under a Creative Commons Attribution-NonCommercial-NoDerivatives 4.0 International License (http://
creativecommons.org/licenses/by-nc-nd/4.0).
Should I Stay or Should I Go?: Exploring
the Predictors of Beginning Teacher
Turnover in Secondary Public Schools
Author: Caroline Elizabeth Vuilleumier
Boston College
Lynch School of Education
Department of
Measurement, Evaluation, Statistics, and Assessment
SHOULD I STAY OR SHOULD I GO?
EXPLORING THE PREDICTORS OF BEGINNING TEACHER
TURNOVER IN SECONDARY PUBLIC SCHOOLS
Dissertation by
CAROLINE E. VUILLEUMIER
submitted in partial fulfillment
of the requirements for the degree of
Doctor of Philosophy
SHOULD I STAY OR SHOULD I GO?
EXPLORING THE PREDICTORS OF BEGINNING TEACHER TURNOVER IN SECONDARY PUBLIC SCHOOLS
Caroline E. Vuilleumier, Author Laura M. O’Dwyer, Chair
In recent decades, the plight of early career teacher turnover has had significant financial ramifications for our nation’s schools and has posed a serious threat to
achieving educational equity, with the most disadvantaged schools experiencing the highest rates of turnover. Using data collected from the Beginning Teacher Longitudinal Survey, this study employed discrete-time competing risks survival analysis to explore the first-year experiences of public middle and high school teachers as predictors of their career decisions to stay in their current school, move to a new school, or leave the
profession across the first five years of their career. Four facets were conceived as characterizing teachers’ first-year experiences: 1) policies and programs for first-year teachers provided by the administration including mentoring and induction, 2)
perceptions of their preparedness to teach, 3) perceptions of school climate and workplace conditions, and 4) satisfaction with teaching.
The research questions are:
1. What are the first-year experiences for teachers in the sample and how do they compare between teachers who are retained in their first school placements and teachers who voluntarily or involuntarily turn over in later years?
2. What first-year teacher experiences predict voluntary and involuntary turnover at the end of years 1, 2, 3, and 4? And, how does satisfaction with teaching in the
first year interact with the three other facets of the first-year experience to predict voluntary and involuntary turnover across the early career window?
Findings suggest there may be differences in the mechanisms that drive the moving and leaving phenomena, suggesting that policymakers treat the two turnover pathways as separate problems requiring separate solutions. Furthermore, findings suggest there may be more policy-amendable variables that can be manipulated in the first year of teaching to prevent leaving than there are to prevent moving, implying that curbing rates of moving to minimize the localized impacts of teacher migration to other schools may be more challenging than reducing rates of leaving the profession.
i
DEDICATION
To my husband, Derek. I have no words to express my gratitude for your constant encouragement and unwavering support throughout this doctoral journey. I could never have done this without you. Here’s to receiving mail addressed to “Dr. Vuilleumier and Mr. Welch”.
To my parents, Leslie and Paul. There’s something about this family and taking seven years to get things done. Apparently, slow and steady wins the race, and I learned from the best. You laid the foundation for all of this. Thank you.
To my grandmother, Rosemary. She was so proud of me when I started this, and although she did not live to see me finish, I know she would be bragging to all the ladies who play Bridge that there is finally a doctor in the family.
ii
ACKNOWLEDGEMENTS
Throughout this process I have learned that writing a dissertation takes a village, and I am extremely grateful to my village for the past seven years of support.
First and foremost, I would like to thank my committee for their constant
guidance and for pushing me to grow. Dr. Laura O’Dwyer went above and beyond in her role as dissertation chair, offering up innumerable hours of her time to workshop my writing, read countless drafts, provide moral support, and respond to horribly timed emails often sent late at night or on holidays. I feel incredibly lucky to have had the opportunity to learn from such a generous, thoughtful, and brilliant academic.
Way back in the spring of 2011, Dr. Larry Ludlow got me hooked on statistics in his ED460 class. His passion for research, so evident in his teaching, inspired me to apply to the ERME (now MESA) program to purse a PhD. Nearly a decade later, I am
incredibly thankful for the mentorship he has provided me throughout my doctoral studies and development as a researcher.
When I initially approached Dr. Patrick Proctor about serving as a reader on my committee, his response was, “This sounds really cool.” His words became a mantra for me as I proceeded to spend many hours alone in a small windowless room working with my data, running models, and geeking out. I have thoroughly enjoyed sharing my scholarship with Dr. Proctor and am so grateful for his positivity and support. This was, in fact, a pretty “cool” experience.
Kelsey Ruth Ericksen Klein has been my PhD partner in crime since day one. We survived coursework, comprehensive exams, and dissertation hurdles while attached at
iii the hip. Her companionship has meant the world to me as we have faced the many
challenges of doctoral work together. Kelsey, you are my sister, and I love you.
The ERME Wives have made the past seven years the most memorable and fun chapter of my life to date. Thank you to Courtney Castle, Avery Newton, Jillian
Gomolka, Maria Baez, and Clair Johnson for your friendship and for all the laughs. Jordan Lawson played an integral role in the completion of this work teaching me how to program in R. Working alongside him at City Connects was an invaluable
learning experience for me. I miss our deep dives into data mysteries, long debates about statistical models, and never-ending quests to find free food on campus. Jordan, you are a gentleman and a scholar.
For the past three years, Dr. Deborah Manegold has provided me with a space to deal with and defeat my dissertation demons. Thank you for helping me to engage in meaningful self-reflection, stay curious, and come to the realization that I needed to do this for me.
Finally, to my family – whether you’re a Vuilleumier or a Welch. Thank you for the constant calls and texts to check-in. Thank you for the genuine enthusiasm when I accomplished even the smallest things. Thank you for the long heart-to-hearts reminding me at my lowest points that you believed in me. Thank you for staying positive even when I was a total grump working on my dissertation during family vacations and over holidays. But, most importantly, thank you for nudging me along inch by inch while letting me find my own way down this long, hard road. I feel so blessed to be a part of these awesome, uplifting families.
iv
Researcher Positionality
The decision to investigate early career secondary teacher turnover for this dissertation was born out of my own personal experiences with leaving the profession. 2011-2012 marked my fourth year of teaching math in a public high school in
Massachusetts. From September through June of that school year, I struggled to answer one burning question, the title of this dissertation, “Should I Stay or Should I Go?” Should I stay in the classroom? After all, I did have a bachelors in Secondary Education, a masters in Curriculum and Instruction, and tenure. Or should I walk away from
teaching altogether and pursue a PhD instead? My decision to leave teaching in 2012 was not easy, but my own internal struggle with making that decision afforded me a unique personal perspective into the experiences of the very teachers I studied in this work.
Throughout this research, I have seen myself in the data as both the teacher who left the profession in June 2012, and the teacher who recently returned to it in September 2018. After six years of graduate school, I realized how much I missed working with high school students and now find myself back in the classroom, a first-year teacher all over again, teaching math at a different public high school in Massachusetts. This makes me both a “Leaver” and a “Returner.”. And although the conceptual framework for this research was grounded in the literature, I have to acknowledge, up front, that my personal experiences with being a first-year teacher and wrestling with turnover decisions in my early career influenced the lens with which I have framed this work and its implications.
v
TABLE OF CONTENTS
CHAPTER 1: INTRODUCTION ... 1
RESEARCH QUESTIONS ... 4
METHODOLOGY ... 4
Data Sources and Sample ... 5
Conceptual Model and Variables ... 6
Analysis Plan ... 7
RQ1. What are the first-year experiences for teachers in the sample and how do they compare across teachers who are retained in their first school placements (i.e. Stayers) and teachers who voluntarily or involuntarily turn over (i.e. Movers and Leavers) in later years? ... 7
RQ2. What first-year teacher experiences predict voluntary and involuntary turnover at the end of years 1, 2, 3, and 4? And, how does satisfaction with teaching in the first year interact with the three other facets of the first-year experience (e.g. act as a moderator) to predict voluntary and involuntary turnover across the early career window of years 1 through 4? ... 8
SIGNIFICANCE OF THE STUDY ... 10
Justifications for Scope ... 10
Justifications for Methodology ... 12
CHAPTER 2: REVIEW OF THE LITERATURE ... 13
THE BIG PICTURE OF TEACHER TURNOVER ... 15
Financial Impacts Nationally and Locally ... 15
vi
Diminished teacher quality. ... 17
Decreased student achievement... 18
Turnover as a threat to educational policies for equity. ... 19
Consequences for the Health of Schools ... 19
THE PROBLEM WITH EARLY CAREER ATTRITION ... 21
Misguided Policy Responses to Beginning Teacher Turnover ... 24
The Importance of Teachers’ First-year Experiences ... 26
Supports and programs for first-year teachers. ... 28
Preparedness to teach. ... 29
School climate and workplace conditions. ... 30
Job satisfaction. ... 31
The Career Decisions of Beginning Secondary School Teachers ... 33
THEORETICAL PERSPECTIVES ON TURNOVER... 34
LABOR MARKET PERSPECTIVES ON RETENTION,ATTRITION, AND MOBILITY ... 36
THE CONCEPTUAL MODEL... 38
HYPOTHESES ... 42
CONCLUSION... 43
CHAPTER 3: RESEARCH DESIGN... 44
DATA SOURCES ... 44
Background and Purpose... 45
Instrumentation by Wave ... 47
BTLS Sampling Frame and Sample Selection... 49
vii Response Rates ... 54 Imputation Procedures ... 56 SAMPLE STRUCTURE ... 56 Sampling Weights ... 60 Replicate Weights ... 60 Missing Data ... 60 VARIABLES ... 61 Outcomes ... 62 Predictors ... 65
First-year teacher programs and policies. ... 65
Perceptions of preparedness to teach. ... 65
Perceptions of school climate. ... 67
Satisfaction with teaching. ... 70
Covariates. ... 70
Multicollinearity. ... 73
DATA ANALYSIS AND MODELS ... 73
RQ1. What are the first-year experiences for teachers in the sample and how do they compare between teachers who are retained in their first school placements (i.e. Stayers) and teachers who voluntarily or involuntarily turn over in later years (i.e. Movers and Leavers)? ... 73 RQ2. What first-year teacher experiences predict voluntary and involuntary
turnover at the end of years 1, 2, 3, and 4? And, how does satisfaction with teaching in the first year interact with the three other facets of the first-year experience (e.g.
viii
act as a moderator) to predict voluntary and involuntary turnover across the early
career window of years 1 through 4? ... 74
Survival analysis. ... 74
Censoring. ... 75
Competing risks. ... 77
Continuous versus discrete time ... 78
Survival and hazard functions. ... 80
The logit-hazard model. ... 84
The baseline logit-hazard. ... 85
The discrete-time hazards model. ... 87
Person-year data format. ... 87
Modeling competing risks. ... 91
Model-building. ... 94
Model fit characteristics. ... 99
Classification efficacy... 100
Calculating effect sizes. ... 100
CONCLUSION... 102
CHAPTER 4: RESULTS ... 103
SAMPLE DESCRIPTION ... 104
Teacher Characteristics... 104
School Characteristics ... 109
ix RESEARCH QUESTION 1:FIRST-YEAR TEACHER EXPERIENCES AND COMPETING RISKS OF
TURNOVER ... 116
Descriptives and Comparisons Across Turnover Trajectories ... 117
First-year teacher programs and policies. ... 118
Perceptions of preparedness to teach. ... 122
Perceptions of school climate and workplace conditions. ... 126
Teacher autonomy. ... 126 Administrative support. ... 130 Collegial support... 134 Parental support. ... 136 Resource support. ... 138 Student behavior. ... 140
Standards and accountability. ... 144
Perceptions of teachers’ job satisfaction. ... 147
Scale Development and Factor Score Comparisons Across Turnover Trajectories ... 153
First-year teacher programs and policies. ... 153
Preparedness to teach scale. ... 153
Perceptions of school climate and workplace conditions: Teacher autonomy subscales... 155
Perceptions of school climate and workplace conditions: Administrative support subscale. ... 157
x Perceptions of school climate and workplace conditions: Collegial support
subscale. The “Collegial Support” scale contained three items yielding a reliability of 0.730. The final solution with factor loadings and both initial and
extraction communalities are presented in Table 53. ... 159
Perceptions of school climate and workplace conditions: Parental support subscale. The “Parental Support” scale contained two items yielding a reliability of 0.648. The final solution with factor loadings and both initial and extraction communalities are presented in Table 55... 160
Perceptions of school climate and workplace conditions: Resource supports. ... 161
Perceptions of school climate and workplace conditions: Student behavior subscale. The “Student Behavior” scale contained eight items yielding a reliability of 0.860. The final solution with factor loadings and both initial and extraction communalities are presented in Table 57... 162
Perceptions of school climate and workplace conditions: Standards and accountability. ... 163
Perceptions of teachers’ job satisfaction subscales. ... 164
RESEARCH QUESTION 2:SURVIVAL MODELS ... 166
Base-Time Specification Model... 169
First-year Teaching Experiences and Competing Turnover Risks ... 174
First-year programs and policies and competing turnover risks. ... 174
Model A.1: Induction program participation. ... 175
Model A.2: Mentoring. ... 178
xi
Model A.4: Common planning time. ... 182
Model A.5: Seminars for novice teachers. ... 184
Model A.6: Receiving extra classroom assistance. ... 187
Model A: All first-year teacher programs and policies. ... 189
Preparedness to teach and competing turnover risks. ... 192
Model B: Perceptions of preparedness. ... 192
Perceptions of school climate and workplace conditions. ... 195
Model C.1: Pedagogical autonomy... 195
Model C.2: Curricular autonomy... 197
Model C.3: Administrative support. ... 200
Model C.4: Collegial support. ... 203
Model C.5: Parental support. ... 205
Model C.6: Access to materials. ... 208
Model C.7: Paperwork and routine duties interference. ... 211
Model C.8: Student behavior... 214
Model C.9: Job security and test scores ... 216
Model C.10: Content standards and satisfaction. ... 220
Model C: All school climate and workplace conditions. ... 222
Job Satisfaction. ... 226
Model D: Job satisfaction... 226
Discrete-time, Competing Risks Hazards – Model Results ... 229
Step 0: Competing turnover risks regressed on time only. ... 231
xii
Step 1b: Inclusion of school covariates. ... 232
Step 2: Inclusion of first-year teacher programs and policies. ... 233
Step 3: Inclusion of perceptions of preparedness. ... 235
Step 4: Inclusion of school climate and workplace conditions. ... 237
Step 5: Inclusion of perceptions of job satisfaction. ... 241
Discrete-time, Competing Risks Hazards – Job Satisfaction as a Moderator ... 242
Step 6: Interaction of job satisfaction with first-year teacher programs and policies. ... 243
Step 7: Interaction of job satisfaction with perceptions of preparedness. ... 246
Step 8: Interaction of job satisfaction with school climate and workplace conditions. ... 247
CHAPTER 5: DISCUSSION ... 250
RESEARCH QUESTION 1 ... 251
First-year Teacher Programs and Policies and Turnover ... 252
Perceptions of Preparedness to Teach and Turnover ... 252
Perceptions of School Climate and Workplace Conditions and Turnover ... 254
Perceptions of Job Satisfaction and Turnover ... 257
RESEARCH QUESTION 2 ... 258
First-year Teacher Programs and Policies and Turnover ... 260
Movers versus Stayers. ... 260
Leavers verses Stayers. ... 262
Perceptions of Preparedness to Teach and Turnover ... 264
xiii
Leavers versus Stayers. ... 265
Perceptions of School Climate and Workplace Conditions and Turnover ... 266
Movers versus Stayers. ... 266
Leavers versus Stayers. ... 268
Perceptions of Job Satisfaction and Turnover ... 271
Movers versus Stayers. ... 271
Leavers versus Stayers. ... 271
Comparison of the Results to Other Findings from the Literature ... 272
First-year teacher programs and policies. ... 272
Perceptions of preparedness. ... 273
School climate and workplace conditions. ... 273
Job satisfaction. ... 275
LIMITATIONS ... 276
Exclusions ... 276
Focus on the First-year Experience ... 277
Secondary Data Analysis ... 277
Duration of the Study ... 278
Timing of the Study ... 278
Observational Data and Unobserved Factors ... 279
Clustering ... 279
IMPLICATIONS ... 280
AREAS FOR FURTHER RESEARCH ... 282
xiv APPENDIX A ... 313 APPENDIX B ... 319 APPENDIX C ... 329 APPENDIX D ... 335 APPENDIX E ... 336
xv
TABLE OF TABLES
TABLE 1. DATA COLLECTION BY WAVE. ... 5
TABLE 2. SECTIONS AND CONTENT COVERAGE OF THE BTLS FIRST-WAVE QUESTIONNAIRE. 48 TABLE 3. UNWEIGHTED AND BASE-WEIGHTED TEACHER-UNIT RESPONSE RATES BY WAVE. .. 55
TABLE 4. RAW FREQUENCIES OF STAYERS, MOVERS, LEAVERS, AND RETURNERS BY WAVE. ... 59
TABLE 5. SUMMARY OF MEASURES. ... 72
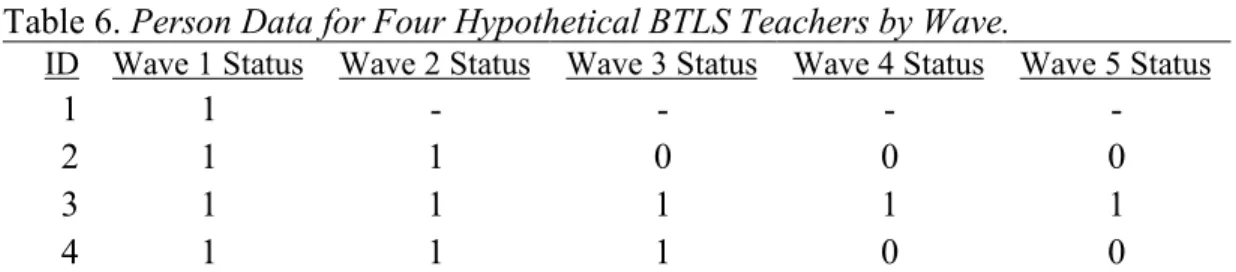
TABLE 6. PERSON DATA FOR FOUR HYPOTHETICAL BTLS TEACHERS BY WAVE... 88
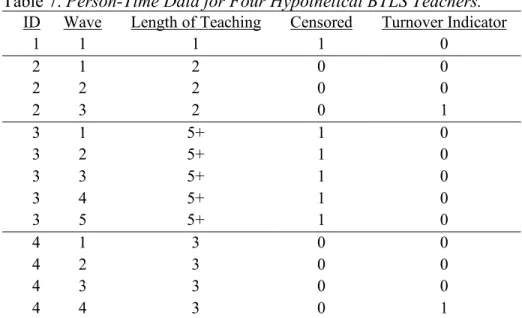
TABLE 7. PERSON-TIME DATA FOR FOUR HYPOTHETICAL BTLS TEACHERS... 90
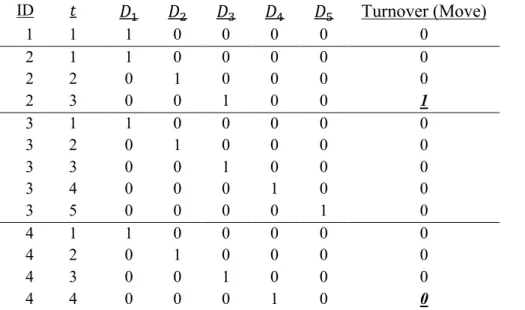
TABLE 8. CODING OF TIME INDICATORS FOR DISCRETE-TIME LOGIT-HAZARD MODEL FOR ANY TURNOVER. ... 91
TABLE 9. CODING OF TIME INDICATORS FOR DISCRETE-TIME LOGIT-HAZARD MODEL FOR MOVERS. ... 93
TABLE 10. CODING OF TIME INDICATORS FOR DISCRETE-TIME LOGIT-HAZARD MODEL FOR LEAVERS. ... 93
TABLE 11. MODEL-BUILDING PLAN WITH SEQUENTIAL INCLUSION OF BLOCKS OF PREDICTORS AND INTERACTIONS. ... 96
TABLE 12. DISTRIBUTION OF GENDER IN WAVE 1 WEIGHTED SAMPLE. ... 104
TABLE 13. DISTRIBUTION OF RACE/ETHNICITY IN WAVE 1 WEIGHTED SAMPLE. ... 105
TABLE 14. DESCRIPTIVES FOR AGE IN WAVE 1 WEIGHTED SAMPLE. ... 105
TABLE 15. DISTRIBUTION OF LEVEL OF STUDENTS TAUGHT BY TEACHER IN WAVE 1 WEIGHTED SAMPLE. ... 106
xvi TABLE 17. DISTRIBUTION OF AMOUNT OF PRACTICE/STUDENT TEACHING IN WAVE 1
WEIGHTED SAMPLE. ... 107 TABLE 18. DISTRIBUTION OF TEACHING METHODS COURSE COMPLETION IN WAVE 1
WEIGHTED SAMPLE. ... 108 TABLE 19. DISTRIBUTION OF CERTIFICATION PROGRAM ROUTE IN WAVE 1 WEIGHTED
SAMPLE. ... 108 TABLE 20. DISTRIBUTION OF SCHOOL URBANICITY IN WAVE 1 WEIGHTED SAMPLE. ... 110
TABLE 21. DISTRIBUTION OF CHARTER SCHOOL STATUS IN WAVE 1 WEIGHTED SAMPLE. ... 110
TABLE 22. DESCRIPTIVES FOR STUDENT ENROLLMENT AND STUDENT-TEACHER RATIO IN WAVE 1 WEIGHTED SAMPLE. ... 111 TABLE 23. DESCRIPTIVES FOR % OF STUDENTS IDENTIFYING AS RACIAL/ETHNIC MINORITY IN
WAVE 1 WEIGHTED SAMPLE. ... 111 TABLE 24. FREQUENCIES OF TURNOVER TRAJECTORIES IN WAVE 1 WEIGHTED SAMPLE. .... 113
TABLE 25. FREQUENCIES OF TURNOVER/RETENTION OUTCOMES IN WAVE 1 WEIGHTED
SAMPLE. ... 114 TABLE 26. FREQUENCIES OF TURNOVER OUTCOMES ONLY IN WAVE 1 WEIGHTED SAMPLE. 115
TABLE 27. DESCRIPTIVES AND FREQUENCIES FOR 6 FIRST-YEAR PROGRAMS AND POLICIES ITEMS WITH WAVE 1 WEIGHTS. ... 120 TABLE 28. DESCRIPTIVES FOR 6 FIRST-YEAR PROGRAMS AND POLICIES ITEMS BY TURNOVER
OUTCOME WITH WAVE 1 WEIGHTS. ... 121 TABLE 29. DESCRIPTIVES AND FREQUENCIES FOR 6 PREPAREDNESS TO TEACH ITEMS WITH
xvii TABLE 30. DESCRIPTIVES FOR 6 PREPAREDNESS TO TEACH ITEMS BY TURNOVER OUTCOME
WITH WAVE 1 WEIGHTS. ... 125 TABLE 31. DESCRIPTIVES AND FREQUENCIES FOR 6 TEACHER AUTONOMY ITEMS WITH WAVE 1
WEIGHTS. ... 128 TABLE 32. DESCRIPTIVES FOR 6 TEACHER AUTONOMY ITEMS BY TURNOVER OUTCOME WITH
WAVE 1 WEIGHTS. ... 129 TABLE 33. DESCRIPTIVES AND FREQUENCIES FOR 6 ADMINISTRATIVE SUPPORT ITEMS WITH
WAVE 1 WEIGHTS. ... 132 TABLE 34. DESCRIPTIVES FOR 6 ADMINISTRATIVE SUPPORT ITEMS BY TURNOVER OUTCOME
WITH WAVE 1 WEIGHTS. ... 133 TABLE 35. DESCRIPTIVES AND FREQUENCIES FOR 3 COLLEGIAL SUPPORT ITEMS WITH WAVE 1
WEIGHTS. ... 134 TABLE 36. DESCRIPTIVES FOR 3 COLLEGIAL SUPPORT ITEMS BY TURNOVER OUTCOME WITH
WAVE 1 WEIGHTS. ... 135 TABLE 37. DESCRIPTIVES AND FREQUENCIES FOR 2 PARENTAL SUPPORT ITEMS WITH WAVE 1
WEIGHTS. ... 136 TABLE 38. DESCRIPTIVES FOR 2 PARENTAL SUPPORT ITEMS BY TURNOVER OUTCOME WITH
WAVE 1 WEIGHTS. ... 137 TABLE 39. DESCRIPTIVES AND FREQUENCIES FOR 2 RESOURCE SUPPORT ITEMS WITH WAVE 1
WEIGHTS. ... 139 TABLE 40. DESCRIPTIVES FOR 2 RESOURCE SUPPORT ITEMS BY TURNOVER OUTCOME WITH
xviii TABLE 41. DESCRIPTIVES AND FREQUENCIES FOR 8 STUDENT BEHAVIOR ITEMS WITH WAVE 1
WEIGHTS. ... 142 TABLE 42. DESCRIPTIVES FOR 8 STUDENT BEHAVIOR ITEMS BY TURNOVER OUTCOME WITH
WAVE 1 WEIGHTS. ... 143 TABLE 42(CONTINUED). DESCRIPTIVES FOR 8 STUDENT BEHAVIOR ITEMS BY TURNOVER
OUTCOME WITH WAVE 1 WEIGHTS. ... 144 TABLE 43. DESCRIPTIVES AND FREQUENCIES FOR 2 STANDARDS AND ACCOUNTABILITY ITEMS
WITH WAVE 1 WEIGHTS. ... 145 TABLE 44. DESCRIPTIVES FOR 2 STANDARDS AND ACCOUNTABILITY ITEMS BY TURNOVER
OUTCOME WITH WAVE 1 WEIGHTS. ... 146 TABLE 45. DESCRIPTIVES AND FREQUENCIES FOR 9 TEACHING SATISFACTION ITEMS WITH
WAVE 1 WEIGHTS. ... 150 TABLE 46. DESCRIPTIVES FOR 9 TEACHER SATISFACTION ITEMS BY TURNOVER OUTCOME WITH WAVE 1 WEIGHTS. ... 151 TABLE 46(CONTINUED). DESCRIPTIVES FOR 9 TEACHER SATISFACTION ITEMS BY TURNOVER
OUTCOME WITH WAVE 1 WEIGHTS. ... 152 TABLE 47. FACTOR LOADINGS AND COMMUNALITIES FOR PREPAREDNESS TO TEACH SCALE
WITH WAVE 1 WEIGHTS. ... 154 TABLE 48. PREPAREDNESS FACTOR SCORE DESCRIPTIVES BY TURNOVER TRAJECTORIES WITH
WAVE 1 WEIGHTS. ... 154 TABLE 49. FACTOR LOADINGS AND COMMUNALITIES FOR TEACHER AUTONOMY SCALE WITH
xix TABLE 50. AUTONOMY FACTOR SCORE DESCRIPTIVES BY TURNOVER TRAJECTORIES WITH
WAVE 1 WEIGHTS. ... 156 TABLE 51. FACTOR LOADINGS AND COMMUNALITIES FOR ADMINISTRATIVE SUPPORT SCALE
WITH WAVE 1 WEIGHTS. ... 157 TABLE 52. ADMINISTRATIVE SUPPORT FACTOR SCORE DESCRIPTIVES BY TURNOVER
TRAJECTORIES WITH WAVE 1 WEIGHTS. ... 158 TABLE 53. FACTOR LOADINGS AND COMMUNALITIES FOR COLLEGIAL SUPPORT SCALE WITH
WAVE 1 WEIGHTS. ... 159 TABLE 54. COLLEGIAL SUPPORT FACTOR SCORE DESCRIPTIVES BY TURNOVER TRAJECTORIES
WITH WAVE 1 WEIGHTS. ... 159 TABLE 55. FACTOR LOADINGS AND COMMUNALITIES FOR PARENTAL SUPPORT SCALE WITH
WAVE 1 WEIGHTS. ... 160 TABLE 56. PARENTAL SUPPORT FACTOR SCORE DESCRIPTIVES BY TURNOVER TRAJECTORIES
WITH WAVE 1 WEIGHTS. ... 161 TABLE 57. FACTOR LOADINGS AND COMMUNALITIES FOR STUDENT BEHAVIOR SCALE WITH
WAVE 1 WEIGHTS. ... 162 TABLE 58. STUDENT BEHAVIOR FACTOR SCORE DESCRIPTIVES BY TURNOVER TRAJECTORIES
WITH WAVE 1 WEIGHTS. ... 163 TABLE 59. FACTOR LOADINGS AND COMMUNALITIES FOR JOB SATISFACTION SCALE WITH
WAVE 1 WEIGHTS. ... 164 TABLE 60. JOB SATISFACTION FACTOR SCORE DESCRIPTIVES BY TURNOVER TRAJECTORIES
WITH WAVE 1 WEIGHTS. ... 165 TABLE 61. BASE-TIME SPECIFICATION MODEL ESTIMATES. ... 170
xx TABLE 62. YEARLY AND CUMULATIVE PREDICTED PROBABILITIES OF MOVING AND LEAVING
OVER THE FIRST FIVE YEARS.... 171 TABLE 63. INDUCTION MODEL ESTIMATES... 176
TABLE 64. YEARLY AND CUMULATIVE PREDICTED PROBABILITIES OF MOVING AND LEAVING CONDITIONED ON INDUCTION. ... 176 TABLE 65. COHEN’S D EFFECT SIZES FOR PREDICTED PROBABILITIES CONDITIONED ON
INDUCTION. ... 177 TABLE 66. MENTORING MODEL ESTIMATES. ... 178
TABLE 67. YEARLY AND CUMULATIVE PREDICTED PROBABILITIES OF MOVING AND LEAVING CONDITIONED ON MENTORING. ... 179 TABLE 68. COHEN’S D EFFECT SIZES FOR PREDICTED PROBABILITIES CONDITIONED ON
MENTORING. ... 179 TABLE 69. REDUCED TEACHING SCHEDULE MODEL ESTIMATES. ... 180
TABLE 70. YEARLY AND CUMULATIVE PREDICTED PROBABILITIES OF MOVING AND LEAVING CONDITIONED ON REDUCED TEACHING LOAD. ... 181 TABLE 71. COHEN’S D EFFECT SIZES FOR PREDICTED PROBABILITIES CONDITIONED ON
REDUCED TEACHING LOAD. ... 182 TABLE 72. COMMON PLANNING TIME MODEL ESTIMATES. ... 183
TABLE 73. YEARLY AND CUMULATIVE PREDICTED PROBABILITIES OF MOVING AND LEAVING CONDITIONED ON COMMON PLANNING TIME. ... 183 TABLE 74. COHEN’S D EFFECT SIZES FOR PREDICTED PROBABILITIES CONDITIONED ON
COMMON PLANNING TIME.... 184 TABLE 75. SEMINARS MODEL ESTIMATES. ... 185
xxi TABLE 76. YEARLY AND CUMULATIVE PREDICTED PROBABILITIES OF MOVING AND LEAVING
CONDITIONED ON SEMINARS.... 186 TABLE 77. COHEN’S D EFFECT SIZES FOR PREDICTED PROBABILITIES CONDITIONED ON
SEMINARS. ... 186 TABLE 78. EXTRA HELP MODEL ESTIMATES. ... 187
TABLE 79. YEARLY AND CUMULATIVE PREDICTED PROBABILITIES OF MOVING AND LEAVING CONDITIONED ON EXTRA HELP.... 188 TABLE 80. COHEN’S D EFFECT SIZES FOR PREDICTED PROBABILITIES CONDITIONED ON
EXTRA HELP. ... 188 TABLE 81. FIRST-YEAR PROGRAMS AND POLICIES MODEL ESTIMATES. ... 191
TABLE 82. COHEN’S D EFFECT SIZES FOR PREDICTED PROBABILITIES CONDITIONED ON FIRST-YEAR PROGRAMS AND POLICIES. ... 192 TABLE 83. PREPAREDNESS MODEL ESTIMATES. ... 193
TABLE 84. YEARLY AND CUMULATIVE PREDICTED PROBABILITIES OF MOVING AND LEAVING CONDITIONED ON PREPAREDNESS FACTOR SCORES. ... 193 TABLE 85. COHEN’S D EFFECT SIZES FOR PREDICTED PROBABILITIES CONDITIONED ON
PREPAREDNESS FACTOR SCORE. ... 194 TABLE 86. PEDAGOGICAL AUTONOMY MODEL ESTIMATES. ... 196
TABLE 87. YEARLY AND CUMULATIVE PREDICTED PROBABILITIES OF MOVING AND LEAVING CONDITIONED ON PEDAGOGICAL AUTONOMY FACTOR SCORES. ... 196 TABLE 88. COHEN’S D EFFECT SIZES FOR PREDICTED PROBABILITIES CONDITIONED ON
PEDAGOGICAL AUTONOMY FACTOR SCORE. ... 197 TABLE 89. CURRICULAR AUTONOMY MODEL ESTIMATES. ... 198
xxii TABLE 90. YEARLY AND CUMULATIVE PREDICTED PROBABILITIES OF MOVING AND LEAVING
CONDITIONED ON CURRICULAR AUTONOMY FACTOR SCORES. ... 199 TABLE 91. COHEN’S D EFFECT SIZES FOR PREDICTED PROBABILITIES CONDITIONED ON
CURRICULAR AUTONOMY FACTOR SCORE. ... 199 TABLE 92. ADMINISTRATIVE SUPPORT MODEL ESTIMATES. ... 201
TABLE 93. YEARLY AND CUMULATIVE PREDICTED PROBABILITIES OF MOVING AND LEAVING CONDITIONED ON ADMINISTRATIVE SUPPORT FACTOR SCORES. ... 201 TABLE 94. COHEN’S D EFFECT SIZES FOR PREDICTED PROBABILITIES CONDITIONED ON
ADMINISTRATIVE SUPPORT FACTOR SCORE. ... 202 TABLE 95. COLLEGIAL SUPPORT MODEL ESTIMATES. ... 204
TABLE 96. YEARLY AND CUMULATIVE PREDICTED PROBABILITIES OF MOVING AND LEAVING CONDITIONED ON COLLEGIAL SUPPORT FACTOR SCORES. ... 204 TABLE 97. COHEN’S D EFFECT SIZES FOR PREDICTED PROBABILITIES CONDITIONED ON
COLLEGIAL SUPPORT FACTOR SCORE. ... 205 TABLE 98. PARENTAL SUPPORT MODEL ESTIMATES. ... 206
TABLE 99. YEARLY AND CUMULATIVE PREDICTED PROBABILITIES OF MOVING AND LEAVING CONDITIONED ON PARENTAL SUPPORT FACTOR SCORES. ... 207 TABLE 100. COHEN’S D EFFECT SIZES FOR PREDICTED PROBABILITIES CONDITIONED ON
PARENTAL SUPPORT FACTOR SCORE. ... 207 TABLE 101. MATERIAL AVAILABILITY MODEL ESTIMATES. ... 209
TABLE 102. YEARLY AND CUMULATIVE PREDICTED PROBABILITIES OF MOVING AND LEAVING CONDITIONED ON MATERIAL AVAILABILITY RESPONSES. ... 209
xxiii TABLE 103. COHEN’S D EFFECT SIZES FOR PREDICTED PROBABILITIES CONDITIONED ON
MATERIAL AVAILABILITY. ... 210 TABLE 104. PAPERWORK INTERFERENCE MODEL ESTIMATES. ... 212
TABLE 105. YEARLY AND CUMULATIVE PREDICTED PROBABILITIES OF MOVING AND LEAVING CONDITIONED ON PAPERWORK INTERFERENCE RESPONSES. ... 213 TABLE 106. COHEN’S D EFFECT SIZES FOR PREDICTED PROBABILITIES CONDITIONED ON
PAPERWORK INTERFERENCE. ... 214 TABLE 107. STUDENT BEHAVIOR MODEL ESTIMATES. ... 215
TABLE 108. YEARLY AND CUMULATIVE PREDICTED PROBABILITIES OF MOVING AND LEAVING CONDITIONED ON STUDENT BEHAVIOR FACTOR SCORES. ... 215 TABLE 109. COHEN’S D EFFECT SIZES FOR PREDICTED PROBABILITIES CONDITIONED ON
STUDENT BEHAVIOR FACTOR SCORE. ... 216 TABLE 110. JOB SECURITY CONCERN MODEL ESTIMATES. ... 218
TABLE 111. YEARLY AND CUMULATIVE PREDICTED PROBABILITIES OF MOVING AND LEAVING CONDITIONED ON JOB SECURITY RESPONSES. ... 218 TABLE 112. COHEN’S D EFFECT SIZES FOR PREDICTED PROBABILITIES CONDITIONED ON JOB
SECURITY. ... 219 TABLE 113. CONTENT STANDARDS IMPACT MODEL ESTIMATES. ... 221
TABLE 114. YEARLY AND CUMULATIVE PREDICTED PROBABILITIES OF MOVING AND LEAVING CONDITIONED ON CONTENT STANDARDS RESPONSES. ... 221 TABLE 115. COHEN’S D EFFECT SIZES FOR PREDICTED PROBABILITIES CONDITIONED ON
CONTENT STANDARDS. ... 222 TABLE 116. SCHOOL CLIMATE AND WORKPLACE CONDITIONS MODEL ESTIMATES. ... 224
xxiv TABLE 116(CONTINUED). SCHOOL CLIMATE AND WORKPLACE CONDITIONS MODEL
ESTIMATES. ... 225 TABLE 117. COHEN’S D EFFECT SIZES FOR PREDICTED PROBABILITIES CONDITIONED ON
SCHOOL CLIMATE AND WORKPLACE CONDITIONS. ... 225 TABLE 118. JOB SATISFACTION MODEL ESTIMATES. ... 227
TABLE 119. YEARLY AND CUMULATIVE PREDICTED PROBABILITIES OF MOVING AND LEAVING CONDITIONED ON JOB SATISFACTION FACTOR SCORES. ... 227 TABLE 120. COHEN’S D EFFECT SIZES FOR PREDICTED PROBABILITIES CONDITIONED ON JOB
SATISFACTION FACTOR SCORE. ... 228 TABLE 121. BASELINE MODEL OF TURNOVER CONDITIONED ON TIME ONLY. ... 232
TABLE 122. COHEN’S D EFFECT SIZES FOR PREDICTED PROBABILITIES CONDITIONED ON FIRST-YEAR PROGRAMS AND POLICIES CONTROLLING FOR TEACHER/SCHOOL
COVARIATES. ... 234 TABLE 123. COHEN’S D EFFECT SIZES FOR PREDICTED PROBABILITIES CONDITIONED ON
PREPAREDNESS FACTOR SCORE CONTROLLING FOR TEACHER/SCHOOL COVARIATES AND FIRST-YEAR TEACHING PROGRAMS AND POLICIES. ... 236 TABLE 124. COHEN’S D EFFECT SIZES FOR PREDICTED PROBABILITIES CONDITIONED
ENVIRONMENTAL TEACHING CONDITIONS CONTROLLING FOR TEACHER/SCHOOL
COVARIATES, FIRST-YEAR TEACHING PROGRAMS AND POLICIES, AND PREPAREDNESS. 240 TABLE 125. COHEN’S D EFFECT SIZES FOR PREDICTED PROBABILITIES CONDITIONED ON
SATISFACTION CONTROLLING FOR TEACHER/SCHOOL COVARIATES, FIRST-YEAR
TEACHING PROGRAMS AND POLICIES, PREPAREDNESS, AND ENVIRONMENTAL TEACHING CONDITIONS. ... 242
xxv TABLE 126. COHEN’S D EFFECT SIZES FOR PREDICTED PROBABILITIES OF MOVING
CONDITIONED ON THE INTERACTION OF SATISFACTION WITH FIRST-YEAR PROGRAMS AND POLICIES. ... 245 TABLE 127. COHEN’S D EFFECT SIZES FOR PREDICTED PROBABILITIES OF LEAVING
CONDITIONED ON THE INTERACTION OF SATISFACTION WITH FIRST-YEAR PROGRAMS AND POLICIES. ... 245 TABLE 128. COHEN’S D EFFECT SIZES FOR PREDICTED PROBABILITIES OF MOVING AND
LEAVING CONDITIONED ON THE INTERACTION OF SATISFACTION WITH PREPAREDNESS.
... 246 TABLE 129. COHEN’S D EFFECT SIZES FOR PREDICTED PROBABILITIES OF MOVING
CONDITIONED ON THE INTERACTION OF SATISFACTION WITH SCHOOL CLIMATE AND WORKPLACE CONDITIONS. ... 249 TABLE 130. COHEN’S D EFFECT SIZES FOR PREDICTED PROBABILITIES OF LEAVING
CONDITIONED ON THE INTERACTION OF SATISFACTION WITH SCHOOL CLIMATE AND WORKPLACE CONDITIONS. ... 249
xxvi
TABLE OF FIGURES
FIGURE 1. THE CONCEPTUAL MODEL OF EARLY CAREER TEACHER TURNOVER FROM THE FIRST SCHOOL PLACEMENT. ... 41 FIGURE 2. YEARLY PREDICTED PROBABILITIES OF MOVING AND LEAVING OVER THE FIRST FIVE YEARS. ... 171 FIGURE 3. YEARLY PREDICTED PROBABILITIES OF MOVING AND LEAVING CONDITIONED ON
INDUCTION. ... 177 FIGURE 4. YEARLY PREDICTED PROBABILITIES OF MOVING AND LEAVING CONDITIONED ON
MENTORING. ... 179 FIGURE 5. YEARLY PREDICTED PROBABILITIES OF MOVING AND LEAVING CONDITIONED ON
REDUCED SCHEDULE. ... 181 FIGURE 6. YEARLY PREDICTED PROBABILITIES OF MOVING AND LEAVING CONDITIONED ON
COMMON TIME.... 184 FIGURE 7. YEARLY PREDICTED PROBABILITIES OF MOVING AND LEAVING CONDITIONED ON
SEMINARS. ... 186 FIGURE 8. YEARLY PREDICTED PROBABILITIES OF MOVING AND LEAVING CONDITIONED ON
EXTRA HELP. ... 188 FIGURE 9. YEARLY PREDICTED PROBABILITIES OF MOVING AND LEAVING CONDITIONED ON
PREPAREDNESS FACTOR SCORES. ... 194 FIGURE 10. YEARLY PREDICTED PROBABILITIES OF MOVING AND LEAVING CONDITIONED ON
PEDAGOGICAL AUTONOMY FACTOR SCORES. ... 197 FIGURE 11. YEARLY PREDICTED PROBABILITIES OF MOVING AND LEAVING CONDITIONED ON
xxvii FIGURE 12. YEARLY PREDICTED PROBABILITIES OF MOVING AND LEAVING CONDITIONED ON
ADMINISTRATIVE SUPPORT FACTOR SCORES. ... 202 FIGURE 13. YEARLY PREDICTED PROBABILITIES OF MOVING AND LEAVING CONDITIONED ON
COLLEGIAL SUPPORT FACTOR SCORES. ... 205 FIGURE 14. YEARLY PREDICTED PROBABILITIES OF MOVING AND LEAVING CONDITIONED ON
PARENTAL SUPPORT FACTOR SCORES. ... 207 FIGURE 15. YEARLY PREDICTED PROBABILITIES OF MOVING AND LEAVING CONDITIONED ON
STUDENT BEHAVIOR FACTOR SCORES. ... 216 FIGURE 16. YEARLY PREDICTED PROBABILITIES OF MOVING AND LEAVING CONDITIONED ON
1
CHAPTER 1: INTRODUCTION
Every year in the United States, hundreds of thousands of educators leave the schools in which they teach to work in other schools, other districts, and other
occupations, or leave the workforce altogether. Although turnover is an inevitable labor market phenomenon in any profession, studies have shown that the current rates of teacher attrition and mobility are substantially higher than in professions requiring comparable levels of pre-service training, such as nursing, accounting, and social work (Ingersoll, 2001; Borman & Dowling, 2008). The Alliance for Excellent Education recently reported that 13.5 percent of all public school teachers in the U.S. turn over each year, either by moving to another school (6.7% mobility) or leaving the profession altogether (6.8% attrition) (Haynes, Maddock, & Goldrick, 2014). To provide a sense of scope, 3.1 million full-time teachers were employed in U.S. public schools during the 2013-2014 academic year (Glander, 2015); 13.5 percent of this workforce calculates to roughly 400,000 teachers in transition by the summer of 2014. Richard Ingersoll characterizes this level of turnover as the “revolving door” of the teaching profession (2003).
Since Ingersoll’s seminal work was published over a decade ago, educational researchers, policymakers, and even the media have seized on his findings to frame teacher turnover as the new crisis of the U.S. public school system; however, the teacher turnover phenomenon is not new. In fact, teaching has long been regarded as a profession with unusually high attrition rates (Lortie, 1975) and the rates of turnover have been moderately stable for the last one hundred years. In the mid-1920s, annual teacher turnover rates hovered around 16 percent (National Education Association, 2004), rising
2 to 19 percent in the late 1960s (Metz & Fleischman, 1974), and dipping back to 16
percent in the early 2000s (Ingersoll, 2003).
While the current teacher turnover rate of 13.5 percent is not in itself a novel finding, the recent fervor surrounding the phenomenon and rapid growth of research on the topic have brought to light the rising and disturbing costs associated with it. The financial impacts on the nation, its districts, and its schools have become a major cause for concern, as have the oft-imperceptible costs of turnover for at-risk students and schools with the most critical needs. Furthermore, although the overall annual rate of turnover is somewhat stable, the same cannot be said for the attrition and mobility rates of specific subgroups of teachers (Hanushek, Kain, & Rivkin, 2004). For example, turnover rates are actually increasing on a yearly basis for beginning teachers (Ingersoll, Merrill, & Stuckey, 2014). These rates are rising even faster for early career teachers in high-poverty, high-minority, urban, and rural schools (Hanushek, Kain, & Rivkin, 2004).
In response to the turnover “crisis”, policymakers, researchers, and educators alike have begun to focus more attention on the mechanisms of teacher turnover and teacher resiliency within the population of beginning teachers. This study contributes to this discussion, exploring how teachers’ first-year experiences in the field affect turnover and retention decisions throughout their early career. This work also investigates
satisfaction with the first year of teaching as a possible moderator of the relationship between teachers’ first-year experiences and subsequent turnover outcomes.
Using longitudinal data from teachers and schools collected as part of the Beginning Teacher Longitudinal Survey or the BTLS (U.S. Department of Education National Center for Education Statistics, 2015), this dissertation research focuses on the
3 first-year experiences of public middle and high school teachers as predictors of teacher retention and turnover across the first five years of their teaching career. Four facets were conceived as characterizing teachers’ first-year experiences:
1. Tangible first-year supports and programs provided by the school administration, including participation in an official school-based induction program, a reduced teaching schedule, common planning time with colleagues, seminars for
beginning teachers, and extra classroom assistance (e.g., having a co-teacher or classroom aide);
2. Perceptions of their preparedness to teach; specifically, perceptions of their ability to handle classroom management, use of a variety of instructional methods, employment of technology in the classroom, assessment of students, development of curriculum materials, and comprehension of subject matter;
3. Perceptions of the school climate, including the level of teacher autonomy; the amount of emotional, pedagogical, and social support received from one’s mentor or master teacher, school administrators, colleagues, and parents; the impacts of student behavior; and the influence of standards and accountability systems; and 4. Satisfaction with teaching both as a career as well as localized in one’s school
setting.
Prior research supporting the importance of these facets is discussed in Chapter 2, and detailed descriptions of how these facets were operationalized using teacher data is provided in Chapter 3.
4
Research Questions
The research questions that framed this dissertation are:
1. What are the first-year experiences for teachers in the sample and how do they compare between teachers who are retained in their first school placements (i.e. Stayers) and teachers who voluntarily or involuntarily turn over in later years (i.e. Movers and Leavers)?
2. What first-year teacher experiences predict voluntary and involuntary turnover at the end of years 1, 2, 3, and 4? And, how does satisfaction with teaching in the first year interact with the three other facets of the first-year experience (e.g. act as a moderator) to predict voluntary and involuntary turnover across the early career window of years 1 through 4?
To address the first research question, teachers’ first-year experiences and turnover rates across the five-year early career window are described. To answer the second research question, the four facets of teachers’ first-year experiences are discussed in terms of their power to predict teachers’ decisions to stay, move, or leave in later years. Teacher and school demographic characteristics were included in this stage of the analyses as covariates (see Chapter 3).
Methodology
This study addressed the research questions using a national longitudinal dataset to conduct descriptive analyses and discrete-time competing risks hazards regression modeling.
5
Data Sources and Sample
The study drew upon survey data from the first five waves of the restricted-use Beginning Teacher Longitudinal Survey (BTLS) data set (U.S. Department of Education National Center for Education Statistics, 2015). Developed by the National Center for Education Statistics (NCES) and conducted by the U.S. Census Bureau, the BTLS is a national panel study of beginning public school teachers in the initial stages of their educational careers. The study follows the same group of individuals as they transition in and out of secondary level teaching, surveying individuals on a yearly basis over the course of five years. The BTLS sample comprises full-time and part-time teachers, itinerant teachers, long-term substitute teachers, administrators, support staff, librarians, and other school-based staff who taught at least one regularly scheduled class in the 2007-2008 school year in grades K-12. Early career teachers are of particular interest to NCES due to the curiously high rates of turnover for beginning educators relative to their middle-to-late career peers, a phenomenon that fueled the development of the BTLS.
There were five waves of data collection for the BTLS conducted on an annual basis starting with the 2007-2008 school year and ending with the 2011-2012 school year. The first two waves were conducted in conjunction with the 2007-2008 Schools and Staffing Survey (SASS) and the 2008-2009 Teacher Follow-Up Survey (TFS), while the third through fifth waves were conducted as standalone survey research initiatives, as shown in Table 1.
Table 1. Data Collection by Wave.
Survey 2007-2008 2008-2009 2009-2010 2010-2011 2011-2012
SASS X
TFS X
6 This dissertation research focused on the population of beginning public school teachers in the United States with the following characteristics: full-time instructors whose primary teaching assignments require them to work with students at the
“secondary” level encompassing the 6th through 12th grades (i.e., middle school and/or
high school levels). This focus is due to the alternative labor market opportunities available to secondary teachers as a result of their pre-service content training and subject-matter expertise. Therefore, applying these criteria to the first five waves of the BTLS, the unweighted analytic sample for this study included approximately 1,150 teachers drawn from approximately 1,000 schools across 900 school districts.
Conceptual Model and Variables
The analyses were grounded in a conceptual model of teacher turnover and retention for early career teachers based on theoretical frameworks and labor market perspectives described in greater detail in Chapter 2. The variables used in this dissertation research were selected based upon the author’s personal experience with early career teaching and turnover as well as a review of the literature. Researchers who have examined factors associated with teacher satisfaction, turnover, and retention suggest that important influences to consider include (a) demographic and background variables for both teachers and students, (b) variables related to the teaching assignment, (c) administrative practices and policies within their schools, (d) the teachers’ own perceptions of effectiveness and self-efficacy, and (e) the support they receive from supervisors, colleagues, and parents (e.g., Weiss, 1999; Billingsley, 1993; Chapman, 1984; Chapman & Lowther, 1982; Shen, 1997).
7 The conceptual model comprises the four facets of the first-year teaching
experience: professional supports provided by the administration, perceptions about one’s preparedness to teach, perceptions of school climate, and satisfaction with teaching. Using specific variables collected during the first wave of the BTLS, factor analysis was conducted to explore the creation of measurement scales to capture these four facets of the first-year teaching experience. The conceptual model also includes teacher-specific (e.g., demographics, secondary school level, and teacher education and preparation) and school-specific (e.g., school size, urbanicity, charter status, and student body
composition) characteristics measured in the first year of teaching at the first school placement that may be related to the teacher turnover phenomenon as demonstrated in the literature. The inclusion of these characteristics as potential covariates was explored. Chapter 2 presents the conceptual model (see Figure 1) and discusses research findings for each of its components. Chapter 3 discusses the specific measures that were used in this study to represent each construct.
Analysis Plan
The analytic methods used to address each research question are detailed below.
RQ1. What are the first-year experiences for teachers in the sample and how do they compare across teachers who are retained in their first school placements (i.e. Stayers) and teachers who voluntarily or involuntarily turn over (i.e. Movers and Leavers) in later years? The study began with descriptive analyses of the
proportion of beginning secondary public school teachers classified as Stayers, Movers, and Leavers (both voluntary and involuntary) with respect to their first school placement, as well as the percentage of Stayers, Movers, and Leavers by BTLS wave (i.e., year). In
8 addition, the percentages of Stayers, Movers, and Leavers were compared across schools, with respect to urbanicity, level, size, charter status, and student body composition, and across teachers, with respect to gender, age, race/ethnicity, education level, and
preparation route. Furthermore, Stayers, Movers, and Leavers were compared with respect to their first-year teaching experiences, described previously as the four facets of the first-year experience.
RQ2. What first-year teacher experiences predict voluntary and involuntary turnover at the end of years 1, 2, 3, and 4? And, how does satisfaction with teaching in the first year interact with the three other facets of the first-year experience (e.g. act as a moderator) to predict voluntary and involuntary turnover across the early career window of years 1 through 4? The second research question was addressed within the framework of survival analysis. First, for the purpose of data reduction and to minimize the impact of multicollinearity, the creation of scales to represent each facet of the first-year teaching experience were investigated via exploratory factor analysis. Then, a discrete-time, competing risks hazards regression was constructed with blocks of predictors including the factor scores developed in the previous stage of analysis to model the probability of a teacher staying, leaving, or moving after their first, second, third, and fourth years of teaching. Note that the unweighted analytic sample for this study included roughly 1,150 teachers drawn from 1,000 schools across 900 districts. With an average of 1.1 beginning secondary teachers per public school (before
weighting), the sampling design for the BTLS, which includes only a small number of teachers within each sampled school, precludes the use of multilevel modeling (Mullens & Kasprzyk, 1996).
9 Due to the discrete time points in which the data was collected, there are five observations for each individual but only four of those observations yield a value for teacher status (i.e., Stayer, Mover, or Leaver) as all teachers in the sample were teaching during the first year of BTLS data collection. There were three discrete, categorical teaching outcomes to be modeled, which required the use of a multinomial logistic regression. The discrete-time, competing risks hazards regression model accounts for this characteristic of the data. The time-varying trichotomous turnover/retention outcome was modeled using blocks of predictors measured in teachers’ first year in the classroom. Of particular interest was the potential for satisfaction with teaching to moderate the strength of the relationships between teachers’ career decisions and the three other facets of the first-year teaching experience (i.e., perceptions about their preparedness to teach,
perceptions of school climate, and the first-year supports provided by the administration). Therefore, interactions between job satisfaction and the other first-year experience
predictors were explored.
The relative efficacy of these stepwise nested models in explaining teacher
turnover was compared using two techniques: 1) Akaike Information Criterion (AIC) and deviance statistics; and 2) hit ratios with jackknife estimation as measures of
classification efficacy. Significant first-year experiential predictors were retained to build the most parsimonious survival model that explains differences in whether and when teachers stay, move, or leave. The analysis methods are described in detail in Chapter 3.
Note that this research relied on teacher and school covariates as they were measured in the first year of teaching only. Thus, covariates were treated as
10 and characteristics changed drastically over the five-year duration of the BTLS, the likelihood that the school characteristics and student body demographics changed over that time period is much greater. This is an acknowledged limitation of the research.
Significance of the Study
This dissertation aimed to identify manipulable, policy-amenable variables specific to the first year of teaching (i.e., teacher preparation, school climate, and administrative supports) that predict voluntary and involuntary early career teacher
turnover and retention outcomes in secondary public school settings. In other words, what first-year factors are related to early career teacher survival? In addition, this study sought to examine the role that first-year teachers’ job satisfaction (an indicator of thriving) plays in predicting career decisions and investigate the manner in which such satisfaction moderates relationships between teacher preparation, school climate, and administrative supports and turnover/retention outcomes. Put another way, what first-year factors are related to early career teachers thriving on the job, and what is the impact of thriving on survival in the profession?
Justifications for Scope
Early career teachers were the focus of this study due to the higher rates of turnover for this group of educators relative to their middle-to-late career peers.
Moreover, the scope of analysis was focused at the secondary level (i.e., middle and high school) due to the alternative labor market opportunities available to secondary teachers as a result of their pre-service content training and subject-matter expertise, particularly in math and science (Murnane, Singer, Willett, Kemple, & Olsen, 1991; National Academy of Sciences, 2007; National Research Council, 2002; Rumberger, 1987). The
11 findings from this study contribute to the current educational policy debates over best practices to recruit, prepare, retain, and sustain highly qualified and satisfied teachers with longevity in the profession. More broadly, this research adds to the body of literature that aims to answer the following question: how can we transform the vocation of
teaching from a “profession that eats its young” (Osborne, 1992) to a profession that fully supports the development of its newcomers?
The vast majority of studies on teacher turnover are cross-sectional or cover a limited timeframe of teachers’ careers (Ingersoll & Strong, 2011; Borman & Dowling, 2008; Raue, Gray, & O’Rear, 2015). In recent decades, several quantitative studies have been published using data from the Schools and Staffing Survey (SASS) and its
companion Teacher Follow-up Survey (TFS) to examine teacher turnover across a two-year period (e.g., Ingersoll, 2001, 2002; Boe, Cook, & Sunderland, 2008; Boe, Bobbitt, & Cook, 1997; Shen, 1997). In spite of these efforts, there is a current need for research that examines the career path of teachers longitudinally (Raue, Gray, & O’Rear, 2015) and on a national scale. This dissertation research fills that need by examining data collected from a national sample of beginning teachers through their first five years of teaching using the BTLS. The longitudinal nature of the BTLS allows for a stronger
methodological design compared to studies that use the SASS and TFS to study early career turnover over a shorter time period. Furthermore, those studies that do use
longitudinal data tend to be state- or district-specific, whereas the use of the BTLS allows for broader generalizations to our nation’s teachers as a whole.
12
Justifications for Methodology
This research is also unique in that a competing risks discrete-time survival model was developed to address questions of whether, when, and why beginning teachers choose to turn over. While the use of survival analysis and event history analysis is not unprecedented in the teacher turnover literature (e.g., Adams, 1996; Imazeki, 2005; Clotfelter, Ladd, Vigdor, & Diaz, 2004; Fleener & Dahm, 2007; Kelly, 2004; Scafidi, Sjoquist, & Stinebrickner, 2007), this study is unique in that it will be the first work to employ survival analysis for a longitudinal data set with a national sample of beginning teachers. The use of the BTLS allowed for the construction of a teaching spell variable for each individual in the data – essentially capturing the length of their career and the turnover event they experience (e.g., stay, move, or leave). While logistic regression analysis is quite common in turnover research (e.g., Harris, 2007; Smith & Ingersoll, 2004; Ingersoll & May, 2012; Cannady, 2011; Perda, 2013), it has a major limitation in that it can only address research questions examining whether or not a teacher turns over and why. Survival analysis can answer a deeper question – whether and why a teacher turns over and how that differs based on when they make the choice to leave or move.
13
CHAPTER 2: REVIEW OF THE LITERATURE
Growing teacher shortages have made filling vacancies with qualified teachers increasingly difficult, and the impacts of these shortages are felt at both the national and local levels. Curbing teacher turnover by reducing rates of both mobility between schools and attrition from the profession has repeatedly been touted as the key to solving such shortages. Approximately 90% of the annual demand for teachers is driven by educators leaving their current teaching placements for other schools or other careers entirely, with two-thirds of those teachers turning over prior to retirement age in the early- or mid-career stages (Carver-Thomas & Darling-Hammond, 2017) constituting a “revolving door” within the teaching profession (Ingersoll, 2003). The problem continues to worsen as we see a consistent annual trend of increasing turnover rates among novice teachers who have taught for 5 years or less (Ingersoll, Merrill, & Stuckey, 2014). Moreover, annual turnover rates are rising even faster for early career teachers in poverty, high-minority, urban, and rural schools (Hanushek, Kain, & Rivkin, 2004).
By addressing the factors that generate high rates of mobility and attrition among novice teachers, school systems and policymakers can do more than just tackle the teacher shortage problem. Retaining more early career teachers in their current school placements can: (1) reduce the huge financial burdens on our schools and the broader education system to fill vacancies year after year (Haynes, Maddock, & Goldrick, 2014); (2) improve the health of schools by increasing both teacher quality and instructional quality while promoting staff cohesion, teacher morale, curriculum coherence, and a positive school climate (Ronfeldt, Loeb, & Wyckoff, 2013); and (3) provide more equitable education for students attending high-poverty, high-minority, urban, and rural
14 schools where the impacts of early career turnover tend to be magnified (Gagnon & Mattingly, 2015). Perhaps most importantly, retaining more early career teachers may increase student achievement not only for students in classrooms where teacher stay, but also for other students in the school (Rivkin, Hanushek, & Kain 2005; Clotfelter, Ladd, & Vigdor, 2006).
The issue of early career teacher retention is strongly tied to the evolution of a teacher’s professional identity such that the first-year experiences that shape each teacher’s identity-making process are likely to have lasting impacts on his or her career decisions far beyond the first year in the classroom (Lindqvist & Nordanger, 2016). Positive and negative experiences from the first year of teaching can carry over into the second, third, fourth, etc. years and inform an individual’s decision to turn over or remain in the field. This is not a new or novel concept in the literature; several researchers have pointed to the importance of the first year of teaching as initial experiences in the profession influence teachers’ satisfaction and success (Kilgore & Griffin, 1998; Bullough, 1987; Feiman-Nemser, 1983), and therefore, are likely to directly impact retention in later years.
This dissertation research employed existing data to explore the relationships between early career teacher turnover decisions and their experiences in the first year of teaching. From that exploration, this study identified manipulable, policy-amenable variables specific to the first year of teaching (i.e., teacher preparation, school climate, and administrative supports) that predict voluntary and involuntary early career teacher turnover and retention outcomes in secondary public school settings. In addition, this study examined the role that first-year teachers’ job satisfaction plays in predicting career
15 decisions and investigated the manner in which satisfaction in the first year of teaching moderates the relationships between teacher preparation, school climate, and
administrative supports and turnover/retention outcomes.
To situate the scope of this dissertation research within the body of literature on turnover, Chapter 2 begins with a discussion of the broader context of teacher attrition and mobility. Subsequently, it provides an overview of the financial impacts of turnover; presents implications for educational equity; discusses the negative effects of turnover on the health of schools; and establishes the problem of early career attrition. Misguided policy responses to beginning teacher turnover, the importance of teacher resilience, and gaps in the literature are also addressed. Then, the chapter outlines three theories of teacher turnover from which the conceptual model for this study is derived and identifies the teacher labor market perspectives through which the turnover and retention outcomes are defined. Next, the lasting impact of teachers’ first-year experiences on early career trajectories is demonstrated using relevant literature from the field to highlight the
influence of perceptions of preparedness to teach, perceptions of school climate, extent of administrative support, and satisfaction with teaching on decisions to stay, move, or leave over the first five years. The chapter concludes with a presentation and discussion of the conceptual model. This conceptual model was developed in response to the literature review and informed the model-building process described in Chapter 3.
The Big Picture of Teacher Turnover
Financial Impacts Nationally and Locally
At the national level, recent estimates of the annual cost of public school teacher attrition in the U.S. place the figure anywhere from $2.2 billion (Haynes, Maddock, &
16 Goldrick, 2014) to $7.3 billion (National Commission on Teaching and America’s
Future, 2007). At the school level, the U.S. Department of Labor estimates the average attrition cost to be about 30 percent of the departing teacher’s salary (Alliance for
Excellent Education, 2005; Grissom, 2011) while other studies have reported costs at 150 percent of that salary, depending on the variables included in the definition of “cost” (Benner, 2000). According to Wong and Asquith (2002), every teacher who leaves their position within the first 3 years drains an estimated $50,000 from school and district funds in recruitment costs, personnel expenditures, and lost productivity. This means that having to replace even one teacher diverts substantial financial and human resources away from addressing other critical school and district needs.
Schools are facing a “revolving door” of teacher turnover at a time when parents are pushing for smaller class sizes and teacher shortages in particular states and subjects are rising to epidemic levels (Hanushek, Kain, & Rivkin, 2004). These teacher shortages are, in part, fueled by a growing trend in which fewer high school graduates are interested in pursuing education as a career and fewer college students are enrolling in teacher preparation programs (Aragon, 2016). Meanwhile, the nation’s student population is rapidly growing. From 2012-2013 through 2024-2025, overall public school enrollment in the U.S. is expected to increase by 6 percent with some states seeing a boom as large as 26 percent (Glander, 2015). Under these pressures, schools with teaching vacancies have no choice but to expend their limited financial resources to recruit, hire, and train new teachers, instead of directing them to academic programs and students in need (Barnes, Crowe, & Schafer, 2007; Darling-Hammond & Sykes, 2003).
17
Implications for Social Justice and Educational Equity
The current teacher turnover crisis in the U.S. is more than just a financial matter, however – it is a social justice issue that poses a threat to achieving educational equity. This section demonstrates the link between increasing turnover rates in high-needs schools, diminished teacher quality, decreased opportunity to learn, and declining student achievement.
Diminished teacher quality. Studies have shown that teachers are more likely to move or leave teaching when their current placement has them working in schools with lower student test scores, a greater number of students from low socioeconomic
backgrounds, and higher proportions of minority students (Scafidi, Sjoquist, & Stinebrickner, 2007; Lankford, Loeb, and Wyckoff, 2002; Hanushek et al., 2004). Moreover, through the turnover phenomenon, teachers distribute and redistribute themselves across schools such that institutions serving high-minority and high-poverty students in urban and rural areas tend to be staffed by teachers with fewer qualifications and less classroom experience (Lankford et al., 2002; Loeb, Kalogrides, & Horng, 2010; Ingersoll & May, 2012). Thus, educator mobility and attrition diminish teacher quality in disadvantaged schools. This finding is highly problematic as most scholars in the field agree that teaching quality is the most influential school-related factor that contributes to student learning (Darling-Hammond & Youngs, 2002; Darling-Hammond, Berry,
Haselkorn, & Fideler, 1999; Loeb, Darling-Hammond, & Luczak, 2005; Ferguson, 1998; Goldhaber, 2003; Palardy & Rumberger, 2008; Rivkin, Hanushek, & Kain, 2005; Wright, Horn, & Sanders, 1997; Sanders & Rivers, 1996).
18
Decreased student achievement. The demonstrated link between teacher mobility and teacher quality in traditionally disadvantaged, hard-to-staff environments also has adverse effects on student achievement. In a recent study, Ronfeldt, Loeb, and Wyckoff (2013) estimated the effects of teacher turnover in New York City public schools on student test scores in English language arts and math; they found that students in grade levels with higher turnover rates scored lower on standardized assessments than their peers attending schools with faculty stability. The negative effects of turnover on achievement were even stronger in those schools with higher proportions of Black students and students with histories of low performance. Low student achievement in such high-needs schools then perpetuates the cycle as low student scores increase the likelihood of teacher mobility which depresses teacher quality and yields additional declines in student learning. Of those teachers who leave low-performing schools, the more effective transfers tend to move to high-achieving schools, while the less effective transfers stay in low-performing schools. This exacerbates differences across students in the opportunities they have to learn (Boyd, Grossman, Lankford, Loeb, & Wyckoff, 2008).
There is also evidence of higher teacher turnover rates in schools traditionally classified as urban and high-poverty with lower student achievement (Rivkin, Hanushek, & Kain 2005; Clotfelter, Ladd, & Vigdor, 2006). The Alliance for Excellent Education (Haynes, Maddock, & Goldrick, 2014) recently reported that turnover rates in high poverty schools were 50% greater than those rates in more affluent districts. These increased teacher mobility and attrition rates mean that a disadvantaged school is more likely to continually employ a disproportionately high number of early career teachers
19 who have been shown to be significantly less effective than their more experienced peers (Grissom, 2011; Ronfeldt, Loeb, & Wyckoff, 2013).
Turnover as a threat to educational policies for equity. In the current age of educational reform, we strive to provide every child access to skilled teaching so that all students may achieve at high levels, but the present rates of attrition and mobility directly conflict with the goal of staffing all classrooms with effective teachers. With the 2001 reauthorization of the Elementary and Secondary Education Act of 1965 (ESEA), No Child Left Behind (NCLB) required that teachers of core academic areas be highly qualified in the subjects they teach by the end of the 2005–06 school year. The Race to the Top (RTTT) program of 2009 provided grant funding to states in order to increase teacher efficacy and achieve equity in the distribution of teachers across schools. Now with the 2016 reauthorization of ESEA, the Every Student Succeeds Act (ESSA) seeks to ensure that students in high needs schools are being taught by effective teachers who are led by effective principals. However, the consistent concentration of teacher turnover in disadvantaged schools has and will continue to seriously compromise our capacity to ensure that the goals of policies like NCLB, RTTT, and ESSA are met on a national scale.
Consequences for the Health of Schools
Employee turnover across all professions, not just teaching, has been extensively studied by economic researchers and is considered to be an important mechanism of the labor market due to its perceived negative impact on organizational effectiveness (Price, 1977; Perda 2013). Excessive employee turnover in any organization may lead to