DOI 10.1007/s10009-010-0170-x W S E 2 0 0 9
Automating regression testing using web-based application
similarities
Kinga Dobolyi · Elizabeth Soechting · Westley Weimer
Published online: 19 September 2010 © Springer-Verlag 2010
Abstract Web-based applications are one of the most widely used types of software, and have become the back-bone of many e-commerce and communications businesses. These applications are often mission-critical for many orga-nizations, motivating their precise validation. Although regression testing has been widely used to gain confidence in the reliability of software by providing information about the quality of an application, it has suffered limited use in this domain due to the frequent nature of updates to web-sites and the difficulty of automatically comparing test case output. We present techniques to address these challenges in regression testing web-based applications. Without precise comparators, test cases that fail due to benign program evo-lutions must be manually inspected. Our approach harnesses the inherent similarities between unrelated web-based appli-cations to provide fully automated solutions to reduce the number of such false positives, while simultaneously return-ing true faults. By applyreturn-ing a model derived from regression testing other programs, our approach can predict which test cases merit human inspection. Our method is 2.5 to 50 times as accurate as current industrial practice, but requires no user annotations.
Keywords Testing·Web·Oracle·Comparator·Model 1 Introduction
Web-based applications have become an integral part of the global economy, with Internet-based e-commerce projected to reach over one trillion dollars by 2010 [43]. Despite their pervasiveness, most web-based applications are not K. Dobolyi (
B
)·E. Soechting·W. WeimerUniversity of Virginia, Charlottesville, USA e-mail: [email protected]
developed according to a formal process model [32]. Web-based applications are subject to high levels of complex-ity and pressure to change, manifesting in short delivery times, emerging user needs, and frequent developer turn-over, among other challenges [35]. Under such extreme cir-cumstances, systems are delivered without being tested [35], potentially resulting in functionality losses on the order of millions of dollars per hour [31,46,49]. Such breakdowns are not isolated incidents; user-visible failures are endemic to about 70% of top-performing web-based applications, a majority of which could have been prevented through ear-lier detection [40]. Such monetary losses can be avoided by designing web-based applications to meet high reliability, usability, security, and availability requirements [28], which translates into well-designed and well-tested software.
Regression testing is an established approach for gaining confidence that a program continues to implement its specifi-cation in the face of recurring updates, and is a major part of software maintenance [34]. Maintenance activities consume 70% [8] to 90% [39] of the total life cycle cost of software, summing to over $70 billion per year in the United States [36,47], with regression testing accounting for as much as half of this cost [19,37]. For software in general, a lack of resources often restricts developers to utilize only a fraction of the available regression tests [16,25,53]. Unfortunately, web-based application testing is often perceived to be lacking a significant payoff [17], making the likelihood of investing in rigorous testing even more remote in this domain.
One major challenge with any regression testing approach is that it is often limited by the effort required to compare results between two versions of program output. Formally, testing can be viewed in terms of an oracle mechanism that produces an expected result and a comparator that checks the actual result against the expected result [5]. The oracle is commonly taken to be the output of a previous, trusted
version of the code on the same input and the comparator is a simple lexical comparison, such asdiff, of the two outputs. Any difference is inspected by developers, as it is commonly an error in the new version, or may indicate an outdated expected output (for example, when the output legitimately changes due to new functionality). Unfortunately, traditional regression testing is particularly burdensome for web-based applications [44] because usingdiffas the comparator pro-duces too many false positives [46]. For example, rerunning a test suite of a web-based application may result in otherwise-identical output with a different footer, timestamp, session cookie, or dynamically generated elements. Whilediff-like tools have the strength of not producing any false negatives, a diffof older output against newer output will almost always flag a potential error, even if no new defect has been intro-duced. Each new version of the software may compound the problem when other natural program evolutions take place, by adding more and more changes flagged bydiffthat are not actual errors. Therefore, a regression testing approach for web-based applications would have to reduce the number of false positives associated with a naïvediff-like compara-tor, as well as provide an acceptable level of automation and refrain from missing actual faults. Although automating the replay of existing regression test suites is relatively straight-forward in this domain, automating the comparator process remains an active research area.
This paper presents Smart, a tool for reducing the cost of regression testing for web-based applications by providing a highly precise oracle comparator. We propose to combine insights from structural differencing algorithms (e.g., [3]) in addition to semantic features (e.g., [44]) into a distance metric for test case output.1This distance metric forms the center of a highly precise oracle comparator which indicates test case outputs need human inspection when its distance from the oracle output exceeds a certain cutoff.
We first present our technique in a context where a small fraction of the regression testing output is manually inspected as normal, and that information is used to train a comparator based on our features; the comparator then flags which test cases in the rest of the output require human inspection. We then expand upon this proof-of-concept by demonstrating that the oracle comparator process can be completely auto-mated in this domain, obviating the need for manual train-ing data, because inherent similarities between web-based applications can be used to reduce the cost of regression test-ing them. We hypothesize that errors in web-based applica-tions can be successfully modeled due to the tree-structured nature of XML/HTML output, and that unrelated web-based
1In this paper we use the term feature to refer to the set of all arguments used by our distance metric: a feature is an aspect of test case output pairs, such as the ratio of natural language text between two HTML documents.
applications fail in similar ways. These similarities derive from the common multi-tiered and multi-component struc-tures of these applications, and include behaviors such as corralling errors into user-visible HTML. Both our fully-automated and partially-fully-automated comparators can be considered successful if they reduce false positives (i.e., cor-rectly tell developers not to inspect test cases that have small changes but do not indicate faults) while minimizing or avoid-ing false negatives (i.e., incorrectly tells developers not to inspect actual defects). In our experiments, a diff-based comparator incorrectly labels non-faulty output as requiring inspection 70–90% of the time; our approaches typically have fewer than 1% false positives.
Existing comparators for web-based applications typically have false positive rates in the 4% range [45], although these false positives resulted from testing on a single version of the software using seeded faults. By contrast, this paper focuses on finding faults between different versions of applications, where the number of false positives reported by such tools increases due to innocuous program evolutions. Additionally, some previous approaches [45] require training on the target application to achieve their false positive values. By con-trast, we present an automated oracle comparator that does not require manually training the tool. The main contribu-tions of this paper are:
– A set of structural and syntactic features that are used to determine if web-based application regression test output should be inspected by human developers.
– An experimental evaluation of a proof-of-concept model and distance metric using those features.
– A quantitative and qualitative comparison of the relative power of those features, with a discussion of the possible impact on regression test practices.
– An automated oracle comparator model that meets or exceeds the performance of the proof-of-concept model that requires manually-provided training data.
A portion of these main contributions have been presented previously [10,42]. This paper additionally includes the following:
– A more expansive base of benchmark programs for empirical evaluation showing how an automated oracle comparator model can utilize the tree structured nature of web-based application output and underlying program similarities successfully. In particular, we double the lines of code compared to previous work with the addition of three real-world browser-based applications used by over 24,000–300,000 customers worldwide that rely heavily on non-deterministic output.
– An additional experiment comparing the average feature values for erroneous output compared to correct output.
– An additional experiment evaluating our model’s perfor-mance when training our comparator on project-specific data only.
– A deeper analysis of relative feature powers used by our automated comparator. We identify four features that were either important in every benchmark, or were highly indic-ative of actual bugs, and discuss their relation to the types and severities of bugs they tended to reveal.
– An additional experiment evaluating our automated com-parator on the new real-world browser-based applica-tion benchmarks that includes an analysis of the sever-ity of actual bugs our tool failed to flag. Relying on an automated model of fault severity from [11,12], we are able to quantitatively and qualitatively assign consumer-perceived severity ratings to the faults uncovered and missed by our approach, with the expectation that missed faults will generally be non-severe.
2 Motivating examples
Testing the functional components of web-based applica-tions is usually achieved by some form of capture-replay (as opposed to non-functional validation such as HTML valida-tion, link testing, or load testing), where tester input sequences are recorded and replayed [13]. For these kinds of tests the oracle output is often HTML output of a previous, trusted version of the application, anddiffis used to com-pare the oracle output with the actual test output. In situations where the two outputs differ, manual inspection is required. Unfortunately, the human interpretation of test results is a “tedious and error-prone task” [46] and is potentially more burdensome for web-based applications due to the frequent false positives associated with adiff-like comparator.
Consider the following example from a diff of two
Gcc- Xmltest case outputs [15] (the text above the dashed
line was generated by the older application, while the rest is output from the newer version).
In both versions the same <Namespace> and
<Function>elements are being defined.
The main difference is that the newer version of the appli-cation contains new functionality in the form of additional attributes, such as mangled="_Z3fooii" on line 5. A diff-like comparison for regression testing these two
outputs would lead to a false positive in this instance. Furthermore, we hypothesize that web-based applications often evolve through the addition of new attributes to exist-ing elements, as one example of a typical change that should generally not indicate an error in regression testing. A more precise oracle-comparator should be able to avoid flagging the situation above as an error, and such a comparator may be completely automated by recognizing that many web-based applications evolve in this predictable way with the addition of new element attributes.
Similarly, HTML code is often updated in ways that do not change the appearance or functionality experienced by the consumer. Consider thediffoutput from two txt2html test case versions [48] (the newer output is below the dashed line): the newer version).
As in the previous example, the<table>element contains
a new attribute (summary). The newer output also matches
the paragraph tag<p>with a closing tag, probably because newer versions of HTML will not support unmatched tags, although most browsers will display these two bits of code equivalently. As in the previous example, adiffof these two outputs would yield a false positive due to any of the reasons mentioned above.
Using diff-like comparators for the above examples, in addition to outputs that involve small natural language changes, reformatting, or nondeterministic output that changes with every run of the application, would yield a high number of false positives because humans would not con-sider these changes errors. Simply ignoring certain classes of website updates, however, raises the possibility of miss-ing actual bugs. This paper shows that it is possible to provide a highly precise oracle comparator that reduces the false pos-itives in test output comparison that occur with more naïve approaches, while minimizing the number of false negatives.
3 Modeling test case output differences
The goal of our approach is to save developers effort dur-ing regression testdur-ing web-based applications, primarily by reducing the number of false positives obtained withdiff -like tools. We specifically focus on web-based applications due to the tree-structured nature of their output; trees are well-formed objects with a directed edge relationship. Although recent work has explored using semantic graph differenc-ing [33] and abstract syntax tree matching [27] for analyz-ing source code evolution, such approaches are not helpful in comparing XML and HTML text outputs. Not only do
these approaches depend on the presence of source code con-structs such as variables and functions, which are absent in generic HTML, to make judgments, but they are meant to summarize changes rather than determine error instances. By contrast, Smart relies on tree representations to decide the relative importance of changes between two versions of output with respect to their structural significance. Our ora-cle comparator, Smart, is a model, composed of a distance metric and a cutoff, that labels test case output pairs. We use a distance metric to quantify the difference between a pair of program outputs that is based on the weighted sum of individual features. If the distance exceeds a specified cut-off, the test case output pair is labeled as requiring human inspection. Rather than hard-wiring any knowledge of pro-gram semantics, Smart empirically learns the weights and cutoffs on a per-project basis via least-squares linear regres-sion. This model was chosen over other techniques because it is straightforward to analyze; Sect.4.2presents the results of an analysis of variance of the relative contribution of var-ious features towards an accurate classification of test case output.
Our approach classifies test case output based on structural and syntactic features of tree-structured documents. Most features are relatively simple, such as counting the number of inserted elements when converting one tree into the other. Each feature is assigned a numeric weight that measures its relative importance. A pair of test cases outputs is labeled as requiring inspection whenever the weighted sum of all its feature values exceeds a certain cutoff. Both the weights and cutoff are learned empirically by training the model; we return to this issue when discussing our experimental setup (see Sect.4.1.2).
3.1 Tree alignment
In order to recognize such features, the input trees must first be aligned by matching up nodes with similar elements. An alignment is a partial mapping between the nodes of one tree and the nodes of the other. To see why this alignment is necessary, consider these two HTML fragments: the newer version).
We must know how the fragments align before we can count features: if we align thetextBsubtree of #2 with the
textAsubtree of #1, we can count an inversion between the <u>and<b>tags. However, if we align thetextBsubtree of #2 with thetextBsubtree of #1, we can count inversions between the<u>,<b>and<i>tags.
This insight motivates us to find an alignment based on the minimal number of changes that enumerate the difference between two test case outputs. We adapt the diffX [3]
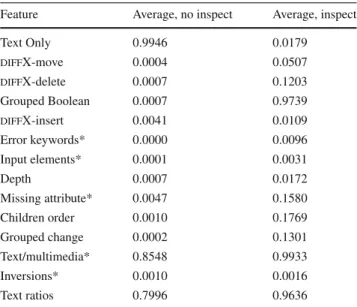
algo-Table 1 The average values of our features for test cases flagged by diffthat (1) do not merit manual inspection and (2) do merit manual inspection, as determined by our human annotators
Feature Average, no inspect Average, inspect
Text Only 0.9946 0.0179 diffX-move 0.0004 0.0507 diffX-delete 0.0007 0.1203 Grouped Boolean 0.0007 0.9739 diffX-insert 0.0041 0.0109 Error keywords* 0.0000 0.0096 Input elements* 0.0001 0.0031 Depth 0.0007 0.0172 Missing attribute* 0.0047 0.1580 Children order 0.0010 0.1769 Grouped change 0.0002 0.1301 Text/multimedia* 0.8548 0.9933 Inversions* 0.0010 0.0016 Text ratios 0.7996 0.9636
Each feature is individually normalized to 1.0. Features with an asterisk are atomic features not dependent on the diffX mapping between two output pairs
rithm for calculating structural differences between XML documents to compute alignments on general tree-structured data. Aligning the newer and older output trees allows Smart to identify both local features derived from element pairs, as well as global features such as the addition of natural lan-guage text spattered across multiple locations in the newer document.
Our technique employs features that fall into two loose categories: identifying differences in the tree structure of the output, and emulating human judgment of interesting differ-ences between two XML or HTML pages, detailed below. Most of the features are derived from the diffX mapping; the remaining atomic features are indicated with an asterisk in Table1.
3.2 Tree-based differences
Unlike flat text files, the nested tree structure of XML/HTML output allows for the potential to classify many differences as either faults or non-faults through an analysis of the tree structure. Features may be positively or negatively correlated with test output errors, depending on the application being examined.
The diffX Algorithm Three of our features are taken from a variant of the diffX [3] algorithm that we adapted to work on HTML and XML files. The algorithm computes the num-ber of moves, inserts and deletes required to transform the first input into the second. It does this via bottom-up exact tree matching combined with top-down isolated tree fragment
mapping; this amalgamated approach provides a high qual-ity characterization of the relationship between the two input trees.
We hypothesize that moves, inserts, and especially deletes frequently correlate with bugs, and that the size of the change indicates the severity of the error. For example, a failure that results in a stack trace being printed will involve a deletion of a large amount of data and an insertion of the trace itself. Considering moves instead of delete-insert pairs reduces the number of changes between two trees.
Inversions Inverted elements are unlikely to indicate errors in web-based application output. To calculate inver-sions, we perform a pre-order traversal of all nodes in both of the document trees, removing text nodes as we are interested in structural inversions. We then sort each list and calculate the longest common subsequence between them. All nodes not in the common subsequence are removed and the lists are unsorted, returning the remaining nodes to their original rel-ative orders. We finally walk the lists in tandem, comparing element pairs and counting each difference; each difference is a structural inversion.
Grouped changes We note when a set of elements that form a contiguous subtree are changed as a group, measur-ing the size of the grouped change in terms of the number of elements involved. We hypothesize that clustered edits are more likely to be deserve inspection, often because they contain missing components or lengthy exception reports, as opposed to small changes scattered throughout the document. We also record a boolean feature that notes the presence or absence of grouped changes.
Depth of changes The relative depth of any edit operation within a tree is measured under the hypothesis that changes closer to the root are more likely to signal large semantic differences and thus more likely to merit human inspection. Changes to only text nodes We record with a boolean feature whether the changes between two documents are restricted only to the natural language text in the trees. We expect that documents with such text-only differences are unlikely to contain semantic errors and thus should not be inspected. This feature in particular allows our approach to outperform diff-like comparators, through the ability to ignore natural-language text changes.
Order of children We record cases where two matched nodes are otherwise the same but the ordering of their chil-dren has changed. We hypothesize that changes in the order of child nodes do not indicate high-level semantic errors and thus should not be inspected.
3.3 Human-judgment differences
The rest of our features attempt to emulate judgments that a human would make on two test case outputs. These features
are specific to HTML and aim to model how a human would view differences.
Text and multimedia ratios Natural language and graphics significantly influence human interpretation of a webpage. We measure the ratio of displayed text between two versions as well as the ratio of displayed text to multimedia objects. Small changes, such as replacing a textual link with a button are unlikely to warrant human inspection. Replacing large amount of text, however, may be more likely to associate with errors such as stack traces.
Error keywords Web-based applications often exhibit similar failure modes. Beyond the standard error messages displayed by web servers (such as 404 errors), many other violations are tied to the underlying languages, and can be reasonably predicted by a textual search of the document for error keywords, such as “exception”. Searching for nat-ural language text to signal page errors has been previously explored in [4]. Output pairs containing error keywords in the newer version, but not in the older, are likely to merit human inspection.
Changes to input elements Input elements, such as buttons and forms, represent the primary interface between consum-ers and the application. We note the changes to these input elements under the hypothesis that a missing button or form indicates a significant loss of functionality and should be examined.
Changed or missing attribute values Finally, we note when two aligned elements contain the same attribute but have a different attribute value. Consider the followingdiff out-put:
If the two<Type>elements on lines 1 and 3 are aligned
then the change from‘‘int’’to‘‘unsigned int’’
rep-resents a meaningful change. Note that this is different than an instance where the second <Type> has a new attribute
that the original does not. Changed attributes may or may not be significant; consider the semantic difference between an update toheightattribute of an image as opposed to the mistyping of aactionattribute of a form element. We hypothesize that removing attributes, however, will generally be likely to merit human inspection.
3.4 Feature validation
In this subsection, we validate some of the assumptions that underlie our approach. We determine whether it is reason-able to use tree-structured features to detect test case outputs that merit human inspection. We establish that our features generally take on different values for differences that merit human inspection than for differences that do not.
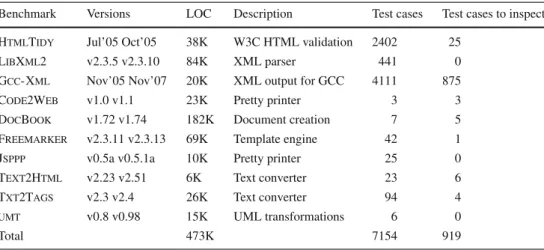
Table 2 The benchmarks used in our experiments
The “Test cases” column gives the number of regression tests we used for that project; the “Test cases to inspect” column counts those tests for which manual inspection indicated a possible bug
Benchmark Versions LOC Description Test cases Test cases to inspect HtmlTidy Jul’05 Oct’05 38K W3C HTML validation 2402 25
LibXml2 v2.3.5 v2.3.10 84K XML parser 441 0 Gcc- Xml Nov’05 Nov’07 20K XML output for GCC 4111 875 Code2Web v1.0 v1.1 23K Pretty printer 3 3 DocBook v1.72 v1.74 182K Document creation 7 5 Freemarker v2.3.11 v2.3.13 69K Template engine 42 1 Jsppp v0.5a v0.5.1a 10K Pretty printer 25 0 Text2Html v2.23 v2.51 6K Text converter 23 6 Txt2Tags v2.3 v2.4 26K Text converter 94 4
umt v0.8 v0.98 15K UML transformations 6 0
Total 473K 7154 919
Table1shows the average normalized features on 919 test cases used in our experiments (see Table2). For example, the normalized value of our feature that measures whether changes were to text only is 0.9946 for test case output that need not be inspected and 0.0179 for test case output that should be inspected. We return to this issue in Sect.4.2when we present an analysis of variance to inspect feature impor-tance; the normalized values in Table1are provided simply as a means of viewing the data in this preliminary experi-ment: our actual model does not normalize feature values. Extracting our features from the output of one test case took 2 s on average, and never more than 30 seconds, on a 3 GHz Intel Xeon computer.
3.5 Model evaluation
Having established that it should be possible to classify test case output based on the features discussed above, we must next define a way to evaluate the performance of such a model. The key task of Smart is, given the oracle output for a test case and the current output for that same test case, to indicate whether a potential error should be flagged and the situation evaluated by a human. Consequently, it is pos-sible that we flag non-faults as requiring inspection; these false positives yield wasted developer effort as humans fruit-lessly inspect correct output. Whenever our tool fails to flag actual faults, these false negatives may result in consumer-visible bugs after deployment and revenue losses. We use precision and recall, metrics from the domain of information retrieval [38], to measure our model’s success at this task:
recall= |Desir ed∩Ret ur ned| ÷ |Desir ed| precision= |Desir ed∩Ret ur ned| ÷ |Ret ur ned|
Here Desired refers to the test cases which are actual bugs and our model also labels as such (true positives). Returned
are all the test cases flagged as potential errors by our model, which is composed of both the actual faults correctly flagged by Smart, as well as the non-faults we flag as requiring inspection. Recall is defined as the ratio of desired error test cases our model returns over the total number of desired error values (in other words, how close are we to finding all the desired error cases). A low recall value indicates that our model is missing too many actual errors (i.e., has too many false negatives). Precision refers to the number of actual error test cases our model flags as a fraction of the total num-ber of values returned — in other words, what fraction of our model’s output is correct. A low precision value implies that we have too many false positives and would waste sig-nificant amounts of developer effort. Because precision can be trivially maximized by returning only a single error, and recall can be similarly maximized by returning all test case pairs as errors, we combine precision and recall by taking their harmonic mean: 2 pr÷(p+r). The result is called the F1−scor e, and gives equal weight to the two variables [9].
4 Model validation
We first evaluate Smart on ten open-source benchmarks that produce either XML or HTML output, totaling 473,000 lines of code, summarized in Table2. In order to provide a real-istic regression testing simulation, we chose benchmarks for which multiple versions were available, to capture as many natural program evolutions as possible. We supplemented our three large benchmarks with seven smaller ones to vary the domains of the applications examined in this proof-of-concept experiment. Because these additional benchmarks have significantly fewer test cases than the primary three applications, Sect.7supplements our dataset with over 6000 additional test cases from three real-world, PHP browser-based applications.
For each benchmark, we manually inspected the test case output generated by the two versions of the benchmark indi-cated on the same benchmark-specific test suite. Our manual inspection marked the output as “definitely not a bug” or “possibly a bug, merits human inspection”. In an effort to not rule out actual bugs, we conservatively erred on the side of requiring human inspection. Each test case was annotated twice, re-examining situations where the two annotations did not initially agree, to maintain consistency. Our initial exper-iments involve 7154 pairs of test case output, of which 919 were labeled as requiring inspection.
4.1 Experiment 1: model selection
In this experiment, the feasibility of our approach is evalu-ated when phrased as an information retrieval task. We create a linear regression model based on the features from Sect.3 and select an optimal cutoff to form a binary classifier. 4.1.1 Cross validation
In order to validate our approach, our initial experiment involves testing and training on the same data. One poten-tial problem with such an approach is biased from over fit-ting on our dataset. To mitigate this threat, we used tenfold cross validation [22]. We randomly assigned test cases from all benchmark programs into ten equally-sized groups. Each group is reserved once for testing, and the remaining nine groups are used to train the model; we thus never train and test on the same data. The cross validation results are then averaged across each batch and compared to the results when we tested and trained on the entire dataset. If the two out-comes are not significantly different, we can conclude that we were not subject to bias.
4.1.2 Experimental procedure
Smartclassifies pairs of tree-structured outputs as either
requiring human inspection or not. In this experiment: 1. We first perform the cross-validation steps (Sect.4.1.1).
On each iteration, we train a linear model as if the response variable (i.e., our boolean human annotation of whether a human should inspect that output or not) were continuous in the range[0,1].
2. The real-valued model outputs are turned into a binary classifier by comparing against a cutoff by performing a linear search to find a model cutoff. Smart will flag the test case as needing inspection or not depending on how the response variable compares to the cutoff. We choose the cutoff and comparison that yield the highest F1-score for each validation step.
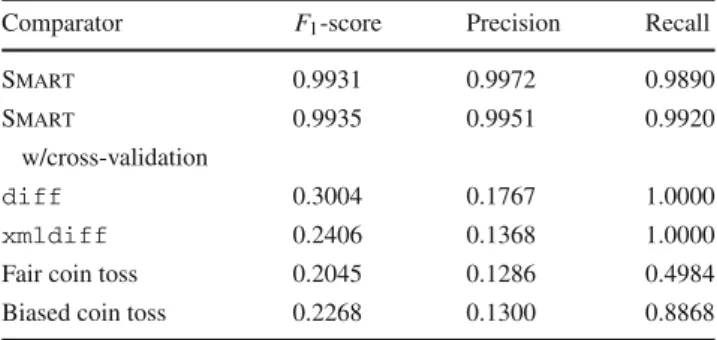
Table 3 The F1-score, precision, and recall values for Smart on our entire dataset
Comparator F1-score Precision Recall Smart 0.9931 0.9972 0.9890 Smart 0.9935 0.9951 0.9920
w/cross-validation
diff 0.3004 0.1767 1.0000
xmldiff 0.2406 0.1368 1.0000
Fair coin toss 0.2045 0.1286 0.4984
Biased coin toss 0.2268 0.1300 0.8868
Results for diff, xmldiff, and random approaches are given as baselines;diffrepresents current industrial practice
3. After cross-validation, the model is trained and tested on our entire dataset. We again find the best model cutoff and comparison to maximize the F1-score.
4.1.3 Results
Table3shows our precision, recall, and F1-score values for our dataset. As a point of comparison, we also computed the predictive power of other comparator approaches, namely, diff, xmldiff[2],2 coin toss, and biased coin toss as baseline values. The fair coin returns “no” with even prob-ability. The biased coin returns “no” with probability equal to the actual underlying distribution for this dataset:(7154− 919)/7154 (which is generally not known in advance).
Smarthas clear advantages in predictive power over all of
our baselines, with our approach yielding three timesdiff’s F1-score.
As shown in Table3, little to no bias was revealed by cross-validation. The absolute difference in F1-score between the model and its corresponding averaged cross validation steps was 0.0004.
4.2 Experiment 2: feature analysis
Having established that Smart is able to successfully flag both faults and non-faults, we evaluate relative feature impor-tance and determine which features correlate with output that should be inspected. Table4shows the results of a per-feature analysis of variance on the model using the entire dataset, listing only those features with a significant main effect. F denotes the F -ratio, which is close to 1 if the feature does not affect the model; conceptually F represents the square root of variance explained by that feature over variance not explained. The p column denotes the significance level of
2 xmldiff, an off-the-shelfdiff-like tool for XML and HTML [2],
was a worse comparator than than basicdiffbecause it was unable to process some benignly ill-formatted output.
Table 4 Analysis of variance of our model
A + in the “Coefficient” column means high values of that feature correlate with test cases outputs that should be inspected (both + and – indicate useful features). The higher the value in the “F” column, the more the feature affects the model. The “ p” column gives the
significance level of F; features with no significant main effect ( p≥0.05) are not shown
Feature Coefficient F p Text only −0.288 168970 <0.001 diffX-move +0.002 150840 <0.001 diffX-delete +0.029 46062 <0.001 Grouped Boolean +0.714 7804 <0.001 diffX-insert +0.029 4761 <0.001 Grouped change −0.012 465 <0.001 Children order −0.002 317 <0.001 Inversions +0.001 246 0.020 Missing attribute −0.048 121 <0.001 Error keywords +0.174 115 <0.001 Depth −0.000 21 <0.001 Text ratios −0.007 18 <0.001 Input elements −0.019 5 0.030
F (i.e., the probability that the feature does not affect the model).
Our most significant feature was whether or not the dif-ference between a pair of test cases output could be quaran-tined to only low-level text. We found that text-only changes have a strong negative effect on human inspection, and rely-ing on such a feature is one of the key reasons we are able to outperformdiff, because many web-based applications may update natural language text as part of normal program evolutions.
Our second most important feature was diffX-move, which, by contrast, was frequently correlated with test case errors. Rather than relying on only insertions or deletions, moves are able to capture both of these types of changes as a move always occurs in conjunction with any of the other two edits. Consequently, despite the high F -ratio of the diffX-move feature, its model coefficient was an order of magnitude smaller than those of insert or delete. There-fore, although moves were most frequently associated with actual bugs, other features also had to be present in order for the test case output to merit human inspection. Our boolean feature that indicated the presence of clustered changes was also highly correlated with errors. Notably, grouped changes were more important than diffX-inserts, which may have been scattered across the output.
Some of our features were less powerful than we origi-nally hypothesized. For example, the presence of error key-words did not effect our model as much as the features listed above. We return to the issue of error keywords in Sect.7.2.3. Despite the moderate F -ratio of this feature, its coefficient was the highest across all features, indicating that it was strongly predictive of error instances when present.
Additionally, Smart depends heavily on the diffX algo-rithm to calculate structural changes between pairs of web-based application output. diffX is an approximation, and
any errors in mapping one output tree to another may reduce the performance of our approach. To investigate the impact of diffX’s potential false positives and false negatives on
Smart’s performance, we conducted a pilot study where
we manually perturbed the number of diffX-reported inser-tions, deleinser-tions, and moves reported by between zero and at one standard deviation for each of these three features. We then examined changes in Smart’s performance when these error-seeded diffX feature values were randomly applied to between 0 and 100% of the test case output pairs. Overall, even in the worst case, where every output pair’s feature val-ues were perturbed by an entire standard deviation, the F1-score for our dataset decreased by at most 0.001, suggesting that our overall model is robust to errors in the underlying structural mapping.
To gain additional insight into relative feature power and number of required features beyond that provided by the F -values in Table 4, we also conducted a “leave-one-out” experiment. We cumulatively removed one feature at a time, starting with the feature with the lowest F -value. When removing up to four of the lowest-performing four features (Input Elements, Text Ratios, Depth, and Error Keywords), the F1 score varied by less than 0.001. F1-scores dropped from 0.99 to to 0.98 when only three features remained, and dropped to 0.26 when only two features remained. Although some of the changes in F1 score seem small, subsequent experiments (e.g., Table 6) demonstrate that even a 1% increase in false positives has a severe impact on the real-world usability of the technique.
4.3 Experiment 3: project-specific models
Having established the feasibility of training such a gen-eral comparator, we investigated whether it was possible to improve our model’s performance when training a tailored
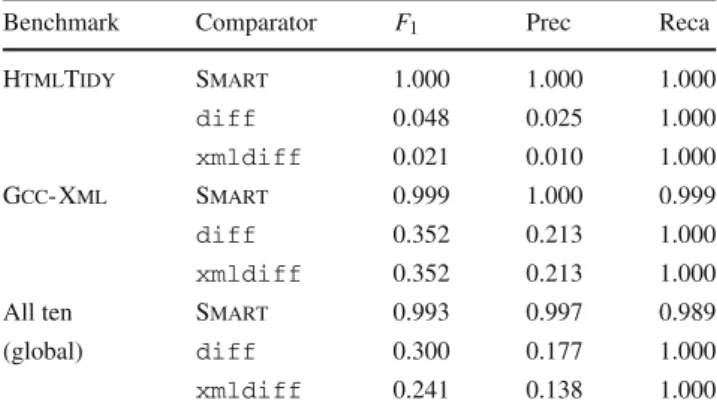
Table 5 F1-score, precision (Prec), and recall (Reca) when trained and tested on individual projects, as well as all ten of our benchmarks
Benchmark Comparator F1 Prec Reca
HtmlTidy Smart 1.000 1.000 1.000 diff 0.048 0.025 1.000 xmldiff 0.021 0.010 1.000 Gcc- Xml Smart 0.999 1.000 0.999 diff 0.352 0.213 1.000 xmldiff 0.352 0.213 1.000
All ten Smart 0.993 0.997 0.989
(global) diff 0.300 0.177 1.000
xmldiff 0.241 0.138 1.000
Results fordiffare presented as a baseline
comparator for specific projects. We used the same experi-mental setup for our per-project classifiers described in Sect.4.1.2. We restricted attention to the 6513 test case out-put pairs for Gcc-Xml and HtmlTidy, because those two benchmarks were large enough to be feasible for individual study. Table5shows Smart’s average F1-score, precision and recall values when trained and tested on each program separately.
For HtmlTidy we obtain perfect performance, with no false positives or false negatives. Our precision is thus an order of magnitude better than that ofdiff: our technique presents only 25 test case outputs to developers compared to the 960 flagged bydiff.
For Gcc-Xml we obtain near-perfect recall (0.999) and perfect precision; we present 874 test cases for human inspec-tion compared todiff’s 4100, but we fail to flag one test case that did merit human inspection.
Project-specific feature weights contributed to our strong per-project performance. For example, the diffX-delete and
diffX-insert features were equally important for the HtmlTidyproject, but not across all benchmarks. As another
example, diffX-insert and error keywords were significantly associated with errors in HtmlTidy but not at all in
Gcc- Xml. Intuitively, using our technique for either of the
projects alone is always advantageous. When the same global model is applied to all ten benchmarks, however, recall suf-fers: we fail to present some actual regression test errors for human inspection.
5 Training the model with human annotations
Although Smart has near-perfect precision and recall in our experiments so far, it is unlikely that humans will be will-ing to annotate ninety percent of their test case outputs as cross-validation training data for the comparator. In this sec-tion, we explore a more realistic scenario where developers are responsible for training Smart on twenty percent of the
output from each run of the test suite, which they manually annotate, and testing on the remaining eighty percent. We include multiple releases of the same product to character-ize the performance in this longitudinal manner. Subsequent releases of the same project retain training information from previous releases, as well as incorporating the false positive or true positive results of any test case that our tool deemed to require manual inspection.
Our goal is to estimate the effort we save developers when using Smart, by defining a cost of looking (LookCost) at a test case and a cost of missing (MissCost) for each test case that should have been flagged but was not. We consider
Smarta useful investment when the cost of using it:
LookCost×(TruePos+FalsePos+Annot)
+MissCost×FalseNeg
is less than the cost of |diff| ×LookCost. Here Annot denotes the number of test cases that are manually annotated for training (20% of the total). Therefore, Smart saves effort when the cost of looking at the test cases flagged bydiffbut not by our model exceeds the cost of missing any relevant test cases we fail to report. We thus express the condition under which Smart is profitable:
LookCost MissCost>
−FalseNeg
TruePos+FalsePos+Annot− |diff|
We assume LookCost MissCost [54], so we would like this ratio to be as small as possible.
5.1 Results
Table6shows our results, as well as the number of test cases that a developer would need to examine when usingdiff as a baseline. For example, when applying our technique to the last release of HtmlTidy, if the cost of missing a poten-tially useful regression test report is less than or equal to 1000 times the cost of triaging and inspecting a test case, we save developer effort. A ratio of 0 indicates no false negatives, and thus a net win compared todiff, regardless of LookCost or MissCost.
Smart’s performance generally improves on subsequent
releases, and it totally avoids missing any faults in one instance for both HtmlTidy and Gcc-Xml. In situations where there is a large increase in the relative number of regression test errors, such as a rushed release of a product, such as the fourth release of HtmlTidy, Smart performs the worst. When the manual annotation of 20% of the training test case outputs shows a historically unreasonable number of regression test errors, a developer would not be advised to use our approach.
Previous work on bug report triage has used a LookCost to MissCost ratio of 0.023 as a metric for success for an
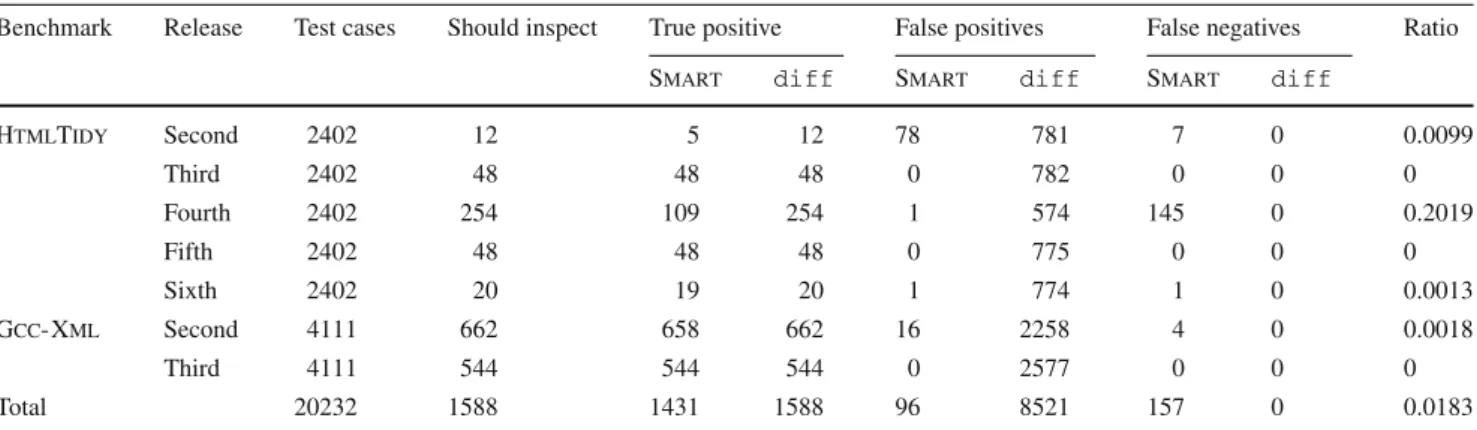
Table 6 Simulated performance of our technique on 20232 test case executions from multiple releases of two projects
Benchmark Release Test cases Should inspect True positive False positives False negatives Ratio Smart diff Smart diff Smart diff
HtmlTidy Second 2402 12 5 12 78 781 7 0 0.0099 Third 2402 48 48 48 0 782 0 0 0 Fourth 2402 254 109 254 1 574 145 0 0.2019 Fifth 2402 48 48 48 0 775 0 0 0 Sixth 2402 20 19 20 1 774 1 0 0.0013 Gcc- Xml Second 4111 662 658 662 16 2258 4 0 0.0018 Third 4111 544 544 544 0 2577 0 0 0 Total 20232 1588 1431 1588 96 8521 157 0 0.0183
The “Test cases” column gives the total number of regression tests per release. The “Should inspect” column counts the number of those tests that our manual annotation indicated should be inspected (i.e., might indicate a bug). The “Inspected” column gives the number of tests that our technique anddiffflag for inspection. The “False positives” and “False negatives” columns measure accuracy, and the “Ratio” column indicates the value of LookCost/MissCost above which our technique becomes profitable (lower values are better)
analysis that required 30 days to operate [18]. The typical performance of our technique, which includes the cost of the 20% manual annotation burden and would take 1.3 h on average per release, is 0.0183—a 20% improvement over that figure. By excluding the single HtmlTidy outlier mentioned above, our ratio improves to 0.0015, exceeding the utility of previous tools by an order of magnitude and requiring an order of magnitude less time.
6 Automating the model
The previous sections demonstrated that designing a highly precise oracle comparator that relies on surface feature values between pairs of regression test case output is a feasible and reasonable approach for reducing the cost of regression test-ing web-based applications. Our comparator, Smart, signif-icantly outperformsdiffand other baselines, and is able to successfully save developer effort. Given the resource con-straints web-based applications are developed under [35], and the perceived low return on investment in this domain [17], we believe that in order for any approach to be adopted in industry, automation is essential. The remainder of this paper explores automated approaches for oracle compara-tors for web-based applications, that do not require manual annotation of training data.
Although Sect.4.3presented results where a compara-tor customized to a benchmark application outperforms that trained on a global dataset, we believe that inherent under-lying similarities between unrelated web-based applications can be exploited to automate the oracle comparator process. 6.1 Experimental setup
To test our hypothesis that underlying similarities from unre-lated web-based applications are sufficient for training a
highly precise oracle comparator, we designed an experi-ment which relied on the same training dataset from Sect.4 (see Table2), and tested on applications not in the training set. Optionally, developers may choose to supplement the training dataset with their own annotations of data from the application-at-test, but we do not require them.
We selected four benchmarks, shown in Table7, to serve as our test data. HtmlTidy and Gcc-Xml were the only benchmarks from our previous experiments that had enough output pairs labeled as faults (given by the “Test Cases to Inspect” column) to serve as testing (as opposed to train-ing) subjects. We also relied upon two open source browser-based applications (Click and VQWiki) to supplement our test benchmarks in a “worst-case scenario” fashion: none of the training benchmarks are browser-based applications, and successful performance on them further supports our claims about inherent web-based application similarities.
VQWiki [52] is wiki server software that can be used
out-of-the-box as a browser-based application. Click [1] is a Java Enterprise Edition web-based application framework that ships with a sample browser-based application demon-strating the framework’s features. HtmlTidy and Gcc-Xml are two open-source HTML- and XML-based applications that are also a part of our training benchmarks; we therefore removed each benchmark’s respective test case outputs from the corpus of training data, so that we never tested and trained on the same data. In total we tested our model on 6728 test case pairs, 941 of which were labeled as errors by manual inspection (see Table7).
6.2 Experimental results
Figure 1 shows our model’s F1-score values for each test benchmark, as well as the baselines in Sect. 4.1.3 (see Table3). Figures2and3present the recall and precision
Table 7 The benchmarks used as test data for Experiment 1
Benchmark Versions LOC (K) Description Test cases Test cases to inspect
HtmlTidy Jul’05 Oct’05 38 W3C HTML validation 2402 25 Gcc- Xml Nov’05 Nov’07 20 XML output for GCC 4111 875 VQWiki 2.8-beta 2.8-RC1 39 wiki web application 135 34 Click 1.5-RC2 1.5-RC3 11 JEE web application 80 7
Total 108 6728 941
The “Test cases” column gives the number of regression tests used; the “Test cases to inspect” column counts those tests for which our manual inspection indicated a possible bug. When testing on HtmlTidy or Gcc-Xml, we remove it from the training set
Fig. 1 F1-score on each test benchmark (HtmlTidy, Gcc-Xml, VQWiki, Click) using our Model, and other baseline comparators. 1.0 is a perfect score: no false positives or false negatives
Fig. 2 Recall on each test benchmark (HtmlTidy, Gcc-Xml, VQWiki, Click) using our Model, and other baseline comparators
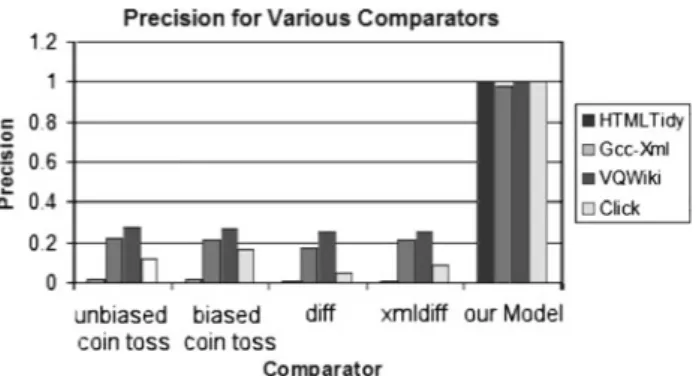
Fig. 3 Precision on each test benchmark (HtmlTidy, Gcc-Xml, VQWiki, Click) using our Model, and other baseline comparators
values, respectively, from which the F1-scores were calcu-lated. Smart is anywhere from over 2.5 to almost 50 times as good asdiffat correctly labeling test case outputs, with similar improvements overxmldiff. Both browser-based applications (Click and VQWiki) obtain perfect results, and the F1-score of 0.98 for our second largest HTML bench-mark, HtmlTidy is near optimal. Overall, relying on under-lying web-based application similarities to train an oracle comparator to test an unrelated web-based application is a successful approach. For example, an analysis of vari-ance revealed that text-only changes were strongly negatively associated with bugs across all benchmarks, and similar to the conclusions presented in Sect.4.2. By utilizing our read-ily available training data set and companion comparator, developers would be able to significantly reduce the number of false positives associated with testing web-based applica-tions while minimizing or eliminating false negatives.
While our F1-score for our XML benchmark, Gcc-Xml, was three times better than that ofdiff, its recall score of 0.84 implies that we may be missing a significant number of actual faults. Unlike our other test applications, Gcc-Xml outputs XML rather than HTML code, and may not be able to make full use of our human-emulating semantic features described in Sect.3.3, or may exhibit errors differently than in the HTML-emitting applications (we return to this notion in Sect.7.2). Instead of suggesting developers continue to use diff-like comparators, or rely on extensive manual anno-tation, we propose that they continue to apply our approach with one small modification: by extending the training data set with seeded faults obtained from automated fault injec-tion, developers can customize Smart to a specific applica-tion while still avoiding relying on manual annotaapplica-tions. We explore this concept in the following subsection.
6.3 Training data from defect seeding
Our relatively low recall value for Gcc-Xml suggests that this application-at-test exhibits errors in a way that differs from our other training benchmarks. By relying on automated defect seeding, we claim that it is possible to improve the results of our automated comparator to levels comparable with a manual approach.
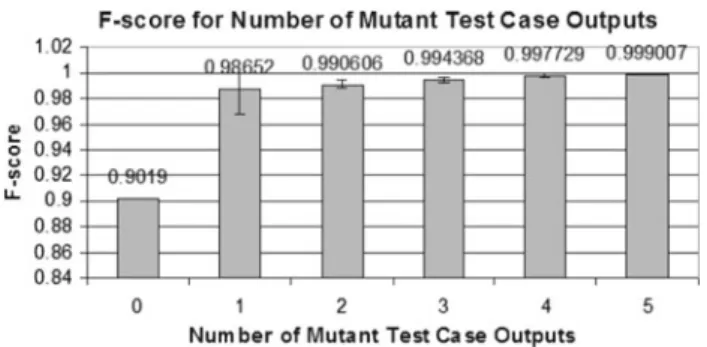
Fig. 4 F1-score for Gcc-Xml using our model with different num-bers of test case output pairs from original-mutant versions of the source code. The “0” column indicates no mutant test outputs were used as part of the training data. Each bar represents the average of 1000 random trails; error bars indicate the SD
Seeding the source code of an application with defects has been previously explored [21,23,45]. It can be assumed that any output from a fault-seeded version for a deterministic test case that differs from the expected output can be attributed to the injected fault, and thus that output pair should be added to the training data set with the label “should inspect”. While automatically generating, compiling and running mutants can be CPU-intensive, it does not require manual interven-tion. In this experiment, a subset of mutation operators from Ellims et al. [14] were injected into a single version of the source code on a single random line. Examples of mutation operators include deleting a line of code, replacing a state-ment with a return, or changing a binary operator, such as swappingANDfor OR. Each mutant version of the source code, containing a single mutation, was then re-run on the entire test suite, and all differing outputs were collected; we were able to obtain 11,000 usable erroneous output pairs within 90 min on a 3 GHz Intel Xeon computer.
Figure 4 shows our F1-scores when adding between 0 and 5 defect-seeded output pairs to the set of training data (selecting 0 mutants is provided as a baseline) over 1000 trials. Adding any single mutant is always better than using none, although the large margin of error implies that best performance is obtained when selecting the most appropri-ate mutant. After adding five mutants our F1-score of 0.999 approaches the optimal value of 1. We hypothesize that it is possible to dramatically affect Smart’s predictive power by adding a small number of mutants because for the case of Gcc-Xml, there were only 44 errors in the training data set, and adding one more to such a small number can sig-nificantly change the results. Other benchmarks may require more mutants to obtain similar levels of increased perfor-mance, although we have demonstrated that it is quite sim-ple to automatically generate these defects. We conclude that very little application-specific training data (five labeled output pairs) is needed to bring even our-worst performing benchmark up to near-optimal performance, and even such
application-specific data can be easily obtained automati-cally.
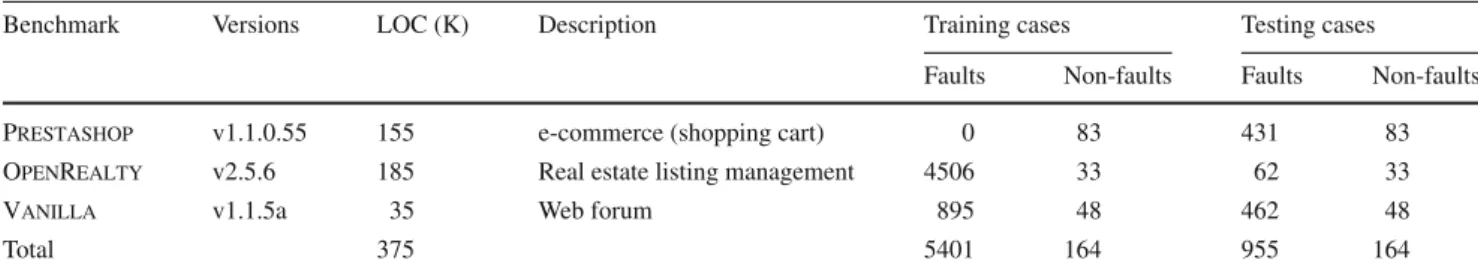
7 Case study: popular browser-based applications Sections5and6explored annotation-based and automated approaches using Smart to reduce the number of false pos-itives associated with regression testing web-based applica-tions, while minimizing or eliminating false negatives. This section presents the results of Smart’s performance on three popular, open-source PHP browser-based applications. Although Sect. 6.2evaluated our model’s performance on two browser-based applications, Click and VQWiki, our goal is to investigate Smart’s performance on additional and potentially more typical and challenging benchmarks. For this purpose we evaluated our tool’s performance on three open-source popular browser-based applications sum-marized in Table8.
Our first benchmark, Prestashop, is an e-commerce application with over 24,000 companies employing their own instances of the product worldwide [30]. Besides featuring authentication and database properties, Prestashop is inter-esting from a regression tinter-esting perspective because it makes use of a non-deterministic “featured product” which changes between runs of the application test suite. OpenRealty is an on-line real estate listing management application with over ten thousand registered members in their development forum [29]. Vanilla is a standards-compliant, multi-lingual, theme-able, pluggable discussion forum for the web with “over 300,000 businesses, brands, and fans” [50]. All three PHP applications make use of session cookies that result in additional non-deterministic output that would be flagged by a naïve comparator such asdiff.
To provide a precise analysis of Smart’s fault revealing properties for these popular browser-based applications, we used manual seeding of source code faults for each benchmark, rather than running the test suite on two different versions as in previous sections. Although this no longer pro-vides us an opportunity to ignore natural program evolutions, we chose to conduct this experiment to know with certainty whether or not the faults that we should flag are actual errors. This is in contrast to the potential faults flagged in previous sections. Furthermore, we believe that the heavy use of non-deterministic output in these benchmarks provides a chal-lenge equal to that of ignoring harmless program evolutions in our previous experiments.
7.1 Severity of missed faults
We follow the setup of Sect.6.3for this experiment; a com-parator is trained for each individual benchmark using the pre-existing training data from the benchmarks in Table2,
Table 8 Additional web-based application benchmarks
Benchmark Versions LOC (K) Description Training cases Testing cases
Faults Non-faults Faults Non-faults Prestashop v1.1.0.55 155 e-commerce (shopping cart) 0 83 431 83 OpenRealty v2.5.6 185 Real estate listing management 4506 33 62 33
Vanilla v1.1.5a 35 Web forum 895 48 462 48
Total 375 5401 164 955 164
Prestashop, OpenRealty, and Vanilla are all popular, open-source PHP applications that make heavy use of non-deterministic output. The “Training faults” test cases were obtained by automatic fault seeding (see Sect.6.3). The “Testing faults” were manually seeded. The “Non-Faults” columns represent clean runs (and may included non-deterministic data, such as “featured product” information). Ideally, all of the “Testing cases” instances should be correctly categorized by a precise comparator
as well as additional automatically injected faults obtained using the methods in Sect.6.3. Table 8indicates the num-ber of automatically injected faults used as training data for each benchmark in the “Training Faults” column. Because of the heavy reliance on non-deterministic output for these PHP benchmarks, we also supplemented the training data set with clean runs of the test suite where no faults were injected but where non-deterministic output still existed, these are labeled as “Training Non-Faults”. The training data for OpenRealty and Vanilla were augmented with such injected-fault infor-mation; for comparison, Prestashop was not. The number of training faults and non-faults used in the remaining two benchmarks were natural artifacts of the number of automat-ically injected faults that happened to be exercised by a test case, and the size of the test suite, respectively—there was no conscious effort to present any particular ratio of faults to non-fault for the training dataset. We hypothesize that it may be more difficult to reduce false positives in web-based appli-cations which make the heaviest use of non-deterministic output.
The “Testing Faults” column of Table8gives the number of manually injected faults Smart should detect. Because these are known faults, rather than potential faults as flagged by a human annotator, we expect the experiments in this section to have more false negatives. Therefore, we also seek to characterize the consumer perceived severity of cor-rectly flagged and missed faults. We claim that if the severity of missed faults is not high, using Smart under the auto-mated approach is still a useful investment to developers, even if some bugs are missed, given the resource constraints of development in this domain. Finally, the “Testing Non-Faults” column gives normal test case output that should be correctly classified—different from the training data in terms of non-deterministic output.
We follow previous work [11,12] in dividing fault sever-ity (i.e., consumer perceptions of fault importance) into four levels: severe, medium, low and very low. These severity rat-ings correspond to varying levels of human actions based
upon a fault seen; for example, severe faults occur when the user would either file a complaint or probably not return to the website. A rating of very low indicates that no fault was noticed by the consumer. The severity model used here is based on a human study. We involve fault severity because
Smartmay fail to report some defects, but not all defects
are equally important to users.
Table9presents the results of a severity analysis of the faults missed by our approach, broken down into severe and non-severe (medium, low, and very low) categories. The “Weighted Found” column refers to the percent of total faults correctly identified by Smart when assigning weights rang-ing from 1–4 for severity in increasrang-ing order. For
Prestashop, OpenRealty, and Vanilla, our technique
missed 1, 9, and 0% of the severe faults in their testing data respectively, indicating that overall the percentage of severe faults missed is extremely low. Out of 532 severe faults con-sidered, Smart missed only 7.
The last column of Table9shows the number of non-faults that were classified correctly by Smart. Using the terminol-ogy of Sect.5, this corresponds to the amount of effort saved compared todiff(i.e., the factor multiplied by LookCost). For example, for Vanilla, our approach reduces developer inspection costs by 97% without missing any severe faults. For Prestashop, our approach reduces inspection costs by 47% while missing only 1% of severe faults.
7.2 Feature analysis
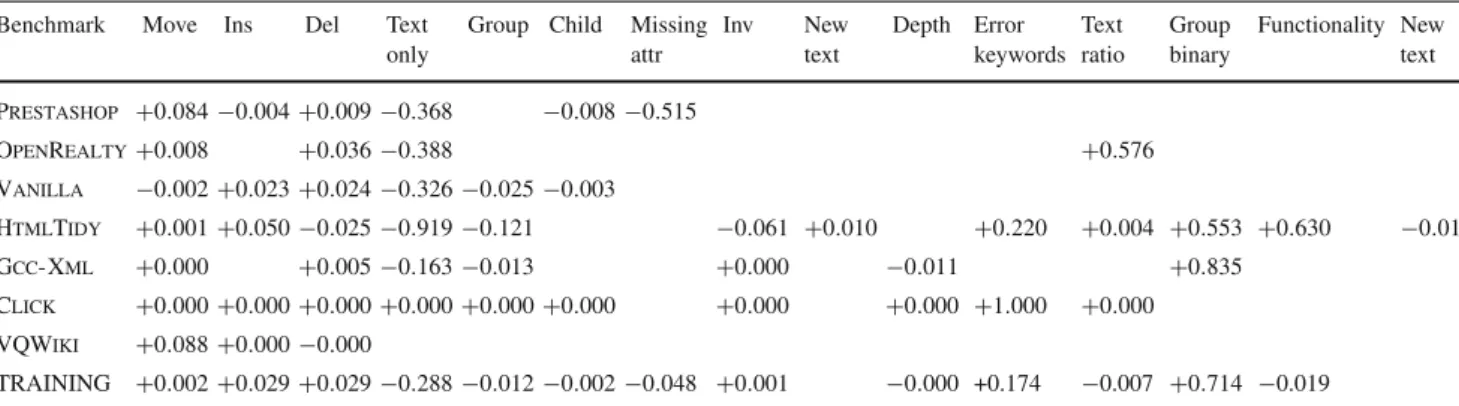
Our final experimental goal is to explicitly evaluate the hypotheses about feature associations with faults and non-faults presented in Sect.3. Table 10presents the results of analysis of variance experiments conducted on all of our test applications. Each value represents the coefficient of the fea-ture in the model—higher values are more associated with errors, for features whose p value was less than 0.05. F values are not shown, and for the training dataset, only those features are shown which overlap with at least one significant feature
Table 9 Breakdown of missed faults across our three PHP benchmarks
Benchmark Goal Miss Weighted % % Effort
Found faults saved Severe Medium Low Very low Severe Medium Low Very low
faults faults faults faults faults faults faults faults
Prestashop 302 45 57 27 3 32 17 26 98 47
OpenRealty 44 1 1 16 4 1 0 10 85 100
Vanilla 186 183 10 83 0 5 8 0 89 97
Human-perceived fault severity is emphasized, and ranges over “very low”, “low”, “medium” and “severe”
Table 10 Coefficients of feature values across all test benchmarks, plus the generic training dataset
Benchmark Move Ins Del Text Group Child Missing Inv New Depth Error Text Group Functionality New
only attr text keywords ratio binary text
Prestashop +0.084−0.004+0.009−0.368 −0.008−0.515 OpenRealty+0.008 +0.036−0.388 +0.576 Vanilla −0.002+0.023+0.024−0.326−0.025−0.003 HtmlTidy +0.001+0.050−0.025−0.919−0.121 −0.061 +0.010 +0.220 +0.004 +0.553 +0.630 −0.010 Gcc- Xml +0.000 +0.005−0.163−0.013 +0.000 −0.011 +0.835 Click +0.000+0.000+0.000+0.000+0.000+0.000 +0.000 +0.000 +1.000 +0.000 VQWiki +0.088+0.000−0.000 TRAINING +0.002+0.029+0.029−0.288−0.012−0.002−0.048 +0.001 −0.000 +0.174 −0.007 +0.714 −0.019
from one of the testing benchmarks. We now examine the results qualitatively in detail, tying in feature importance to concrete software engineering features. In this section we conduct a deeper analysis of the delete, move, text-only, and error keywords features, beginning with their signifi-cance in our representative PHP benchmarks, and extending our analysis to all test applications we have visited in our work.
7.2.1 Moves and deletes
Of all the features Smart employs, move and diffX-delete were the only two that correlated with judgments in a statistically significant manner across every test benchmark, as seen in Table10. In addition, the F -value for at least one of these features was always either the highest or second-highest feature for each specific benchmark model, indicat-ing that these features significantly affected the respective model.
Given the importance of diffX-move and diffX-delete in our models, we sought to characterize the nature of the faults they tended to predict, as they were generally indicative of faults across most benchmarks. To do so, we manually exam-ined the HTML output for test cases in our dataset which were labeled as having high diffX-move and diffX-delete values, as well as those with low move and diffX-delete values. For our three PHP browser-based applications,
high diffX-delete values indicated large chunks of expected output were missing. For example, in Vanilla an output pair with a high diffX-delete feature value typically corresponds to output in which all forum comments are gone, or in which a search returns no results. In OpenRealty, high diffX-delete values were associated with missing a large loan calcula-tor form, while in Prestashop, they indicated blank pages that contained a single error message such as “Error: install directory is missing”. Similarly, high diffX-delete values in
VQWikiand Click, our other two browser-based
applica-tions, were instances of pages not being found or missing the entire body of data. By contrast, low diffX-delete values were associated with less severe errors such as missing links, small parts of pages, or small bits of functionality such as a Javascript calendar.
Like diffX-delete, high diffX-move values were also generally associated with faults. For our three PHP bench-marks, high diffX-move scores indicated authentication fail-ures, missing entire forms, or other high severity faults with explicit error messages. For our other benchmarks, high
diffX-move values revealed the same faults as those with diffX-delete scores. Low diffX-move values were less
indicative of lower severity errors than low diffX-delete scores. For example, low diffX-move scores were found when large parts of the webpage were missing, as well as for small amounts of missing data such as parts of pages or incorrectly calculated data items.
Overall high diffX-delete and diffX-move are gener-ally indicative of severe faults in web-based applications, as they correlate with large amounts of missing data. The user-perceived severity of such faults can frequently be predicted by the size of the diffX-delete value.
7.2.2 Text-only differences
The third feature we examine in depth is when the difference between two HTML outputs can be qualified as only changes to the natural language text within the documents.
More than any other feature, text-only changes signifi-cantly impacted the negative performance of Smart in cases of false positives and false negatives when its respective F -value was high (Prestashop, OpenRealty, Vanilla,
Gcc- Xml, and HtmlTidy).
For example, text-only changes in Prestashop correlated negatively with faults, but were not helpful at reducing false positives. For Prestashop, a rotating “featured product of the day” display caused even the “clean” (non-fault) out-put pairs to include text-only changes. Text-only changes in OpenRealty and Vanilla had the opposite effect on
Smart’s performance: rather than failing to rule out false
positives, in the case of OpenRealty, text-only changes were responsible for every false negative. For example, faults such as incorrectly calculating the number of comments on a forum appears to our model as simple text-only changes. In
Vanilla, all other false negatives were due our tool
ignor-ing changed HTML attribute values, our default behavior to avoid flagging changes to image height and other non-errors. For example, in Vanilla an input field’snameattribute was mistyped. In future work, we propose to explore Smart’s performance when flagging attribute changes for HTML files as well as XML output.
7.2.3 Error keywords
Finally, we return to the issue of error keywords and their abil-ity to predict faults in web-based application output. Manual inspection of output pairs rated as severe revealed that they frequently contain error keywords. Despite this, the over-all predictive power (F -value) of this feature was generover-ally low, with the exception of Click where error keywords were able to perfectly predict actual faults. The main reason is that none of these real-world browser-based applications ever dis-played a stack trace directly, and instead wrapped their visi-ble errors in more human-friendly formats; this is in contrast to our experience with web-based application faults in gen-eral [12]. From a consumer perspective, it should be possible to design web-based applications that fail elegantly without stack traces or upsetting error messages [12] and yet still rely on a sophisticated tool such as Smart that can
neverthe-less detect such failures without relying on a search for any particular keywords in the document.
8 Experiment summary
This paper approaches the problem of providing a highly pre-cise oracle comparator for web-based application regression test output by proposing Smart, an approach that relies on surface features of web-based application output to deter-mine whether or not human should inspect test case out-put pairs. Section 4 demonstrated that such structural and semantic features can be successfully used to model web-based application output and make judgments about errors. Initially, we tested Smart in instances where manual anno-tation of test case output is required to train the classifier. On 7154 test cases from 10 projects, Smart obtains a precision of 0.9972, a recall of 0.9890, and an F1-score of 0.9931, over three times as good asdiff’s F1-score of 0.3004. Encour-aged by these very strong machine learning results, we fur-ther tested our technique in a simulated deployment involving 20232 test case executions of 6513 test cases and multiple releases of two projects. Under such circumstances humans were asked to annotate 20% of their test case output pairs to serve as training data for the classifier; the remaining 80% of the test case output was then offered for classification by our tool. In such a scenario we had 8425 fewer false positives thandiff, and we save development effort when the ratio of the cost of inspecting a test case to the cost of missing a rele-vant report is over 0.0183; numbers in that range correspond to industrial practice.
Given the extreme resource constraints under which web-based applications are developed, we extended this proof-of-concept model from Sect. 5 by replacing it with a completely automated approach. Section6 demonstrated that using test case output pairs from unrelated web-based applications to train a model to predict errors in output in the application-at-test is a viable strategy. Smart was able to achieve perfect recall and precision for our two browser-based application benchmarks, while close to perfect (0.98 and 0.99) F1-scores for our two web-based applications. To obtain such a near-perfect F1-score for Gcc-Xml, our XML-emitting benchmark application, we augmented the training data set with automatically generated outputs obtained via defect seeding. To obtain the F1-score of 0.999 for Gcc-Xml, we augment the training data with five automatically gener-ated outputs obtained via defect seeding. In all cases we out-performdiff-like comparator by a factor between 2.5 and 50 times, significantly reducing the number of false positives, and thus the human resources required, when compared to this more naive approach.
Finally, we extended our analyses to three real-world, popular, open-source PHP benchmarks to more accurately