The Online Journal on Computer Science and Information Technology (OJCSIT) Vol. (3)– No. (2)
Dominance-based rough set approach in
business intelligence
S.M Aboelnaga, H.M Abdalkader and R.Hussein
Information System Dept, Faculty of Computers and Information, Menofia University, Shebien, Egypt
Abstract- Business intelligence (BI) technologies provide historical, current, and predictive views of business operations. Data mining is the core BI. This study uses data mining techniques to analyses historical data of banking system. These techniques including K-means method, fuzzy c-means clustering method, self-organizing map and expected maximization clustering algorithm are used to choose the best clustering algorithm to segment customers into groups. Then the Dominance-Based Rough Set Approach is applied to provide a set of rules to classify customer in bank system. The induced rules can provide recommendations of behaviors that increase the risk in financial processes.
Keywords: K-means, Fuzzy c-means, self-organizing map, expected maximization, algorithm, Dominance, Rough Set, Business Intelligence, Data Mining
I. Introduction
Business Intelligence (BI) is defined as the ability for an organization to take all its capabilities and convert them into knowledge [1]. BI aims to support better business decision-making. Thus a BI system can be called a decision support system (DSS) [2]. Financial system such as private banking system is considered as a sector of BI.
Risk classification is an important part of financial processes; there are some behaviors that increase the risk of business failure. Business failure prediction is a scientific field which many academic and professional people have been working for, at least, the three last decades. The high individual and social costs encountered in corporate bankruptcies make this decision problem very important to parties such as auditors, management, government policy makers, and investors. Also, financial organization, such as banks, credit institutions, clients, etc., need these predictions for firms in which they have an interest (of any kind) [3].
Therefore, they are very much interested in establishing an “early warning system” that they can use to predict business failure and prevent bankruptcy. Many methods have been used in the past for prediction of business failure such as discriminate analysis [4], logistic regression [5], factor analysis [6], and simultaneous-equation model [7]. Later researches have used other methods such as neural networks [8], Bayesian belief networks [9], and isotonic separation [10]. These approaches are only good for crisp types of data sets and certain data values. If the values of data continuous or uncertain we must apply fuzzy theory [11]. In this study, for predicting business failure, data mining techniques are used. First some cluster methods
such as K-means method, fuzzy c-means clustering method, self-organizing map and expected maximization clustering algorithm are used to partition customer in bank system into subsets. Each subset is a cluster, such that object in a cluster are similar to one another, yet dissimilar to objects in other clusters. After applying cluster methods, it would be of interest to know which clustering method performs best in a real world case of banking system so quality assessment is used for this purpose. Second, the Dominance-based Rough Set Approach (DRSA) as a classification method is used to provide a set of rules to discriminate between healthy and failing customer in order to predict bankruptcy in bank system. DRSA, originally developed by Greco et al. [12], is a relatively new approach in data mining that is very useful for data reduction. The rough set theory a kind of natural language computation is particularly useful for dealing with imprecise or vague concepts [13]. A set of decision rules are generated by applying the rough set approach to analyze the classification data. These decision rules are in the form of logic statements of the type ‘‘if conditions, then decision”. The set of decision rules represents a preference model for the decision-maker that is expressed in a natural and understandable language. The rough set theory has been successfully applied in a variety of fields, including medical diagnosis, expert systems, business failure prediction [3], travel demand analysis [14], the insurance market [15], accident prevention [16], topology education [17], and customer behavior in airline market [18].
Although the Classical Rough Set Approach (CRSA) is a powerful tool for handling many problems, it cannot deal with inconsistencies originating from the criteria. However, the DRSA has an advantage over the CRSA in that it has access to an information table that displays comprehensive dominance relations. It is able to deal with inconsistencies where decisive classes are not consistent with their criteria. At the end of this study, CRSA is applied to show these advantages.
The aim of this study is to discuss how clustering techniques can be used to cluster customer in banking system. Then dominance rough set can be used to analyze these data and extract rules that can help in the prediction of behaviors of customer that increase the risk financial processes.
The rest of the paper is organized as follows: In Section 2 we describe a review of clustering methods, Section 3 present the basic concepts of rough set technique, Section 4 describes the case study of banking system and the experimental results.
Section 5 shows comparison between CRSA and DRSA. Finally, Section 6 concludes the paper.
II. Review of clustering methods
Four different clustering algorithms are applied in this study. The algorithms that are chosen are: K-means, fuzzy-c means, expected maximization (EM) and Self Organization Map (SOM).
1. K-means method
K-means method is a very popular approach for clustering because of its simplicity of implementation and fast execution. The formula of K-means method is as follows
, (1)
where the distance between two points Xr and Xs is given by the square root of the sum of the squared distance over each coordinate and each ci in the following equation represents the weight. If the weights are normalized then [19]. The steps of the K-means algorithm are given below:
• Select randomly k points to be seeds for the centroids of k clusters.
• Calculate distance between each point and each centroid then assign each point to the centroids closest to the point.
• After all points have been assigned, recalculate new centroids of each cluster.
• Repeat step 2 and step 3 until the centroids no longer move. 2. Fuzzy c-means method
Fuzzy c-means clustering method has been developed that a data point can belong to many clusters with different membership grades between zero and one [20] [21]. It is based on minimization of the following objective function:
(2)
where is any real number greater than 1, is the degree of membership of in the cluster , is the ith of d-dimensional measured data, is the d-dimension center of the cluster.
The steps of the Fuzzy c-means algorithm are given below:
•Initialize U= [uij] matrix, U(0)
•At k-step, calculate the centers vectors C(k)=[cj] with U(k)
•Update U (k), U (k+1)
•If <εthen STOP, otherwise return
to step 2.
3. The expectation and Maximization clustering algorithm EM is a well-established clustering algorithm in statistics community. EM is a distance based algorithm that assumes the data set can be modeled as a linear combination of multivariate normal distributions and the algorithm find the distribution parameters that maximize a model quality measure, called log likelihood [22].
4. Kohonen’s Self-Organizing Map
SOM is one of the most popular and powerful neural networks in the unsupervised learning domains [23].
Summary Steps is below: Step 0: Initialize weights .
Set learning rate parameter.
Step1: While stopping condition is a false, do step 2-8. Step 2: For each input vector x, do steps 3-5.
Step 3: For each j, compute:
) 2) (5)
Step4: Find index j such that is a minimum.
Step5: For all units j within a specified neighborhood of J, and for all i
(6) Step 6: Update learning rate.
Step7: Reduce radius of topological neighborhood at specified times.
Step 8: Testing stopping condition.
III. Basic concepts of the Dominance Rough Set Approach
The rough set theory, firstly introduced by Pawlak [24], is a valuable mathematical tool for dealing with vagueness and uncertainty [13]. For a long time, the use of the rough set approach and other data mining techniques was restricted to classification problems where the preference order of the evaluations was not considered. This is due to this method cannot handle inconsistencies that occur as a result of the violation of the dominance principle [25]. In order to deal with this kind of inconsistency, it was necessary to make a number of changes to the original rough set theory. This method is mainly based on the substitution of the indiscernibility relation for a dominance relation in the rough approximation of decision classes [13].
(3)
1. Data Table
In rough set theory, data is represented as data tables. It can expressed by a 4-tuble information system IS = (U,Q,V, f), where U is a finite set of objects, Q is a finite set of attributes . Moreover, V is a set of all attribute value such that and is the domain of the attribute q, is an information function
such that for each and . The set Q is
usually divided into set of condition attributes and set of
decision attributes .
2. Rough approximation by means of dominance relations
Let be an outranking relation to U with reference to criterion such that means that ‘‘ is at least as good as with respect to criterion ”. Let : object x dominates object y (denotation ), if x y stands for every . Now, it is possible to define sets:
,
Let be a set of classes of , which
means that each element of belongs to one and only one class. For
and we have:
Where means and not
It is possible to define a set:
Furthermore, it is possible to define P–lower and P–upper approximations of :
By analogy, for: We have:
The P-boundaries of and are defined as
We define the accuracy of approximation as
defines the quality of approximation.
4. Decision rulesThe end result of rough set theory is decision rules. In the decision rule , formula and are called condition and decision, respectively [13].the form: , where means that attribute with value I, means the decision attributes and the symbol denotes propositional.
Various algorithms have been proposed for induction of decision rules and these algorithms tend to generate a minimum set of rules with smallest number of rules. In this study, the algorithm for induction in dominance rough set regarding decision rules is obtained from [25] then LEM2 algorithm [26] is applied for CRSA and the difference between two algorithms is presented.
IV. A case study of Banking System
The purpose of this study is to identify the best clustering technique for analyzing customers in bank system and how rough set theory can be used to extract rules that show the behaviors of customers in the financial process. In order to show this purpose, we carried out an empirical study of banking system. Fig. 1 illustrates research model in this study.
1. Data Sample
According to the database which collected from data warehouse Barclays bank in the period from 30/12/2008 to 30/5/2009 as a six month, the database consists of seven measured variables as follow:
Fig.1 Schematic diagram of the proposed system
(7)
(8)
(9)
(10)
• Average Revenue; refer to average income of the customer per month. It is categorized into 12 levels by: (1) 0-1000 (2) 1001-2000 (3) 2001-3000 (4) 3001-4000 (5) 4001-5000 (6)5001-6000 (7)6001-7000 (8)7001-8000 (9)8001-9000 (10)9001-10000 (11) 10001-20000 (12) 20001-25000
• Internal Transfer means the local transactions between customer accounts or between two customers’ accounts in the six months. It is categorized into 6 levels by: (1) 0-5 (2) 6-10 (3) 11-15 (4) 16-20 (5) 21-25 (6)26-30
• Foreign Transfer means international transactions in the six months. It is categorized into 6 levels by:
(1) 0-5 (2) 6-10 (3) 11-15 (4) 16-20 (5) 21-25 (6)26-30
• Loan Count a, no of loans in the six months.
• Loan Over Due, means the unpaid installments of the loan in the six months.
• Guarantees, means the loan guarantees.
• CC_Over Due, means credit card unpaid installments. It is categorized into 5 levels by: (1) 0-5 (2) 6-10 (3) 11-15 (4) 16-20 (5) 21-25
2. Ideal number of clusters
To determine the best number of clusters in this study, SOMs recommended by [27] are used. By using SOM clustering techniques, we found3 clusters is the best number of clusters. 3. Quality Assessment
Since each clustering technique has its own strengths, it would be of interest to know which clustering technique is more suitable for this case study. One method that determines cluster quality assessment suggested by [28] is performed.
4. Results from clustering techniques
The following analyses describe the clustering results using four different clustering techniques.
Table 1 shows the three clusters generated by K-means, fuzzy c-means, EM and SOM. It includes information about the number of samples for each cluster.
Table1: Brief summary of number of objects in three clusters by four different methods K-means Fuzzy c-means EM SOM Number of cluster 1 60 219 174 608 2 609 76 616 208 3 201 575 80 54
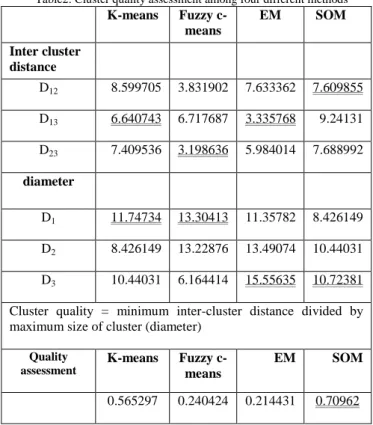
Table 2 shows the quality assessment of four clustering methods.
Table2: Cluster quality assessment among four different methods
K-means Fuzzy c-means EM SOM Inter cluster distance D12 8.599705 3.831902 7.633362 7.609855 D13 6.640743 6.717687 3.335768 9.24131 D23 7.409536 3.198636 5.984014 7.688992 diameter D1 11.74734 13.30413 11.35782 8.426149 D2 8.426149 13.22876 13.49074 10.44031 D3 10.44031 6.164414 15.55635 10.72381
Cluster quality = minimum inter-cluster distance divided by maximum size of cluster (diameter)
Quality assessment K-means Fuzzy c-means EM SOM 0.565297 0.240424 0.214431 0.70962
The cluster quality assessment in Table 2 shows SOM clustering algorithm is far better than the other methods because of its largest value in inter-cluster distance divided by the size of the cluster.
Now, DRSA is performed in the clustered banking data with cluster1 for risk customer, cluster2 for uncertain customer and cluster3 for normal customer.
5. Information table for customer in banking system
After applying the best cluster algorithm, appropriate data table is found with condition and decision attributes. The data table can be shown in relation to the function of nominal values of considered attributes with its preferences in table3.
Table3: Specification of attributes related to customers
Attributes Nominal Values Preference AverageRevenue 1,2,3,4,5,6,7, 8,9,10,11,12 Gain InternalTransfer 1,2,3,4,5,6 Cost ForeignTransfer 1,2,3,4,5,6 Cost LoanCount 0,1,2,3,4 Cost LoanOverDue 0,1,2,3,4,5,6 Cost Guarantees 1,2,3,4,56,7, 8,9,10 Gain Conditional Attributes CC_OverDue 1,2,3,4,5 Cost Decision Attributes CustClass 1,2,3 Gain
6. Results of the DRSA analysis
The results of the DRSA analysis consisted of two parts: quality of approximation and rule generation.
1. Quality of approximation
The accuracy of approximation for three decision classes is shown in table4.
Table4: Accuracy of classification At most 1 At most 2 At least 2 At least 3 Lower approx. 608 806 262 40 Upper approx. 608 830 262 64 Boundary 0 24 0 24 Accuracy 1 0.971 1 0.625
The results indicate good accuracy for the different class. In general, high values for the quality of classification and accuracy mean that the attributes / criteria selected are an approximation of the classification. The "At most 1" class is the "risk in bankruptcy". There are 608 objects belonging to that class. The accuracy of approximation for "At most 1" is one. The "At most 2" class includes the "uncertain in bankruptcy" classes, for which accuracy reaches 0.971.The accuracy of "At least 2" class is one. The "At least 3" class refers to "normal in bankruptcy", and its lower and upper approximation are 40 and 64 respectively. The accuracy of "At least 3" class is 0.625. The overall quality of approximation is calculated as follows (870-24)/870 = 0.972.
2. Rule generation
We establish a set of rules, the "minimum cover rules" (i.e., where the set does not contain any redundant rules), and these rules are certain, such that there are a total of 10 rules generated from the data. The following table shows the minimum cover rules obtained.
Table5: Minimum cover rules generated in DRSA from bank data set
ID Conditions Decision Strength
1 (Guarantees <= 4) & (AverageRevenue <= 6) CustClass <= 1 608 2 (AverageRevenue <= 5) CustClass <= 2 788 3 (LoanOverDue >= 4) & (CC_OverDue >= 2) CustClass <= 2 8 4 (LoanCount >= 3) & (LoanOverDue >= 3) CustClass <= 2 3 5 (AverageRevenue <= 6) & (ForeignTransfer >= 2) CustClass <= 2 117 6 (AverageRevenue >=8) CustClass >= 3 36 7 (AverageRevenue >= 6) & (InternalTransfer < = 1) & (Guarantees >=3) CustClass >= 3 6 8 (AverageRevenue >= 7) & (LoanCount <= 0) CustClass >= 3 20 9 (Guarantees >= 5) CustClass >= 2 241
For customers (rule 1), their decisions are at most 1 when AverageRevenue is at most 6 and Guarantees is at most 4. This rule represents 69% of customers. Rule2 with strength 788 suggests that the customer decision will at most 2 when AverageRevenue less than or equal to 5 (low value). This means that nearly 90% of customers will consider in class at most 2 if AverageRevenue has small values. From rule4, we can see that if LoanCount is at least 3 and LoanOverDue is at least 3 then their decision will be at most 2. This indicates that if the values of LoanCount and LoanOverDue have been increased than 3 the customer will not be in normal case. From rule 6 if AverageRevenue is at least 8 then the decision will be at least 3 (normal customer). In rule8, if AverageRevenue is at least 7 and the customer has no LoanCount then the customer will be in normal case. Rule9 cover 27% of customers and this rule indicates that if Guarantees is at least 5 (high value) then customer will not be considered in risk case. Rule10 shows that if AverageRevenue is at least 7 then the customer will be in safety.
V. Comparison with classical Rough set To make comparison, LEM2 algorithm that generates minimum cover rules in the classical rough set is applied to show the difference between DRSA and CRSA. After applying the algorithm, there are a total of 48 rules (table 6 -an inst-ance of generated rules) generate from the data of customers, with 9 rules corresponding to class 1, 28 rules to class 2 and 11 rules to class 3, and from the previous results of DRSA there are only a total of 10 rules generated from information system. The first advantage of DRSA over CRSA is that the criterion rel. value of decision rules resulting from
DRSA use , while those resulting from CRSA
use DRSA syntax is more understandable and makes the representation of knowledge more synthetic, since number of minimal sets of decision rules are smaller than number of minimal sets of decision rules resulting from CRSA .
Table6: Minimum cover rules generated in CRSA from bank data set
ID Conditions Decision Strength
1 (AverageRevenue = 1) & (Guarantees = 1) CustClass = 1 348 2 (AverageRevenue = 2) & (Guarantees = 1) CustClass = 1 151 3 (Guarantees = 3) & (CC_OverDue = 1) CustClass = 1 3 4 (AverageRevenue = 1) & (Guarantees = 1) CustClass = 1 348 5 (AverageRevenue = 2) & (Guarantees = 1) CustClass = 1 151
These attributes are benefit or cost in nature, so the second advantage of DRSA is that Classical rough set is not able to
discover inconsistencies that result from the preference order in domains of attributes and in the set of classes.
An example of this problem in the bank dataset:
AverageRevenue=6AND LoanCount =1 AND LoanOverDue =2 => CustClass =2 AverageRevenue =6AND LoanCount =2 AND LoanOverDue=2 => CustClass =3
The higher value of AverageRevenue, the better his class and the lower value of LoanCount and LoanOverDue, the better his class. In the previous two rules the values of AverageRevenue and LoanOverDue are similar but value of LoanCount in the first rule is lower than the value in the second rule but the decision class of second rule is better than the decision class of the first rule.
The final step of the comparison is to check the feasibility of the decision rules generated in this study through 10-fold cross validation technique. First 90% of the data are chosen randomly and from it decision rules are generated. The remaining 10% of the data are used to validate the hit rate of the generated decision rules—i.e., the percentage of correct predictions for each class. This procedure is repeated 10 times; the hit rate is shown in Table 7.
Table7: Hit rates for DRSA and CRSA analysis
Class1 Class2 Class3
Class1 608 (603) 0 (4) 0 (0)
Class2 0(0) 207 (194) 1 (2)
Class3 0(0) 15 (4) 37 (45)
Correct decision classification error Correct hit rate
852 (842) 0.01992 (0.0217) 98.03% (96.78%)
As shown in Table 7, the overall classification error is only 1.9% with 852 objects decided correctly. The effectiveness of the DRSA is shown by the results of CRSA in Table 7.Clearly the DRSA shows better prediction ability than does CRSA .The hit rate has increased from 96.78% with CRSA to 98.03% for DRSA.
VI. Conclusion
This study proposed procedure which apply clustering techniques in grouping banking system’s customers and select the best one. Classification techniques are used to extract decisions rules that discriminate between healthy and failing customers in order to predict bankruptcy in bank system.
This study applies four clustering techniques to portion the customers in the bank system. These approaches are K-means method, fuzzy c-means method, EM method and SOM method. Three clusters are formed for each cluster method. Then cluster quality assessment is performed. The results show that SOM is the best among the four methods.
After SOM method is used for dividing customer into clusters (normal, uncertain and risk), the information table that consists of conditions and decisions attributes is found and DRSA approach can be applied. This study illustrates the usefulness of the DRSA approach for the prediction of the behavior that causes bankruptcy of customer in bank system. The proposed prediction model generates decision rules. The DRSA is the extension of CRSA to deal with
inconsistences that result from preference order in criteria. This is done by replacing the indiscernibility relation with the dominance relation. Compared with CRSA, the results indicate that the DRSA has better prediction ability. Moreover, the derived decision rules are in natural language form, which makes their meaning easier to understand than with traditional methods.
REFERENCES
[1]N.J Hoboken: Wiley & Sons,” Business Intelligence Success Factors: Tools for Aligning Your Business in the Global Economy”, Rud, Olivia (2009).
[2] A b D. J. Power,”"A Brief History of Decision Support Systems, version 4.0", DSSResources.COM, 2007. [3] B. Ruzgar, N.Selver Ruzgar, “Rough set and logistic
regression analysis for loan payment”,
INTERNATIONAL JOURNAL OF MATHEMATICAL MODELS AND METHODS IN APPLIED
SCIENCES,2008
[4]P. S Sinha Atish, Ge Wei, Zhao Huimin, “Effectsof feature construction on classification performance: An empirical study in bank failure prediction”, Expert System with Applications: An International Journal, Volume 36 Issue 2, March, 2009
[5] J.B. Thomson, “Predicting bank failures in the 1980s,” Economic Review,” Q: I, pp. 9-20, 1991.
[6] Rabindra Joshi, “Analyzing Perceived Causes of business failure: A factor Analytic Approach”, PYC Nepal Journal of Management, August 2010, Vol. III, No. 1
[7] A. Demirgue-Kent, “Modeling large commercial bank failures: Asimultaneous equation analysis,” Working paper 8905, Federal Reserve Bank of Cleveland, OH, 1989.
[8] P. Swicegood, and J. A. Clark, “Off-site monitoring systems for predicting bank underperformance: A comparison of neural networks, discriminate analysis, and professional human judgment,” Int J of Intelligence Syss in Acc, Finance & Management, vol. 10,no. 3, pp. 169-186, 2001.
[9] P.Shenoy Prakash, Lili Sun,” Using Bayesian Networks for Bankruptcy Prediction: Some Methodological Issues”, Appeared in: European Journal of Operational Research, 180(2), 2007, 738--753.
[10] Y.U Ryu, and W. T. Yue, “Firm bankruptcy prediction: Experimental comparison of isotonic separation and other classification approaches,” IEEE Trans. On Sys, Man, and Cybernetics, Part A, vol. 35, no: 5, pp. 727-737, 2005.
[11] R.Intaramo, A.Pongpullponsak, “Development of Fuzzy Extreme Value Theory Control Charts Using -cuts for Shewed”, Applied Mathematical Sciences, Vol. 6, 2012, no. 117, 5811– 5834
[12] J.Hang and Kamber M., Data Mining : Concepts and Techniques, Morgan Kaufmann, 2011
[13] S. Greco, B. Matarazzo, R. Slowinski, Extension of the rough set approach to multicriteria decision support, INFOR 38 (2000) 161–195.
[14] C.Goh, R. Law, Incorporating the rough sets theory into travel demand analysis, Tourism Management 24 (2003) 511–517. [15] J.Y. Shyng, F.K. Wang, G.H. Tzeng, K.S. Wu, Rough set theory
in analyzing the attributes of combination values for the insurance market, Expert Systems with Applications 32 (2007) 56–64.
[16] J.C. Wong, Y.S. Chung, Rough set approach for accident chains exploration, Accident Analysis and Prevention 39 (2007) 629– 637.
[17] S.Narli * and Z. Ahmet Ozelik2, “Data mining in topology education: Rough set data analysis”, International Journal of the Physical Sciences Vol. 5(9), pp. 1428-1437, 18 August, 2010. [18] J.H. James Liou, Gwo-Hshiung, “A dominance-based approach
to customer behavior in the airline market”, Information Sciences 180 (2010) 2230–2238
[19]S.E. Buttrey, & C.Karo, “Using K-nearest-neighbor
classification in the leaves of a tree. Computational Statistics and Data Analysis”, 40, (2002) 27–37.
[20] S.Nascimento, B.Mirkin & Moura-Pires, F. “A fuzzy clustering model of data and fuzzy c-means”, In the 9th IEEE international conference on fuzzy systems: Soft computing in the information age (pp. 302–307), 2000.
[21] T. Velmurugan, Performance Evaluation of K-Means and Fuzzy C-Means Clustering Algorithms for Statistical Distributions of Input Data Points, European Journal of Scientific Research, ISSN 1450-216X Vol.46 No.3 (2010), pp.320-330.
[22] O. Abu Abbas, “Comparisons Between Data Clustering Algorithms”, The International Arab Journal Information Technology, Vol.5, No.3, July 2008.
[23] Teuvo, Kohonen, Self-Organizing Maps, Springer Series in Information Sciences, Vol. 30, Springer, Berlin, Heidelberg, New York, 2001, 3rd edition.
[24] Z.Pawlak, Rough sets, International Journal of Computer and Information Science 11 (1982) 341–356.
[25] S. Greco, B. Matarazzo, R. Slowinski, J. Stefanowski, An algorithm for induction of decision rules consistent with dominance principle, in: W. Ziarko, Y. Yao (Eds.), Rough Sets and Current Trends in Computing, LNAI 2005, Springer-Verlag, Berlin, 2001, pp. 304–313.
[26] JW LERS Grzymaa-Busse– a system for learning from
examples based on rough sets. In: Słowiński R (Ed.), Intelligent Decision Support: Handbook of Applications and Advances of the Rough Sets Theory. Kluwer Academic Publishers, Dordrecht, 3-18, 1992
[27] R.J. kuo, Ho, L. M., & Hu, C. M. Integration of self-organizing feature map and K-means algorithm for market segmentation. Computers & Operations Research, 29(11), (2002) 1475–1493 [28] S. Chang Huang, En-Chi Chang, H.Hung, “A case study of
applying data mining techniques in an outfitter’s customer value analysis”, Expert Systems with Applications 36 (2009) 5909– 5915.