Using Software Visualisation
to Enhance Online Component Markets
Stuart Marshall, Robert Biddle & James Noble
{
stuart, robert, kjx
}
@mcs.vuw.ac.nz
School of Mathematical and Computing Sciences Victoria University of Wellington
New Zealand
Abstract
Online component markets can be costly for con-sumers to use, in terms of the time and effort spent understanding the components on offer. This cost of understanding will deter consumers from reusing the available components. Software visualisations derived from the components’ run-time behaviour can lessen the cost of understanding. We have developed a pro-totype tool called Spider for providing this function-ality to producers and consumers. We discuss some of the issues involved, along with our experiences in implementing the prototype.
1 Introduction
Online component markets are a mechanism for con-sumers to reuse existing components rather than de-veloping functionality from scratch (Ravichandran & Rothenberger 2003). They also provide a revenue-stream and incentive for the production of quality reusable components. For this mechanism to be suc-cessful, it must be cheaper to reuse components than it is to replicate them. The cost of reuse for the consumer involves firstly finding a set of candidate components; secondly evaluating the candidate com-ponents; and thirdly plugging the most appropriate component into its new context. Component mar-kets attempt to reduce the costs for producers and consumers, but the approaches used to achieve this still have some limitations, and the costs can still be sufficiently high to deter consumers.
1.1 The Component Reuse Industry
There is significant work being conducted into re-ducing the cost of software development. One ap-proach is to encourage the reuse of existing artifacts, such as code components, so as to avoid the cost of re-designing, re-implementing, and re-testing exist-ing functionality. To this end, online markets have been developed that bring together consumers and producers of reusable components. One example of such a market is JCorporate(JCorporate 2003). Con-sumers benefit by having a central repository that they can refer to when they need to find functionality to implement a requirement in a new system. Pro-ducers benefit by having a centralised audience for their sales pitch, whether the intention is to create revenue by charging a license fee, or to solely build Copyright c2004, Australian Computer Society, Inc. This pa-per appeared at The Australasian Symposium on Information Visualisation, Christchurch, 2004. Conferences in Research and Practice in Information Technology, Vol. 35. Neville Churcher and Clare Churcher, Eds. Reproduction for academic, not-for profit purposes permitted provided this text is included.
a user-base. Accessing the market online via a stan-dard web-browser means that consumers and produc-ers are not locked out of the industry based on their individual system configurations.
1.2 Motivation for Reuse
The motivation for the consumer to reuse is that they can save time, effort and money if the costs of reuse are less than the costs of replication. For the consumer, the savings made by reusing rather than replicating can extend beyond the initial analy-sis/design/implement & test phases of software devel-opment, and into the expensive and extensive main-tenance phases. The motivation for the producer to create reusable components is that the same compo-nent can be distributed to a multitude of consumers, all of whom maybe working in one or more related problem domains. For both the consumer and the producer, the ease of reuse for the consumer has a significant effect on cost, and in turn whether posi-tive results will be gained.
1.3 Costs of Reuse
The ease of reuse is affected by a number of costs. Firstly, producers must create reusable compo-nents. This cost includes analysis and design of prob-lem domains to extract common functionality, as well as the points at which this common functionality should be extendible. This cost then includes im-plementing and testing the code that performs this functionality. Finally, this cost also includes adver-tising the component to a consumer base, through the creation of material to be used by consumers in making an adoption decision; as well as also hosting the component for consumers to find.
Secondly, consumers must search for components applicable to their situation in a potentially huge search-space. ComponentSource (ComponentSource 2003) is a popular online component market and has over 9,000 components to browse through, across a wide range of problem domains. This can be costly in time alone, irrespective of whether services to sup-port this are charged for.
Thirdly, once consumers have identified a small set of components worth further study with respect to ap-plicability, they must evaluate each component. This evaluation involves gaining a better understanding of each component’s behaviour, and potential for exten-sion or modification. This requires time and effort be spent in program comprehension. There is also a cost associated with trusting a component, and de-termining not only whether the candidate component matches the required functionality, but also whether it poses a security risk in a trusted environment.
Fourthly, consumers then need to deploy the cho-sen component in their own environment. This po-tentially includes paying a license fee for usage rights, and definitely includes paying a cost in the time and effort needed to download, install, and configure the component to fit its new context. It also includes fur-ther testing to ensure that the component does not conflict with other parts of the system it is being de-ployed in.
1.4 Consumer Support
Component markets already attempt to reduce some of the costs that consumers face.
Markets can categorise components by field, lan-guage, and function. Markets also provide search en-gines that allow a consumer to narrow down a set of candidate components through supplying some gen-eral keywords. Markets also publish newsletters that highlight new and popular components as they arrive. Consumers have access to material that can help them understand a component’s behaviour. This doc-umentation can include a producer’s text-based de-scriptions of form and function, as well as reviews written by market reviewers, and by fellow consumers who have previously evaluated or used that compo-nent. In this respect, the support given to consumers is similar to that given in other online markets, such as Amazon’s media publishing market(Amazon 2003). Another service supplied to consumers by both the market and the producers is the ability to download evaluation versions of components, to be tested by the consumer in their own environment.
Consumers may be given some guarantees by the market that their selected component has been tested to ensure that it installs and un-installs correctly.
With respect to producer costs, the cost of adver-tising to a consumer base is partly alleviated by hav-ing a central point to which consumers come. As well as this several markets perform independent testing of components. This independent testing can further improve consumer confidence in component quality, which may in turn improve a producer’s prospects of a sale. The published newsletters also benefit produc-ers, especially those with an established reputation for excellence.
1.5 Limitations of Support
While component markets already help consumers understand component behaviour, there are limita-tions in how this support is provided, especially with regards to consumers understanding components’ be-haviour. Firstly the associated documentation is overwhelmingly text-based. Secondly the compo-nents’ evaluation versions require downloading, in-stallation, configuration and experimentation on the consumer’s own system.
Text Documentation It can be an arduous un-dertaking to comprehend large quantities of text as-sociated with multiple (similar) components. A com-ponent’s text documentation may be annotated with visual depictions of the component’s user interface should one exist, but there are few (if any) diagrams describing structure or behaviour.
Client-side Evaluations By requiring that the consumer evaluate the component on their own sys-tem, markets require that the consumer expend the effort to download, install and correctly configure the component. This is a non-trivial task. The consumer
must trust that the evaluation version will not com-promise the security of their system. The consumer is downloading the component to gain an understand-ing of its use. Therefor the consumer is unlikely to be in a position prior to installation to be confident that the component does not pose a security risk.
2 Visualising Reusable Components
Software visualisations can help consumers evaluate a candidate component by giving them an insight into the existing behaviour as well as possible means of ex-tending that behaviour. Software visualisations com-plement other existing documentation. Visualisations can summarise a sequence of events that results from a sequence of actions on the component’s public in-terface. An action on the component’s public inter-face can be understood as an invocation of a method, which will be the standard means of tying a com-ponent into the rest of the consumer’s new context. This sequence of events can then help a consumer understand the result and side-effects of using a com-ponent in a particular way. This in turn can then be compared against the required results and acceptable side-effects of the consumer’s new context.
2.1 Knowing What To Visualise
A key aspect to a successful visualisation is that useful information is not obscured by unnecessary data. It is relevant to consider the intended audience for these visualisations, and what they intend to learn from viewing them.
Audience Intent The visualisation audience are the consumers. The consumers wish to firstly under-stand the current behaviour of the component, and secondly how that behaviour can be (easily) modi-fied. With respect to the former this could include resource usage by the component; security permis-sions requested by the component (such as file or net-work access); or other libraries used. With respect to the latter, it may also be relevant to understand what behaviour is invoked on (or because of) configurable elements within the component.
Test Driving Our mechanism for identifying use-ful information is based upon allowing the consumer or producer to specify which sequence of actions is visualised. We call thistest driving. This means that there is a high likelihood that the resulting sequence of events will represent a useful goal achievable with the component. The producer is in a position to know which sequence of actions (i.e. calls to public meth-ods) results in a particular task being performed, and can tailor the visualisation to show this specific goal being achieved. Consumers may have an interest in seeing what task is performed with a given action sequence, allowing them to explore the potential us-age of the component. This removes the necessity to visualise all possible sequences of actions upon a component’s public interface. With any reasonably complex public interface, the number of possible quences would be practically infinite, with many se-quences not representing a meaningful (or achievable) goal.
3 Spider
This paper introduces Spider, a prototype tool to provide software visualisations of a component’s
be-Client Browser
Web Server / Session Manager
Test Driver HTML/CSS VM Monitor GeneratorRCD RCD Files XTE Files XTE Generator
Figure 1: The Spider architecture works on a client/server model. The architecture on the server-side includes a test drive environment, a monitor that captures interesting events, and listeners that generate documentation for use in software visualisations.
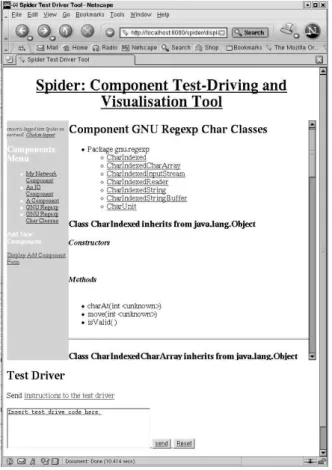
Figure 2: An early version of the Spider prototype. Spider uses HTML and CSS to display a component repository, and to display information relating to spe-cific components. The left hand column contains a list of components currently available on the server. The top right hand side of the page shows the top of the listing for the GNU Regexp Char Classes com-ponent. Spider currently uses an HTML form in the lower half of the browser screen as the input device for test driver instructions.
haviour. The software visualisations are aimed at il-lustrating a particular task that the component can perform, and identifying places where the compo-nent’s behaviour can be extended. Spider is acces-sible through a standard web browser. The informa-tion to be visualised is generated on the server-side, along with the visualisations themselves. This will save time and effort that a consumer might otherwise need to spend installing and configuring custom tools for this functionality. Spider is oriented towards visu-alising Java components, and uses debugger and XML technologies to capture and store interesting events.
3.1 Architecture
Spider follows a client-server model, with the client and server communicating via the web. On the client-side, Spider consists of a W3C standards-compliant web browser. On the server-side, Spider consists of a web server, a test driver system, an information extraction system, and a documentation generation system. The architecture is shown in figure 1.
Client/Server Web Model Spider’s communica-tion model is based on a web server capable of han-dling servlet and JSP extensions. All user requests are entirely processed on the server-side, with results sent back to the client as SGML/XML-based documents. The test driver interface visible at the client is imple-mented in HTML/CSS. The software visualisations are initially intended to be in the W3C’s Scalable Vector Graphics (SVG) format(Consortium 2003). It is assumed that multiple clients will request services concurrently. It is also assumed that a request from a client may build on previous requests from that same client, and that it is necessary to store state between these requests. To this end we utilise the session man-agement capabilities within our web server.
Test Driver An instance of the test driver subsys-tem contains an executing virtual machine (VM). The test drives written by the consumer are translated
into method calls on particular objects in that vir-tual machine, using other existing objects or literal values as parameters. These method calls are then invoked on the target object. There is the possibil-ity for test drives from different consumers to conflict (such as through non-synchronised operations, static variables, or loading particular versions of classes). Therefore there needs to be a single independent test driver instance per consumer. These instances are controlled by the session manager. The session man-ager is responsible for identifying who a particular test drive request comes from.
VM Monitor Associated with every instance of the test driver subsystem is an instance of the VM monitoring subsystem. The VM monitoring subsys-tem provides the service of detecting and filtering run-time events. The VM monitor will automatically ig-nore any execution within the test driver framework itself, and will focus only on what is being test driven. The subsystem then forwards on interesting events to listeners. These listeners are responsible for generat-ing persistent documentation of these events, that in turn will be used to generate software visualisations.
Document Generation Reusable Component De-scription (RCD) documents represent static compo-nent information, of which there will only be one file per component. XML Trace Executions (XTE) docu-ments represent component behaviour, of which there will be one file per test drive.
RCD Document Generator An RCD document describes a component’s static structure and API. RCD documents are generated when a component is listed with the tool. Generation is performed by analysing the content of the associated.classandjar
files.
XTE Document Generator An XTE document describes the dynamic runtime behaviour of a com-ponent. A single XTE document is created for each test drive performed by the client. XTE documents are generated by listeners attached to a VM monitor. The listeners are responsible for extracting useful in-formation from the events sent by the VM monitor, such as the method name that has been invoked, the object reference of the caller and callee, and the val-ues and references of the parameters. We now list the information extracted from different types of events:
• Method Calls: caller reference, callee reference, type name, method name, parameter names, pa-rameter types, papa-rameter values, thread refer-ence.
• Method Returns: caller reference, return value, type name, method name, parameter names, pa-rameter types, papa-rameter values, thread refer-ence.
• Field Accesses: container reference, field name, value, thread reference.
• Field Modifications: container reference, field name, old value, new value, thread reference.
• Exception Throws: location, description, thread reference.
• Exception Catches: location, description, thread reference.
• Object Creation: object reference, type name, pa-rameter names, papa-rameter types, papa-rameter val-ues, thread reference.
• Security Permission Request: location, details, permission.
3.2 Usage
Clients access Spider through a W3C standards-compliant web browser. The web browser presents a simple repository view of known components to the client. The client then submits test drive requests. Results from the test drives are then transmitted to the client, in a combination of HTML and software visualisations. A screenshot of the prototype is shown in figure 2.
Repository View The repository view acts a sur-rogate for a full component market. The client needs to be able to view information about the compo-nents currently available on the server. The client may also need to add a new component to the server. The repository view on the client’s browser initially lists some meta information for available components, such as name, producer, version, and date of sub-mission. When a particular component is selected, the RCD file for that component is used to create an HTML/CSS document that describes its methods, fields, and lists any associate XTE files. The resulting static documentation is similar to Javadoc documen-tation. This information can then be used to decide on the methods and arguments to invoke in a test drive.
The client may also wish to register a new com-ponent with the server. This is done by entering the component’s meta information into an HTML form, along with URLs pointing to the component’s.class
or jar files. The form is then submitted, triggering the analysis of the content specified by the URLs, the creation of a RCD file, and the updating of the repos-itory view to display this new entry.
Test Driving Test driving is performed through an HTML form. The client enters the sequence of actions with the same syntax as normal Java code. The test drive is specified as a sequence of construc-tor or method invocations on the component that is currently being investigated in the repository view. Objects created at one stage in the test drive can be associated with variable names, and reused in later stages of the test drive. Objects may also be car-ried across to future test drives, and are displayed by name on the browser interface for the duration of the session.
Test Drive Comprehension Once the form is submitted, the server will pass the request on to the test driver associated with this session. The test driver will perform the test drive, and produce an HTML document that describes the result of each action in the sequence. This action result is the re-turn value of the method, or empty if the method has a void return value. The HTML document will also describe whether there were any syntactical er-rors in the sequence, and whether any exceptions were thrown during execution of the test drive.
Once a test drive is complete, an XTE file docu-menting runtime behaviour will be created and asso-ciated with the component. A reference to this docu-ment will be included in an updated repository view for that component.
When a reference to an XTE document is selected in the repository view, the list of available (previ-ously registered) visualisation types will be presented. When a visualisation type is selected, the server will use a previously created transformation to convert the XTE file to a visualisation format. A specific transfor-mation will convert a trace into a specific type of visu-alisation, such as sequence diagram, class diagram or data structure diagram. This visualisation will then be viewable through the browser.
3.3 Technologies
Spider uses a range of Java and W3C technologies. We now discuss the technologies used for handling requests, executing components, capturing informa-tion, and storing traces.
Web Server Spider uses Jakarta Tomcat to handle servlets and JSP pages. The current implementation uses JSP tag libraries to handle much of the user in-terface generation. These tag libraries are associated with HTML files stored in Spider’s Tomcat applica-tion directory.
When test drives are submitted from the client-side, the test driver is notified. The test driver is a servlet, that then uses custom libraries portable across all Java environments.
Reflection Spider uses the Java Reflection API to handle dynamic execution of methods in a Java com-ponent’s interface. The Reflection API is available in the standard development kit, and supports handling constructors and methods as objects. Test drives are effectively mapped to a sequence of operations on these constructor and method objects, such as instan-tiation or invocation calls. The necessary parameter information is retrieved from a data store that is kept during a session of test driving. This helps to avoid the need for inserting wrapper code into a test drive so as to make it a stand-alone application capable of independent execution.
JDI Spider uses the Java Debugger Interface (JDI) (Sun Microsystems 2003). The JDI supports moni-toring a target VM from a separate monimoni-toring VM. Code executing on the monitoring VM registers its in-terest in a range of events that may occur on the tar-get VM, identified by event type or on a class/location basis. The monitoring VM is then alerted whenever a registered event occurs, temporarily suspending ex-ecution on the target VM. Code on the monitoring VM can then use methods and objects in the JDI to extract runtime information regarding call stacks, threads, mirrored values and object references, and environment state from the target VM.
The JDI is implemented in Java, as compared to earlier versions which relied on native code such as C/C++(Marshall, Biddle & Tempero 1999). This helps make Spider more portable to other servers run-ning other architectures.
XML Spider writes component descriptions and ex-ecution traces in XML formats. By storing the infor-mation in XML formats, the execution traces are ap-plication independent, and can also be converted into a range of other formats using such technologies as XML Style Language Transformations (XSLT). The initial intention of Spider is that the visualisations will be created in the SVG format. These files could then be transmitted to the clients, for display in SVG browser plug-ins.
Component documentation is split into RCD and XTE files to avoid redundancy. As behaviour infor-mation may refer to static component inforinfor-mation, that duplicated static information is factored out of the multiple XTE files that refer to the same compo-nent.
4 Discussion
The Spider prototype demonstrates how test driven software visualisations might be incorporated in an online component market. We now discuss some im-plementation issues that surfaced during our proto-typing, and the means by which Spider helps con-sumers and producers of reusable components.
4.1 Technology Issues
There are a number of issues that arose during the implementation of this design that affect the func-tionality and success of such a tool. These issues include: invoking methods; capturing runtime infor-mation; the availability of inforinfor-mation; the security of the test drive environment; the handling of com-ponent versions; the handling of comcom-ponent graphical user interfaces; and the handling of components using the event-listener model.
Information Selection A component’s runtime behaviour may consist of a massive number of events. While all of these events may have some bearing on the suitability of a component for a particular con-text, not all events have an equal bearing. If every event is stored in the visualisation, then the resources required to store, process, view, and comprehend the visualisation would be prohibitive. These costs would be paid by both the market and the consumer. It is therefore necessary to filter out certain data, and fo-cus on the important information that will assist a consumer to determine if a component is suitable. It is important to note that the consumers are viewing the visualisations to understand how the component works, and are not in an informed position to signifi-cantly help with filtering out unnecessary data.
Component Boundary Following on from the above discussion, we can then also draw a distinction between knowing the events that occur because of a component, as compared to knowing the events that occurwithina component. We define the boundary of the component as the method calls exiting the compo-nent, as well as the collection of system and network resources that are used by the component. Part of the audience intent discussed earlier is to understand how the component may interact with other components when placed into the consumer’s environment.
It is not particularly useful to capture all events that occur within another component (such as a stan-dard library) even though it is due to the candidate component’s behaviour. It would be sufficient to iden-tify that the other component has been invoked, along with the details of the service requested. One means of reducing the amount of data captured, and there-for simplifying the visualisations, is to only capture events within and on the boundary of the candidate component.
Security If markets are to host the capability to test drive components, the test driver should attempt to avoid compromising the security of the market’s servers. Security compromises could involve using
the network, file systems, or other server resources to break either the server itself, or to attack other servers on the network. One solution to this challenge is to make full use of the Java Security Manager. In the Java environment, it is possible to register a cus-tomised security manager with the virtual machine, so as to permit certain tasks, and block potentially dangerous tasks. Calls to the methods on the security manager can also be captured, and used to document permission requests.
Version Control An issue arises with the effect that the choice of virtual machine used by the test driver has on the test driven components. As both the test driver implementation and the test driven components are likely to reference the same classes in the standard development kit, then if they both need different versions of these classes, it becomes problem-atic to manage it. The main reason for this problem is in the fact that the classloader that loads classes into the virtual machine cannot handle managing classes with duplicate names.
The conflict will arise in the use of the standard development libraries, as the test driver implementa-tion only uses these libraries, along with custom built components unlikely to make it to the market. One solution is to have different implementations of the test drivers that work with different versions of the standard development libraries. When test driving a component, the server could note the version of Java the component was implemented for, and ensure that the appropriate matching test driver is used.
Graphical User Interfaces Another issue arises in the handling of a component’s GUI. Up to this point, we have assumed that components will be con-trolled through the programmer interface specified in the class description. This is true for business logic components. However, user interface compo-nents may also be exchanged in markets. These user interface components require a different means of con-trol to the components we have assumed. User inter-face components require that the GUI, executing on the server, be accessible on the client’s web browser. No current means of doing this in HMTL/CSS cur-rently exists, which means that a work-around needs to be created to handle this case.
One possible workaround is to use Virtual Network Computing (VNC)(VNC 2003). VNC supports view-ing a display on a separate machine to that which the display is executing on. There are currently VNC viewer applets available. These viewer applets could be built into web pages returned when a test drive form is submitted. The viewer applet would connect to a VNC server started in conjunction with the test driver. The test driver would create the GUI as any normal executing Java application would, and this GUI would be transmitted by the server to the client, allowing complete interaction. A consequence of this approach is that a VNC server would be necessary per test driver. It would not be possible to share displays due to the problem of accidentally showing someone somebody else’s test drive. This represents a probable resource drain on the Spider server.
Event-Listener Model The last issue we address is that of dealing with components that use an event-listener model. The challenge here is that these com-ponents need special configuration before they can be test driven. Specifically they require that a lis-tener be registered with the component, which is then
contacted when something happens in the compo-nent. Typically the component will use an interface as the type of the listener parameter in the registration method. This then allows component users to write customised classes that implement the interface, and that can easily be linked with the component. How-ever, for a test drive of such a component to be pos-sible, a dummy implementation of the listener must be created by the test driver.
4.2 Relevance to Consumers and Producers
We have created a prototype of a tool for creating software visualisations from test drives. The software visualisations (and the process by which they are cre-ated) can help consumers evaluate components, and help producers advertise components.
Helping Consumers We hope consumers can use software visualisations to comprehend more informa-tion than they would normally be able to do in a strictly textual format. The visualisations are cre-ated from a sequence of user requested actions. The software visualisation is focused on the goal repre-sented by the sequence of actions. This can help to remove extraneous information about the component that is not relevant to that goal. The test drive is either performed by the producer (who knows what goals can be achieved, and how), or by the consumer (who is exploring the component to see what goals can be achieved). In the former case, the software visualisation will guide the consumer as to how to achieve particular goals. In the latter case, the soft-ware visualisation will inform the consumer as to the success of their exploration. Both results are useful feedback when exploring the capabilities and usage of a component.
As well as this, the test drive execution is being done on the server-side. This means that consumers are not required to download, install and trust compo-nents prior to evaluation. This may also save time and effort ordinarily spent in the evaluation phase, and re-ducing the cost of component reuse. After a positive evaluation, there may be a few scenarios where the component will not perfectly fit into the new context, as the server environment may subtly differ from the consumer’s environment. It is unavoidable that the consumer will need to test the final selected compo-nent in their own environment, however the consumer will no longer need to do this for all the potential com-ponents.
Helping Producers Producers can create test-driven software visualisations to advertise the features of their components. These software visualisations would then complement other text-based documenta-tion currently supplied.
As well as this, by reducing the consumer’s cost of understanding, test-driven software visualisations may further encourage consumers to try reuse, ex-panding the audience for a producer’s component.
5 Related Work
There has already been significant research per-formed into visualising software applications. There is also significant literature focused on the creation of reusable components. As well as this, there has been some notable work on accessing certain types of applications through web interfaces, and this pa-per’s contribution is to attempt to draw these three avenues of research together.
There are a variety of purposes for which soft-ware visualisation techniques have been developed (Ellershaw & Oudshoorn 1994). These purposes in-clude use as pedagogical tools to teach Computer Science students how algorithms work ((Byrne, R & Stasko 1999) as one example), use in visual debug-gers to help correct bugs in software ((Mukherjea & Stako 1994) as one example), through to profiling large suites of applications to determine efficiency, correctness and help during maintenance.
Research into software visualisations for under-standing program traces does exist (Renieris & Reiss 1999) (Jerding & Stasko 1994) (Moe & Carr 2001), but much of this is not focused specifically on reuse and the information required in that process, and rather mentions maintenance as the driving factor.
Component-based development is developing into a vibrant activity within the field of software engi-neering (Ravichandran & Rothenberger 2003). The practice aims to deliver the benefits that reuse has promised (and delivered in some areas with quali-fied success) for decades. Research in the field of component reuse has been conducted for decades (McIllroy 1968), and ranges from examining how to reuse code, to what makes code reusable (Mili, Mili & Mili 1995), through to metrics to measure code reuse (Frakes & Terry 1996) (Ferri 1997).
Research is being conducted into providing ac-cess to web-based simulation tools for a distributed environment. One notable tool is PUNCH, a re-search project and tool being undertaken by Purdue University(Kapadia, Fortes & Lundstrom 2000).
6 Conclusion
The cost of obtaining a component suitable for a par-ticular reuse context can be prohibitive, negating the savings made by not implementing the functionality from scratch. This cost can be reduced by using soft-ware visualisations derived from component usage to reduce a sub-cost: that of understanding what a can-didate component does. We have implemented a pro-totype tool that supports the extraction of software visualisation information from a component’s runtime behaviour, where that behaviour is driven by an in-terested consumer, or an advertising producer.
References
Amazon (2003), ‘Amazon’,http://www.amazon.com. A leading print and multimedia market.
Byrne, M., R, C. & Stasko, J. (1999), ‘Evaluat-ing animations as student aids in learn‘Evaluat-ing com-puter algorithms’, http://citeseet.nj.nec. com/byrne99evaluating.html.
ComponentSource (2003), ‘ComponentSource web-site’, http://www.componentsource.com. The leading web-based component market.
Consortium, W. W. W. (2003), ‘W3C SVG website’, http://www.w3.org/Graphics/SVG/.
Ellershaw, S. & Oudshoorn, M. (1994), Program vi-sualisation — the state of the art., Technical re-port, Department of Computer Science, Univer-sity of Adelaide.
Ferri, R. (1997), ‘Software reuse metrics for an indus-trial project’, http://citeseer.nj.nec.com/ frakes96software.html.
Frakes, W. & Terry, C. (1996), ‘Software reuse: metrics and models’, ACM Computing Surveys
28(2), 415–435.
JCorporate (2003), ‘JCorporate website’, http:// www.jcorporate.com. component/application market based around open standards/source. Jerding, D. & Stasko, J. (1994), Using visualization
to foster object-oriented program understandin g, Technical Report GIT-GVU-94-33, Graphics, Visualization and Usability Center, College of Computing , Georgia Institute of Technology. Kapadia, N. H., Fortes, J. A. B. & Lundstrom,
M. S. (2000), ‘The Purdue University network-computing hubs: running unmodified simula-tion tools via the WWW’,ACM Transactions on Modeling and Computer Simulation (TOMACS)
10(1), 39–57.
Marshall, S., Biddle, R. & Tempero, E. (1999), Dyno: A tool for dynamic interactive documentation.,
in ‘First Symposium on Constructing Software Engineering Tools (CoSET’ 99)’.
McIllroy, M. (1968), Mass produced software compo-nents,inP. Naur & B. Randell, eds, ‘Report on a conference of the NATO Science Committee’, pp. 138–150.
Mili, H., Mili, F. & Mili, A. (1995), ‘Reusing software: Issues and research directions’, IEEE Transac-tions on Software Engineering21(6).
Moe, J. & Carr, D. (2001), Understanding distributed systems via execution trace data,in‘Proceedings of the ninth international workshop on program comprehension’.
Mukherjea, S. & Stako, J. (1994), ‘Towards vi-sual debugging: intergrating algorithm anima-tion capabilities within a source level debugger’,
ACM transactions on Computer-Human Inter-action3(1), 215–244.
Ravichandran, T. & Rothenberger, M. A. (2003), ‘Software reuse strategies and component mar-kets’, Communications of the ACM46(8), 109– 114.
Renieris, M. & Reiss, S. (1999), ‘ALMOST: explor-ing program traces’,http://citeseer.nj.nec. com/renieris99almost.html.
Sun Microsystems (2003), ‘Java Platform Debug-ger Architecture’,http://java.sun.com/j2se/ 1.4.1/docs/guide/jpda/.
VNC (2003), ‘RealVNC organisation website’,http: //www.realvnc.org.