NotiFly: Bandwidth Consumption Analyzer
for Smart Phone Applications
Arghyadip Paul1 Konark Gill2 Abhishek Mishra3
Department of Computer Science University of California Santa Barbara
Santa Barbara, CA
(arghyadip1, konarkgill2, amishra3)@cs.ucsb.edu ABSTRACT
With the recent advent of 3G and LTE/4G services, there is a mushrooming of network consuming applications for smart phones. There is a ubiquity of Internet and these applications make possible the always-connected user paradigm. From a novice user point of view, it is not very uncommon that user runs multiple bandwidth consuming applications in parallel with high availability of bandwidth, memory and speedy CPUs in smart phones. Till the user is in a high-bandwidth network everything will work properly, but in case she moves to a network where bandwidth is less, eventually, this behaviour will falter her smooth experience. We present here an application that can notify user when she is going through a low bandwidth network and suggests services what she may use or kill for a better overall experience.
General Terms
Smart Phones, Mobile Applications, Mobile Internet, User Experience, Always-On
Keywords
Android, Service and Application, NotiFly, Bandwidth Consumption, Notification
1. INTRODUCTION
High availability of mobile internet and improved access speeds have made available multiple applications and services for a smart phone. The advent of open platforms like Android, have made developers all over the world to contribute to this explosion of application availability and they provide an easy-to-use centralized service for users to download such third-party applications. The convenience of such “app-stores” to developers and users has made mobile devices more fun and useful. A recent study [2] shows that the number of niche “app-stores” for mobile devices has doubled
every year since 2009. Android “app-store” [1] alone holds more than 200,000 such applications. Advancements in social networking, online availability, rich online content, and varied range of web-services have brought in the concept of “always-on” availability for users through these third-party applications. The types of these application ranges from traditional web services like chat clients, email services, social networks and browsers to modern ad-hoc services like peer-to-peer applications, Presence [3], online gaming, VOIP and content streaming. The developments in high-speed multi-core CPUs, high memory and multi-tasking application framework have made mobile devices more powerful and it is highly likely to find a user simultaneously running multiple network based applications using mobile internet. In such cases, as long as the user is under a high-bandwidth and high network availability region, she observes a satisfying experience with the device but if the availability of network resources is below a certain level her overall user-experience will falter. Through our personal experiences we can say that in all such cases the user, being unaware of the actual reasons and rationale, normally blames the device for bad service.
We observe that there could be scenarios when conditions may arrive that the available bandwidth capacity provided to a device is not sufficient enough to serve all the parallel running applications simultaneously. These conditions fall under one or more of the following two cases:
a. User migrates to a region of low and inconsistent network coverage.
b. User runs multiple network intensive heavy applications which eat up the available bandwidth giving no room to smoothly run any of them in parallel. c. Congestion in the provider’s network. In such cases, a definite solution can be to provide user with information of application wise usage of bandwidth and thus allow them to close some of
the simultaneously executing applications in her device.
Motivated by this observation, we present NotiFly, a service which detects drops in bandwidth availability of each network intensive application running in a smart phone and suggests a set of applications, among the running ones, to users to shut them down so that the overall user experience of the device is not hampered. What we mean by poor user experience include glitches in content streaming, mums and white noise in VOIP call, slow browsing experience, inaccurate and lengthy GPS/Positioning/Maps measurements, etc. This approach will provide sufficient information to the smart phone users empowering them to infer the reasons for such faltered service experience. NotiFly is developed as an application in Android platform [4] and tested typically for above mentioned scenarios in university wireless Internet service at UCSB and home wireless Internet service. NotiFly does not provide mechanisms to detect reason for low bandwidth or rectify the bandwidth suffering in the device but only aims to enhance the device user experience.
The rest of this paper is organized in following way. Section 2 introduces some related work with bandwidth detection for Android platform. Section 3 explains the underlying theory and NotiFly system design. Section 4 describes the design challenges and use-cases. Section 5 discusses about implementation of NotiFly in Android platform. Section 6 describes the tests conducted and results obtained. Section 7 shows some insights on future enhancement.
2. RELATED WORK
Bandwidth detection for mobile application has been long prevailed in the mobile application industry. The Android Market app-store also includes a large number of such applications. Some applications from this category target the total amount of data received and sent by some well known applications. The most popular among this kind are Bandwidth Monitor [5]by SpiralAxis and NetTraffic Widget by Likee.com. The first one provides all kinds of network statistics for some well known and regularly used applications like email service. It also provides an interface to graphically show which application send and received the most amount of data. Users can set email notification when an application crosses a certain limit of data usage. The second application monitors the real time bandwidth and shows the traffic usage graph. Also, some application similar to above ones offer localized performance benchmark results and comparisons with other networks/devices in the same region. One such application is Network Test [8].
There are some applications which target to show the real time network speed in bits per second – bps (or Kbps) like the Speedtest.mobile from the famous native broadband speed testing website [6]. Another kind of applications in this category provides the data for required bandwidth for a network intensive application like VOIP and VideoCalls. A popular example from this category is Voip Bandwidth Calculator [7] from facadesoft.com.
Although some of the applications discussed above are very popular among users and their average user ratings are nearly 4.5 stars out of 5 stars, they tend to solve only speed detection and patterns changes in data usage problems. None of the applications discussed above provides a real time analysis of bandwidth to suggest users to close exit or shut down certain applications if bandwidth is suffering. To the best of our knowledge, NotiFly is first such application, which aims to solve the user experience problems due to suffering of bandwidth because of multiple reasons as discussed above in section 1.
3. THEORY AND SYSTEM DESIGN
The goal of NotiFly is to detect network congestion in a mobile device and notify users to shut-down some applications, in case, a condition of low bandwidth availability is found. Hence, we design NotiFly as a service in Android analogous to daemons in Unix/Linux which will run continuously in background. This service will capture the amount of data sent and received over the network, respectively, by each of the running application in a mobile device in a given period of time. The service periodically records this data and maintains a history of sent and received data-size on per application basis over a sampling period of time. At any given period of time, the change in amount of data received and sent is compared to the previous time instance. This change in amount of data, referred as delta, is used to determine the slope of bandwidth-time graph. In ideal conditions, a slope of positive or zero signifies a good behaviour but a negative slope signifies that the throughput (overall for the device or per application basis) is reducing and thus network congestion. For the real-world scenarios, we define two variables positive-delta and negative-delta. The first variable is to show number of increases in the value of delta and the later shows the number of decreases in the value of delta.
Figure 1 shows an ideal graph of variation of throughput with time for a typical application running in smart phone without any congestion or conditions of low-bandwidth. Tx shows the data transferred from the device to the network and Rx shows the data received by the device from the
network. An ideal condition will ignore fluctuations and temporary spikes and troughs in the graph. The slope of the curve at any given instance of time or delta at any sampling time instance will be positive or zero as the throughput will either be increasing while the application starts or remain constant as the application continues execution.
Figure 1: Variation of throughput vs time in ideal conditions
The above graph in real world scenario will show an increasing function with some number of positive-delta and some number of negative-delta resembling local maxima and local minima, as it will include fluctuations and variations from a stable equilibrium throughput value. As observed, when the bandwidth remains steady, the variations will be less and the absolute value of delta will be small. Also, in this case, the number of positive-delta and negative-delta will almost be equal. This will be explained in detail in section 6 while discussing the results obtained from the performed experiments.
Figure 2: Variation of throughput vs time in bandwidth contention condition
Figure 2 shows an ideal graph of variation of throughput with time for a similar application when there is network congestion or when multiple applications result in bandwidth contention. The slope of curve at any instance of time or delta at any sampling time instance will be negative. The overall throughput of the application will keep on decreasing as the execution continues its execution. For a real world scenario, the above graph will show a decreasing function. Because of the presence of fluctuations, there will be local maxima
and local minima present in the graph. As observed, in the bandwidth contention scenario, the variation in the value of delta will be more and number of negative-delta will be more than the number of positive-delta. This will be explained in detail in section 6 while discussing the results obtained from the performed experiments.
The above analysis is our basis of judgement and to decide when to show a notification to the user. While performing the experiments, we observed a peculiar case of false positive which led us to calculate the numbers of positive-delta and negative-delta. When an application like VOIP was under a voice-call and once the call was ended, there was a sudden decrease in the throughput as the required bandwidth of the application gets reduced drastically. Figure 3 shows an ideal graph of such cases.
Figure 3: Variation of throughput vs time for sudden closure of application
Since there was a sudden decrease in the throughput a false-positive was shown for all such cases. To separate this case, we observed that the number of positive-delta will be larger than negative-delta and the absolute value of delta will be very high when the application stops a network intensive job, for example call end in a VOIP application.
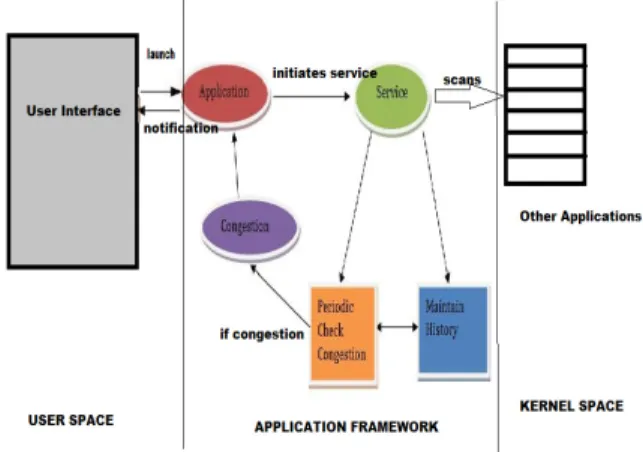
Figure 4 shows the high level diagram of the system architecture.
The system architecture was designed to be very generic so that the same logic can be applied to any of the prevalent mobile-application development platform. The only expected support from the platform is to provide a mechanism to detect application specific amount of data sent and received. This dependency was not a major issue as far our study goes as most of the popular application development framework like Android provides this feature in its framework layer. As the diagram shows, there are three spaces for an application in a mobile device – user space which is typically UI handling, application framework where the application logic is maintained and the kernel space through which application framework interacts for the underlying support. The service NotiFly is initiated by the application which is provided to the user. This service scans through the list of running applications to fetch the data of sent and received bytes through interfaces to the kernel provided by the application framework. The service reads this data for every running application within a sampling time period and maintains this data as the history. Also, in every sampling time, it calculated the number of positive-delta and number of negative-delta through the Congestion detection module. If congestion is detected at this module, an event notifying this state is sent back to application which initiates a user notification through user interface logic.
4. CHALLENGES AND USE CASES
A smart phone user can download and use multiple applications from the available app-stores. Each application has different kinds of network usability pattern and bandwidth consumption pattern. There were some typical challenges to design this system as an application.
Firstly, there may appear conditions when one or more of the application show transient bursting traffic while others do not. Such burst in one of the application may hamper the traffic requirement of other application thus triggering an event for notifying user about a congestion or low bandwidth. We categorize these conditions as false positives as temporary bursts may be allowed under certain limits. The first challenge here is to determine the limits for such application wise bursts in two respects – time duration of bursts and fluctuations in data-size during bursts. We employed a method of maintaining the history of transferred data, Tx and received data, Rx and perform calculations based on averages over a set of periods of sampling time.
Secondly, there were conditions when an application performing a network intensive task completes that task and is still running. A typical
example as discussed in section 3 is a VOIP application ended a call. A sudden decrease in throughput will be observed, which if not handled separately, will show a false positive assuming the decrease to be a result of congestion. The challenge was to handle these applications and thus we employed the concept of number of positive-delta and negative-delta.
The most interesting part of this work was to determine metric(s) which can provide a measure of throughput for smart phone applications. This is interesting as well as challenging, as we need to identify support from the application development platform, in our case, Android. Android provides classes to determine sent and received data in both the ways – overall device specific and per application specific. Each application in Android is installed and registered as a different user in the underlying Linux based kernel and this class exploits this architectural feature and uses the identity user-id of these applications to determine the per application traffic flow data. We will see this in more detail in section 5.
Another challenging part was a general profiling of limits of absolute value of delta, number of positive-delta and negative-delta to cover a general set of applications hosted in any Android based smart phone. The profiling was done by rigorous experimentation and testing with different values on a smart phone with a set of general applications most likely used by a common user.
Finally, there is a part when we need to make the usage of this application hassle free for a common user and show her notification based on the calculations performed. Since, Android supports different types of notification UI, we decided the best way to notify users was a status-bar-notification [9]. This kind of notifications are shown by an icon (and a text if included) on the top most bar of the device screen and doesn’t interfere with the application’s UI which the user is running. Each of the above challenges was handled through continuous testing and incremental changes added on trial-and-run basis. We were successfully able to keep our application user-friendly and with minimum overheads. The experiments and the results are explained in section 6.
5. IMPLEMENTATION
NotiFly was implemented as a service provided with an application in Android. Android platform provides APIs in its application framework layer to determine application specific data for amount of data sent and received in bytes.
Android application framework provides a Class, TrafficStats [14], which gives network traffic
statistics. These statistics include bytes transmitted and received and network packets transmitted and received, over all interfaces, over the mobile interface, and on a per-UID basis. Each application in Android is registered with a separate identity, UID in the underlying Linux kernel. The two APIs exposed by this class used for our purpose are getUidTxBytes( ) [15] and getUidRxBytes( ) [16]. We define two classes, one each for application activity and NotiFly service, namely, DemoTrafficStatActivity and NotiflyService, respectively. DemoTrafficStatActivity defines a repeating timer and adds Intent to NotiFly service. Upon the expiry of the timer every time i.e. every sampling period, through the defined Intent, control is send to NotiflyService. Another class is defined to maintain the history of the data fetched using the APIs shown above, called UIDTxRx. This class implements a circular queue using an array of both Tx and Rx values and exposes APIs to directly read and write data from the array in a sequential manner. NotiflyService class contains an object of class UIDTxRx for each application and thus maintains the history of the data on per-application basis. On every sampling period, data from the history is read and delta calculated between every consecutive entry in the history. Total positive-delta and total negative-delta is saved and compared. If the value of total positive-delta is less than the value of total negative-delta and the absolute difference delta is above a certain limit, then a notification event is send to application which triggers a status-bar-notification to the user regarding the congestion. If the values are within the safe limits, nothing is done and the cycle is repeated. In every cycle the history is updated and only top k results are stored in the object of UIDTxRx class.
In our current implementation and testing with Motorola Droid running Android Froyo 2.2 release, we fixed the value of k as 20 and value of sampling period as 3 seconds. We explain the tests performed and results obtained in section 6.
6. EVALUATION AND RESULTS
We have conducted several tests in the Motorola Droid Handset. The droid handset was installed Android Froyo 2.2 release and we installed NotiFly APK to perform the tests. We focused mainly to observe the performance of NotiFly under two conditions i. when all other applications which use network services from device are sitting idle and not exchanging any data with the network. ii. When a number of applications are competing for the network resource usages. To achieve the testing under these two scenarios, we have identified two potential android applications whose functionality depends largely on network speed. We installed a
BitTorrent client [10] which is consistently downloading and uploading data to the network. We installed Skype's android client [11] to test Video Call and VOIP performance in above mentioned two scenarios where in case i. Skype is running idle and not established any Voice Call or Video Call Session and no other network using applications are competing. In case ii., we established a video call between the android Skype client and another Skype Client installed in our personal laptop and also in parallel we started the bit-torrent application in background in the droid device. In all these tests, NotiFly was running as a service in background and monitoring whether running applications are suffering from congestion or not.
I. NO CONGESTION
In case i. where Skype is running idle and no other applications are competing for network bandwidth we did not see any false alarm raised by Skype. Considering the congestion detection mechanism based on total positive-delta/total negative-delta and periodic received (Rx) and transmitted (Tx) bytes we found the following behaviour of Skype when its running idle and not congesting the available network in the device.
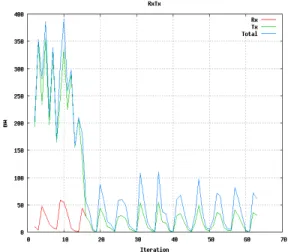
Figure 5: Tx and Rx for Skype running in a non-congested mode
In Figure 5, the graph shows the data sent (Tx), data received (Rx) by Skype application. Here we did not observe any significant change in the received Rx or send Tx or the total data sent/received in any two consecutive sampling periods, which indicates that the Skype application does not suffer from any network congestion. The maximum value is less than 400 bytes which is well under the defined limits constrained in the service. Only some minor change in total traffic sent/received occurred during the initial 15-20 sampling periods, which is because Skype sign-in process happens and it
retrieves all the contact information like Status Message, Status Icon, etc., and then it becomes idle as evident from Figure 5.
Figure 6: Tx and Rx for Skype running in a non-congested mode
In Figure 6 we have shown the sum of total positive-delta and total negative-delta as described in Section 3 for the Skype running in idle mode. In summary, as per NotiFly design, there should be congestion alarm, when total negative-delta exceeds total positive-delta by a certain threshold, delta-threshold. Sampling iteration in X axis of figure 6 is 20 less than the sampling iteration in figure 5. This is because NotiFly checks congestion status of an application only when it has sufficient history of network usage of an application. In our experiment history length of bandwidth usage we have used is 20 which means that after collecting 20 samples of transferred bytes and received bytes NotiFly starts checking if an application is suffering from congestion or not. So a sampling iteration X in RxTx Graph corresponds to X-20 sampling iteration in total positive-delta/total negative-delta graph E.g. In figure 5, sampling iteration 21 corresponds to sampling iteration 1 in figure 6.
From figure 6, it is evident that there is no such sampling period where the total negative-delta (Red Line) exceeds total positive-delta (Green Line) by a huge value. As an obvious consequence, we did not receive any congestion alarm from NotiFly in this scenario, which proves that NotiFly's behaviour is not faulty when there are chances of false positives but no congestion. II. CONGESTION
In the second set of experiments we aimed to investigate the performance of NotiFly and other applications competing for network resource access. We start Skype first while NotiFly service was running in the background and constantly monitoring the performance of the network consuming applications. We established a video
call session between the Skype client in Droid and the Skype client in our laptop. Once the video call session was established we started the BitTorrent client also. Once the BitTorrent Client discovered all its peers, it established peer-to-peer upload/download link to its full capacity and as an obvious consequence to this, the video call session in Skype started suffering from network problem.
Figure 7: Total Transferred/Received bytes by the BitTorrent
Figure 8: Total Transferred/Received bytes by Skype
In figure 7 and figure 8, we have shown the total bandwidth consumed by Skype and BitTorrent client in multiple sampling periods. In the above figures Skype was running smoothly since sampling period instance number 17 and once BitTorrent client started and started competing for the available bandwidth in the device with Skype. Between the sampling period instances 20 to 35, both Skype and BitTorrent competed for the network and from figure 8, it can be seen that total bandwidth (Tx+Rx) consumed by Skype from sampling period 15 to 35 of time has degraded constantly which indicates that Skype video call session started suffering from bandwidth congestion in the device during this period. Finally
we have confirmed our claim by showing a network problem pop-up in the Skype client running in the laptop which is the other peer of the video call session. Even though no such pop up shown by Skype client in the Droid Client NotiFly in Droid sensed the congestion and showed a pop up reporting the congestion found.
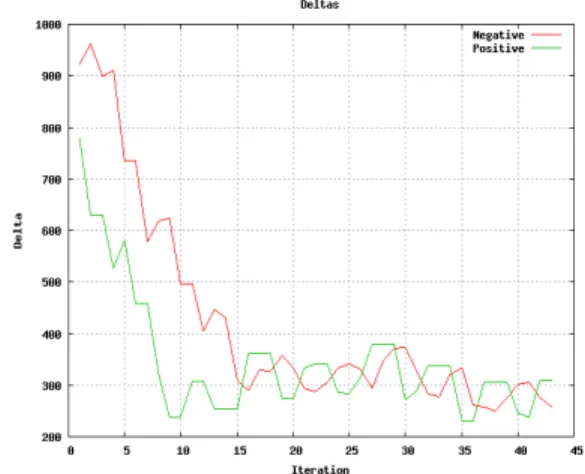
Figure 9: Positive and Negative Delta during the Congestion period for Skype
In figure 9, we have shown the total positive-delta value and total negative-delta value found across various sampling periods for Skype. In sub-section I. NO CONGESTION scenario we have described that a sampling iteration X in Tx Rx graph corresponds to sampling iteration X-20 in the total positive-delta - total negative-delta graph, e.g Sampling Iteration 20 in figure 8 corresponds to the Sampling Iteration 0 in figure 9.
As described before as from figure 8, it is clear that Skype client in Droid starts suffering from the bandwidth congestion from sampling iteration 17. We can further see that the total negative-delta
Figure 10: Positive and Negative Delta during the Congestion period for BitTorrent
exceeds total positive-delta value of Skype from sampling iteration number 3 in figure 9. Further during sampling iteration 10 in figure 9 total negative-delta exceeds total positive-delta of Skype by 750,000 which exceeds the delta_threshold described before. This is the time when NotiFly detected that there was congestion in the available bandwidth for Skype and shown the alarm using the Pop-up.
Figure 10 captures the total negative-delta and total positive-delta count for the entire test duration for the Bit-Torrent client. From figure 10 it can be noticed that total negative-delta stayed always less or almost equal to total positive-delta for the BitTorrent client except at the end when we ended our experiment and stopped all the applications in Droid and stopped NotiFly service.
Energy Consumption:
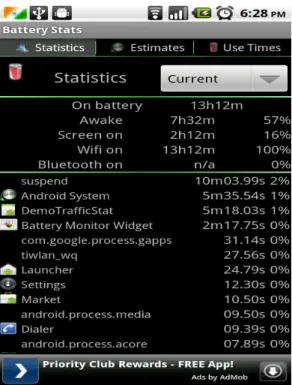
We report energy consumption of to NotiFly as a background service using Battery Monitor Widget [12] available in Android Market. We did not see any significant battery and CPU usage for NotiFly. We further confirm the battery and CPU usage statistics of NotiFly by taking the screenshots of the [12] using Android SDK DDMS tool [13].
Figure 11 shows the battery usage of all the running applications and services. The total time period for which we monitor the battery usage using [12] is approximately 13 hours 12 minutes and out of this NotiFly (identified as DemoTrafficStat in figure 11) only used a total of 5 minutes of battery which is approximately 1% of the total battery usage.
We also investigated the CPU usage statistics of NotiFly using [12]. Figure 12 shows the CPU usages statistics of all running android services and applications in android since the system was booted. NotiFly (identified by DemoTrafficStat) in figure 12 consumes CPU cycles higher than other running application due to periodic monitoring nature of it.
7. FUTURE WORK
As an extension to this project done, we further aim to modify NotiFly to give provision to the user an option to kill the applications which are consuming large portion of the bandwidth. We are also working to minimize the number of CPU cycle consumed by NotiFly by necessary code optimization.
Figure 11: Battery Usage Statistics of Droid.
Figure 12: CPU Usage Statistics of Droid.
REFERENCES 1. market.android.com/Apps 2. http://www.readwriteweb.com/archives/numbe r_of_niche_app_stores_has_doubled_every_ye ar.php 3. http://www.openmobilealliance.org/Technical/ release_program/imps_v1_3a.aspx 4. http://developer.android.com/index.html 5. http://www.spiralaxis.com/bandwidth-monitor.aspx 6. http://www.speedtest.net/ 7. www.facadesoft.com 8. http://www.appbrain.com/app/network-test/com.measurement.frontend 9. http://developer.android.com/guide/topics/ui/n otifiers/notifications.html 10. https://market.android.com/details?id=com.Dr oiDownloader&hl=en 11. https://market.android.com/details?id=com.sky pe.raider&hl=en 12. https://market.android.com/details?id=ccc71.b mw&hl=en 13. http://developer.android.com/guide/developing /debugging/ddms.html 14. http://developer.android.com/reference/android /net/TrafficStats.html 15. http://developer.android.com/reference/android /net/TrafficStats.html#getUidTxBytes(int) 16. http://developer.android.com/reference/android /net/TrafficStats.html#getUidRxBytes(int)