Original Article
Differential expression profile analysis of miRNAs with
HER-2 overexpression and intervention in breast
cancer cells
Xian Wang
1,2, Dongrui Jiang
1, Chengchen Xu
2, Guilu Zhu
2, Zhengsheng Wu
2, Qiang Wu
21Department of Pathology, The Second Affiliated Hospital of Anhui Medical University, Hefei, China; 2Department of Pathology, Anhui Medical University, Hefei, Anhui, China
Received March 7, 2017; Accepted March 28, 2017; Epub May 1, 2017; Published May 15, 2017
Abstract: Receptor tyrosine-protein kinase erbB-2 (HER-2) as a member of the human epidermal growth factor re-ceptor family, plays a key role in the development and the progression of certain aggressive types of breast cancer, and has become an important biomarker and target of therapy for breast cancer. Recently, liquid biopsy biomarker of tumor cells, such as miRNAs, has been validated and approved as a useful prognostic method for cancer, and however of which in breast cancer is not fully elucidated. To address it, human breast cancer cell stains of MCF-7, BT474, MCF-7/HER-2, BT474/HER-2 (siRNA) were chosen, and the mRNA and protein expression level of HER-2 was analyzed by real-time quantitative polymerase chain reaction (RT-qPCR) and Western Blot respectively.
Subse-quently, the differential expression profile of miRNA was analyzed by miRNA gene-chip with bioinformatics analysis. As expected, the mRNA and protein expression level of HER-2 was significantly increased with HER-2 overexpres
-sion in MCF-7 cells, and significantly decreased with HER-2 intervention in BT474 cells. Significantly, a total of 217 miRNAs with 123 up-regulated miRNAs and 94 down-regulated miRNAs was identified with HER-2 overexpression
in MCF-7 cells, and also a total of 374 miRNAs with 121 up-regulated miRNAs and 253 down-regulated miRNAs
were identified with HER-2 intervention in BT474 cells. Wherein, 10 miRNAs were up-regulated with HER-2 overex -pression in MCF-7 cells, and down-regulated with HER-2 intervention in BT474 cells synchronously, and 17 miRNAs were down-regulated with HER-2 overexpression in MCF-7 cells, and up-regulated with HER-2 intervention in BT474 cells synchronously, and the expression level of hsa-miR-877-3p was consistent with gene-chip results, and not only
provided a significant reference on the differential expression of miRNAs in breast cancer cells and its culturing supernatant, and also provided a significant potentially liquid biopsy biomarker for breast cancer in clinic.
Keywords: Breast cancer, miRNA, receptor tyrosine-protein kinase erbB-2, overexpression, intervention, gene-chip, differential expression
Introduction
Breast cancer is a kind of cancer of which
origi-nates from breast tissue of male and female,
and often occurs in female with the signs of a
lump in the breast, a change in breast shape
and size, dimpling of the skin, fluid coming from
the nipple, and a red scaly patch of skin, and
often combines with bone pain, swollen lymph
nodes, shortness of breath, and yellow skin
fol-lowing its distant spread [1-4]. Several risk
fac-tors are associated with its arising, such as
female sex, obesity, lack of physical exercise,
drinking alcohol, hormone replacement therapy
during menopause, ionizing radiation, early age
at first menstruation, older age, and family his
-tory, etc [5-8]. Several receptors on cell surface
and in cell cytoplasm and nucleus of breast
cancer cells were reported, including estrogen
receptor (ER) [9-11], progesterone receptor
(PR) [12-14], and tyrosine-protein kinase
erbB-2 receptor (HER-erbB-2) [15-17].
HER-2 was mainly located in the cell membrane
to act as a tumorigenesis, and could maintain
and/or accelerate the growth, the invasion, the
angiogenesis of tumor cells, and also inhibit
cell apoptosis and damage tissue barrier, and
its over-expression implies an adverse
biologi-cal behavior and prognosis [21-25]. Therefore,
how to effectively inhibit the over-expression of
HER-2 in breast cancer cells has been became
a hot topic, and logically microRNA (miRNA) was
chosen as a potentially target for inhibiting of
the expression of HER-2 in breast cancer cells
duo to its down-regulated characteristic for
tar-get gene [26-28].
miRNAs are endogenous, non-coding, small
RNAs of 21-25 nucleotides, and are widely
dis-tributed in tissues and organs of different
spe-cies [29-31]. miRNAs strongly affect their
tar-get genes by forming RNA-induced silencing
complexes (RISCs) that partially bind to the 3’
untranslated region (3’-UTR) of target genes to
induce mRNA degradation or to inhibit mRNA
translation [32, 33]. Recently, as a variety of
studies have documented, several miRNAs
were closely associated with HER-2 in breast
cancer cells, such as miR-205 [33],
hsa-miR-497 [34], hsa-miR-125a/hsa-miR-125b
[35], hsa-miR-331-3p [36-38], hsa-miR-23b
[39], hsa-miR-27b [40], and hsa-miR-21 [41],
etc. However, the detailed differential
expres-sion profile of miRNA in breast cancer cells with
HER-2 overexpression and intervention has
been no reported so far. Based on it, the MCF-7,
BT474, MCF-7/HER-2, and BT474/HER-2 (siRNA)
cell strains were chosen, and the differential
expression of miRNAs were identified by
gene-chip and bioinformatics analysis, and several
significantly up-regulated and down-regulated
miRNAs were screened, and exhibited a signifi
-cant application value on the treatment of
breast cancer in clinic.
Materials and methods
Cell strains and culturing
The MCF-7 and BT474 cell strains were kindly
presented by professor Zhu Tao of the University
of Science and Technology of China, and
resur-rected from liquid nitrogen using Roswell Park
Memorial Institute-1640 medium (RPMI-1640,
Hyclone, USA) with 10% (v/v) fetal bovine
serum, and cultured to the logarithmic phase in
a carbon dioxide (CO
2)-incubator with 5% CO
2at
37°C. Similarly, MCF-7/HER-2 cell strain of
which was over-expressed HER-2 gene, and
BT474/HER-2 (siRNA) cell strain of which was
intervened HER-2 gene, was kindly presented
by professor Liu Jing of the University of Science
and Technology of China, and resurrected from
liquid nitrogen using Dulbecco minimum
essen-tial high glucose medium (DMEM, Hyclone,
USA) with 10% (v/v) fetal bovine serum and
antibiotics of G418 (finally concentration: 0.5
mM), and cultured to the logarithmic phase in a
CO
2-incubator with 5% CO
2at 37°C.
Total RNA extraction of MCF-7, BT474, MCF-7/
HER-2, and BT474/HER-2 (siRNA) cells
The above-mentioned MCF-7, BT474, MCF-7/
HER-2, and BT474/HER-2 (siRNA) cells were
diluted to 2 × 10
6cell/ml, and inoculated to a
T-25 cm
2flask, and separately cultured in a
CO
2-incubator with 5% CO
2at 37°C till 80%
con-fluence, and cells were collected to extract the
total RNA according to the manufacturer’s
instructions of a Total RNA Extraction Kit
(Tiagen, Beijing, China), and the purity and the
concentration of total RNA was confirmed by
ultraviolet visible spectrophotometer (Bio-Rad,
USA). After then, the total RNA was reversely
transferred with a Reverse Transcription Kit
(Toyobo, Japan) according to the
manufactur-er’s instructions. The reaction mixture,
includ-ing 10 μL 2 × loadinclud-ing buffer, 1.2 μL oligo (dT), 2
μL RNA, 0.2 μL MMLV, and 6.6 μL DEPC ddH
2O,
was prepared and reacted at 65°C for 30 min,
followed by 42°C for 30 min, and then by 85°C
for 10 min.
Real time quantitative polymerase chain
reac-tion (RT-qPCR) assay
The above-extracted of a total of 100 ng cDNA
was used as a template in a RT-qPCR reaction
using SYBR
®Premix Ex TaqTM kit (TAKARA,
Japan), according to the manufacturers’
instruc-tions. The reaction mixture, including 12.5 μL 2
× Primer Taq Mix, 1 μL forward primer, 1 μL
reverse primer, 1 μL cDNA, and 9.5 μL ddH
2O,
was prepared and performed RT-qPCR
accord-ing to the program: one cycle of 94°C for 5 min;
40 cycles of 94°C for 30 s, 54°C for 30 s, and
72°C for 30 s, using primers as following:
HER-2: pU: AGTACCTGGGTCTGGACGTG-3’ and pD:
5’-AGCCATGTACGTAGCCATCC-3’ and pD: 5’-CT-
CTCAGCTGTGGTGGTGAA-3’. The results were
analyzed using the SDS 1.41 software (Applied
Biosystems, USA) based on 2-ΔΔCt, and histo
-gram analysis using the Origin 9.4 software
(http://www.originlab.com/).
Western blot assay
The above-mentioned MCF-7, BT474, MCF-7/
HER-2, and BT474/HER-2 (siRNA) were diluted
to 2 × 10
6cell/ml, and inoculated to a T-25 cm
2flask, and cultured in a CO
2-incubator with 5%
CO
2at 37°C till 80% confluence, and total pro
-teins were extracted to measure the
concentra-tion by a BCA protein quantificaconcentra-tion kit (Thermo,
USA), and about 35 mg total proteins was
frac-tionated by electrophoresis through 12.5%
polyacrylamide gels, and transferred to a
poly-vinylidene difluoride (PVDF) membrane (GE
Healthcare) following the manufacturers’ ins-
tructions. The membrane was probed with the
first antibody, anti-HER-2 monoclonal antibody
(ab16901, Abcam, USA) and anti-β-actin mono
-clonal antibody (ab8226, Abcam, USA) for 1.5
hr at room temperature (RT). Afterward, the
membrane was incubated with horseradish
peroxidase-conjugated goat anti-mouse
sec-ondary antibody (1:5,000 in TBST; Beijing Go-
lden Bridge Biotechnology Company Ltd, China)
at RT for 1 hrs. The chemiluminescence luminol
reagent (ZKP-C150044-1, Suzhou Zeke
bio-tech Co., LTD, Jiangsu, China) were used to de-
velop the immune-labeled bands on X-ray film,
and the optical density of the bands was
quan-tified using the ImageJ 1.46 software (http://
[image:3.612.96.522.70.231.2]rsb.info.nih.gov/ij/download.html), and a
histo-gram was generated using the Origin 9.5
soft-ware (http://www.originlab.com/).
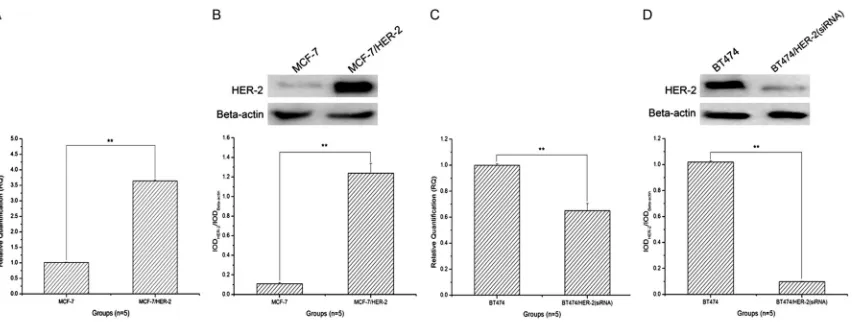
Figure 1. The mRNA and protein expression level assay of the over-expressed and the intervened HER-2 in MCF-7 and BT474 cells by RT-qPCR and Western Blot, and histogram analysis. A. The mRNA expression level assay of the over expressed HER-2 in MCF-7 by RT-qPCR; B. The protein expression level assay of the over expressed HER-2 in MCF-7 by Western blot, and histogram analysis; C. The mRNA expression level assay of the over expressed HER-2 in BT474 by RT-qPCR; D. The protein expression level assay of the over expressed HER-2 in BT474 by Western blot, and histogram analysis. The images indicated that the mRNA and protein expression level of the over-expressed
HER-2 was significantly increased (**: P < 0.01, compared to MCF-7 cells alone), and the intervened HER-2 was significantly decreased (**: P < 0.01, compared to BT474 cells alone).
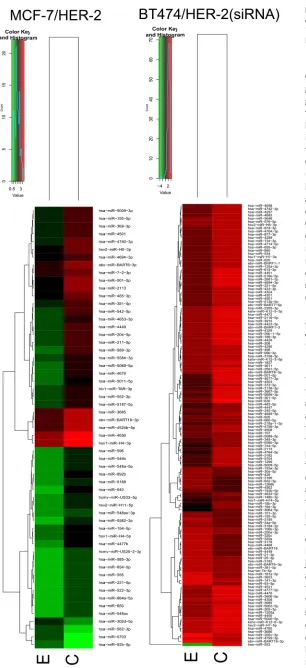
Figure 2. The fluorescent hybridization signal of miR -NAs in breast cancer cells. The images indicated the
obvious fluorescent hybridization signal of miRNAs
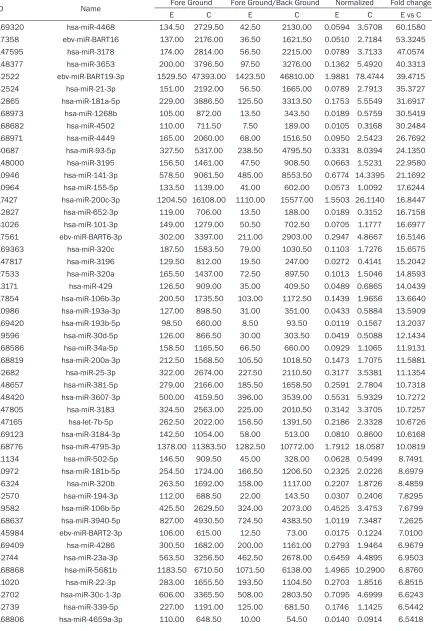
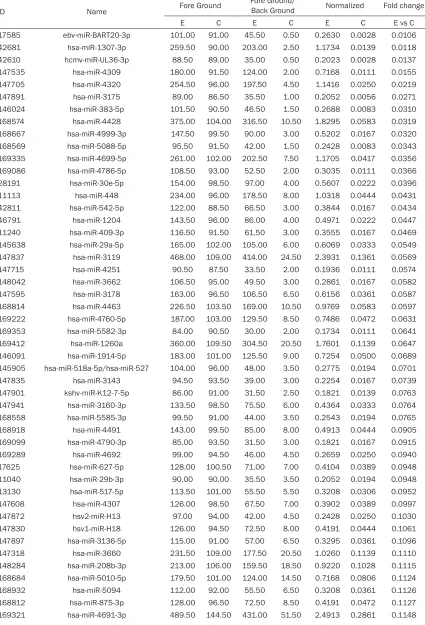
[image:3.612.90.283.350.578.2]Table 1.
The up-regulated miRNAs of MCF-7 cells with HER-2 gene overexpression
ID Name Fore Ground Fore Ground/Back Ground Normalized Fold change
E C E C E C E vs C
miRNA extraction of MCF-7, BT474, MCF-7/
HER-2, and BT474/HER-2 (siRNA) cells
The above-mentioned MCF-7, BT474, MCF-7/
HER-2, and BT474/HER-2 (siRNA) cells were
diluted to 2 × 10
6cell/ml, and inoculated to a
T-25 cm
2flask, and separately cultured in a
CO
2-incubator with 5% CO
2at 37°C till 80%
con-fluence, and cells and its culturing supernatant
were collected to extract miRNA according to
the manufacturer’s instructions of miRNA ex-
traction kit (Tiagen, Beijing, China). After
grind-ing, 1 mL of TRIzol was added, and the samples
were mixed for 30 s and then incubated at
room temperature for 5 min. Chloroform (200
μL, Invitrogen, USA) was added to the samples,
which were mixed for 15 s, incubated at room
temperature for 5 min, and centrifuged at 4°C,
at 12,000 rpm for 10 min. The supernatant
was collected, mixed with 1.5 volumes of
abso-lute ethanol, transferred to a miRspin column,
and centrifuged at room temperature, at
12,000 rpm for 30 s. The effluent was removed,
and 500 μL MRD buffer was added to the col
-umn, which was incubated at room
tempera-ture for 2 min followed by centrifugation at
room temperature, at 12,000 rpm for 30 s. The
effluent was removed and 700 μL RW buffer
was added to the column, which was incubated
at room temperature for 2 min followed by
cen-trifugation at room temperature at 12,000 rpm
for 30 s, and repeated once with 700 μL RW
buffer. The effluent was removed and 500 μL
RW buffer was added to the column, which was
then incubated at room temperature for 2 min,
followed by centrifugation at room
tempera-ture, at 12,000 rpm for 30 s. The column was
transferred to a new collection tube and
centri-fuged at 12,000 rpm for 1 min to remove any
residual liquid. After air-drying at room
temper-ature, 30 μL of RNase-free double-distilled H
2O
(ddH
2O) was added to the miRspin column. The
column was centrifuged at room temperature,
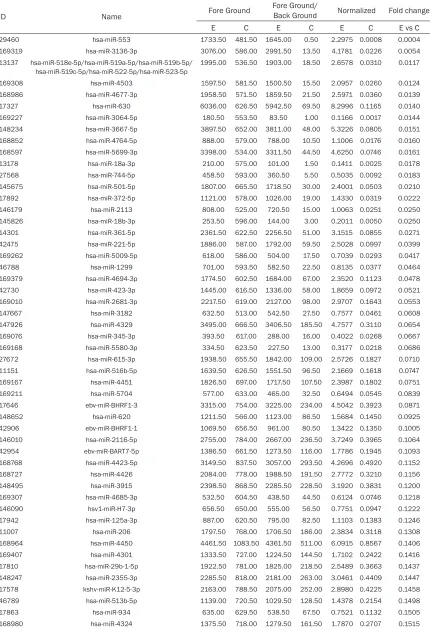
Table 2.
The down-regulated miRNAs of MCF-7 cells with HER-2 gene overexpression
ID Name Fore Ground
Fore Ground/
Back Ground Normalized Fold change
E C E C E C E vs C
29460 hsa-miR-553 1733.50 481.50 1645.00 0.50 2.2975 0.0008 0.0004 169319 hsa-miR-3136-3p 3076.00 586.00 2991.50 13.50 4.1781 0.0226 0.0054 13137 hsa-miR-518e-5p/hsa-miR-519a-5p/hsa-miR-519b-5p/
hsa-miR-519c-5p/hsa-miR-522-5p/hsa-miR-523-5p
1995.00 536.50 1903.00 18.50 2.6578 0.0310 0.0117
at 12,000 rpm for 2 min. The effluent was col
-lected, and the purity and the concentration of
extracted miRNA were determined by ultravio-
let visible spectrophotometer (Bio-Rad, USA).
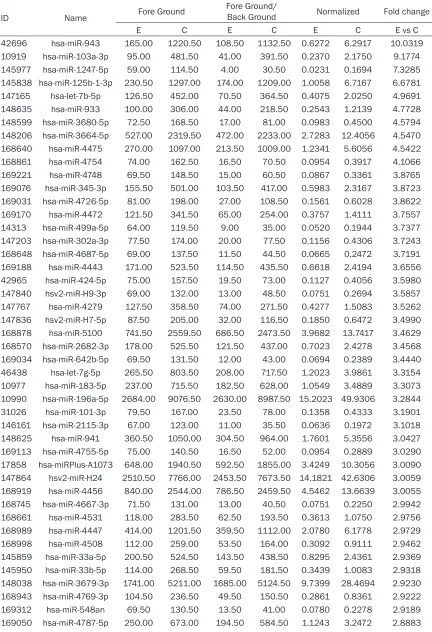
Table 3.
The up-regulated miRNAs of BT474 cells with HER-2 gene intervention
ID Name Fore Ground
Fore Ground/
Back Ground Normalized Fold change
E C E C E C E vs C
miRNA gene-chip assay
The above-validated miRNA was fluorescently
labeled by Hy3 or Hy5 using miRCURY Array
Power Labeling Kit (Exiqon, Denmark), and
hybridized with microarray within 1-2 hrs. The
chips above-hybridized was washed using
Wash Buffer Kit (Exiqon, Denmark). The fluores
-cent signal was detected with a Gene Pix
4000B laser scanner, and differential
expres-sion of miRNA was assigned according to
Student’s t-test and the fold change (FC) using
the significance analysis of Gene Pixpro V6.0
software.
Quantitative reverse transcription-polymerase
chain reaction assay of miRNA
miRNA was used as the template in a reverse
transcription reaction using a kit (TOYOBO,
Japan), according to the manufacturer’s
instruc-tions. The miRNA reverse transcription reaction
mixture included 10 μL 2 × loading buffer, 1.2
μL miRNA RT primer/U6 small nuclear RNA
primer, 2 μL miRNA template, 0.2 μL MMLV
reverse transcriptase, and 6.6 μL DEPC-treated
H
2O. The reaction was incubated at 26°C for 30
min, followed by 42°C for 30 min, and then by
85°C for10 min. For quantitative PCR (qPCR),
100 ng cDNA was used as the template in are
action mixture that included 10 μL 2 × Master
Mix, 0.08 μL forward primer, 0.08 μL reverse
primer, 2 μL cDNA template, 0.4 μLTaq DNA
polymerase, and 7.44 μL ddH
2O. The qPCR
amplification conditions were as follows: one
cycle of 95°C for 3 min; 40 cycles of 95°C for
12 s, 62°C for 30 s, and 72°C for 30 s. The
results were analyzed using SDS 1.4 software
(Applied Biosystems).
Gene ontology (GO) clustering
The GO database (http://geneontology.org/
)
includes three functional categories: biological
process, cellular component, and molecular
Table 4.
The down-regulated miRNAs of BT474 cells with HER-2 intervention
ID Name Fore Ground
Fore Ground/
Back Ground Normalized Fold change
E C E C E C E vs C
function. Genes could be further organized by
directed acyclic graph according to their scope.
In GO clustering, genes are considered signifi
cantly enriched based on the ratio of the
Figure 3. The heartmap of differ-ential expression miRNA in MCF-7, BT474, MCF-7/HER-2, and BT474/HER-2 (siRNA) cells.
observed GO term for all
genes/GO term for a single
gene set. First, each gene
that was assigned a
particu-lar GO term was broadly noted
in the upper father node, then
the
p
-value of each enriched
GO term was determined
using a hypergeometric
distri-bution, and the
p
-value was
adjusted using the false
dis-covery rate (FDR), with P =
0.05 selected as the
thresh-old value. Subsequently,
redundant GO terms were
removed, and the hierarchy
chart’s terminal nodes were
selected as the final signifi
-cantly enriched GO terms.
Kyoto encyclopedia of genes
and genomes (KEGG)
path-way enrichment analysis
Figure 4. The differential expression miRNAs assay by RT-qPCR. The image indicated that with HER-2 overexpression, the expression level of
hsa-miR-877-3p was significantly increased, and synchronously decreased (**: P < 0.01, when compared to control).
Figure 1C
, when compared to BT474 cells
alone, the mRNA expression level of HER-2 was
significantly decreased in BT474/HER-2 (siRNA)
cells (**: P < 0.01), and decreased by about
30%. Similarly, the protein expression level of
HER-2 was also significantly decreased in
BT474/HER-2 (siRNA) cells when compared to
that of BT474 cells alone (
Figure 1D
, **: P <
0.01).
miRNA gene-chip assay
To elucidate the differential expression profile
of miRNAs in breast cancer cells, the miRNA
gene-chip was chosen, and the gene-chip
image of breast cancer cells was shown in the
[image:18.612.92.352.101.479.2]Figure 2
.
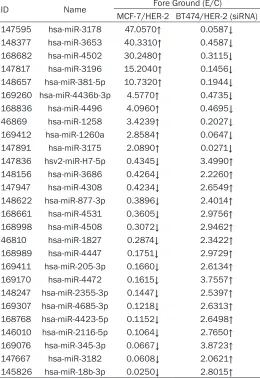
Table 5.
The differential expression miRNAs with HER-2
over-expression or intervention
ID Name Fore Ground (E/C)
MCF-7/HER-2 BT474/HER-2 (siRNA) 147595 hsa-miR-3178 47.0570↑ 0.0587↓
148377 hsa-miR-3653 40.3310↑ 0.4587↓
168682 hsa-miR-4502 30.2480↑ 0.3115↓
147817 hsa-miR-3196 15.2040↑ 0.1456↓
148657 hsa-miR-381-5p 10.7320↑ 0.1944↓
169260 hsa-miR-4436b-3p 4.5770↑ 0.4735↓
168836 hsa-miR-4496 4.0960↑ 0.4695↓
46869 hsa-miR-1258 3.4239↑ 0.2027↓
169412 hsa-miR-1260a 2.8584↑ 0.0647↓
147891 hsa-miR-3175 2.0890↑ 0.0271↓
147836 hsv2-miR-H7-5p 0.4345↓ 3.4990↑
148156 hsa-miR-3686 0.4264↓ 2.2260↑
147947 hsa-miR-4308 0.4234↓ 2.6549↑
148622 hsa-miR-877-3p 0.3896↓ 2.4014↑
168661 hsa-miR-4531 0.3605↓ 2.9756↑
168998 hsa-miR-4508 0.3072↓ 2.9462↑
46810 hsa-miR-1827 0.2874↓ 2.3422↑
168989 hsa-miR-4447 0.1751↓ 2.9729↑
169411 hsa-miR-205-3p 0.1660↓ 2.6134↑
169170 hsa-miR-4472 0.1615↓ 3.7557↑
148247 hsa-miR-2355-3p 0.1447↓ 2.5397↑
169307 hsa-miR-4685-3p 0.1218↓ 2.6313↑
168768 hsa-miR-4423-5p 0.1152↓ 2.6498↑
146010 hsa-miR-2116-5p 0.1064↓ 2.7650↑
169076 hsa-miR-345-3p 0.0667↓ 3.8723↑
147667 hsa-miR-3182 0.0608↓ 2.0621↑
145826 hsa-miR-18b-3p 0.0250↓ 2.8015↑
Stat
istical analysis
All data are expressed as the mean
± standard deviation (SD). Statis-
tical analysis was carried out by
one-way analysis of variance using
the SPSS software (version 21.0,
http://spss.en.softonic.com/). Stu-
dent’s t-test was carried out on
groups of two samples, and P <
0.05 and P < 0.01 were considered
to indicate a significant difference
and a highly significant difference,
respectively.
Results
The mRNA and protein expression
level of HER-2 was significantly
increased with HER-2
overexpres-sion, and significantly decreased
with HER-2 intervention
As exhibiting of RT-qPCR result
of
Figure 1A
, when compared to
MCF-7 cells alone, the mRNA ex-
pression level of HER-2 was signifi
-cantly increased in MCF-7/HER-2
cells (**: P < 0.01), and increased
by about 3.6 times. Similarly, the
protein expression level of HER-2
was also significantly increased in
MCF-7/HER-2 cells when compared
to that of MCF-7 cells alone (
Figure
1B
, **: P < 0.01). Synchronously,
[image:18.612.92.286.504.649.2]Differential expression profiles analysis of
miR-NAs with HER-2 overexpression and
interven-tion by miRNA gene-chip
In breast cancer cells of MCF7 with HER-2
over-expression, a total of 217 miRNAs were
identi-fied. Wherein, a total of 123 up-regulated miR
-NAs (
Table 1
), and a total of 94 down-regulated
miRNAs (
Table 2
) were validated. Synchronou-
sly, with HER-2 intervention in BT474 cells, a
total of 374 miRNAs were identified. Wherein, a
total of 121 up-regulated miRNAs (
Table 3
),
and a total of 253 down-regulated miRNAs
(
Table 4
) were validated, and the heartmap was
shown in the
Figure 3
. As further analysis in
Table 5
, a total of 10 miRNAs were
up-regulat-ed with HER-2 overexpression in MCF-7 cells,
and down-regulated with HER-2 intervention in
BT474 cells synchronously, and 17 miRNAs
were down-regulated with HER-2
overexpres-sion in MCF-7 cells, and up-regulated with
HER-2 intervention in BT474 cells synchron-
ously.
hsa-miR-877-3p was significantly decreased
with HER-2 overexpression, and significantly
increased with HER-2 intervention
As exhibiting of RT-qPCR result of
Figure 4
,
based on the previous study and the biological
functions of screened miRNAs,
hsa-miR-877-3p was chosen for RT-qPCR identification using
primers as showing in
Table 6
, and manifested
as a significant decrease with HER-2 gene over
-expression, and a significant increase with
HER-2 gene intervention, and accordance with
gene-chip results.
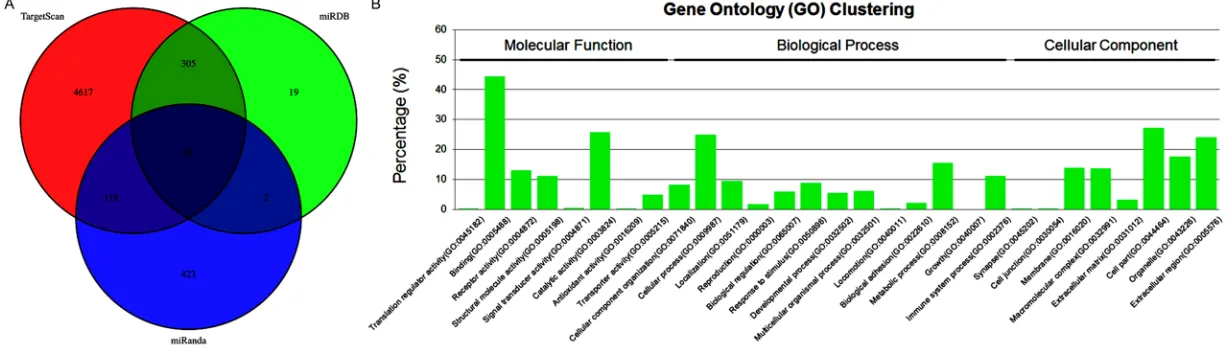
Furthermore, as exhibiting of
Figure 5A
,
hsa-miR-877-3p regulated target genes were
pre-dicted by software of TargetScan, miRDB, and
miRanda, and a total of 11 cross genes were
obtained with GO and KEGG pathway clustering
analysis. As exhibiting of
Figure 5B
,
hsa-miR-877-3p is associated with the molecular
func-tion of translafunc-tion regulator activity, binding,
receptor activity, structural molecule activity,
signal transducer activity, catalytic activity,
regulation, response to stimulus,
developmen-tal process, multicellular organismal process,
locomotion, biological adhesion, metabolic
pro-cess, growth, and immune system propro-cess,
and the cellular component of synapse, cell
junction, membrane, macromolecular complex,
extracellular matrix, cell part, organelle, and
extracellular region, and its regulated KEGG
pathway was exhibiting in
Figure 6
.
Dis
cussion
The present study demonstrated that with the
over-expression and intervention of HER-2,
sev-eral differential expression miRNAs were
screened in breast cancer cells, and
manifest-ed as a total of 217 miRNAs were identifimanifest-ed in
breast cancer cells, including 123 up-regulated
miRNAs and 94 down-regulated miRNAs, and a
total of 374 miRNAs were identified in breast
cancer cells, including 121 up-regulated
miR-NAs and 253 down-regulated miRmiR-NAs. Wherein,
a total of 10 miRNAs were up-regulated with
HER-2 overexpression in MCF-7 cells, and do-
wn-regulated with HER-2 intervention in BT474
cells synchronously, and 17 miRNAs were do-
wn-regulated with HER-2 overexpression in
MCF-7 cells, and up-regulated with HER-2
inter-vention in BT474 cells synchronously, and
pro-vided a significantly reference on liquid biopsy
of breast cancer cells.
Breast cancer has been became a leading type
cancer of women with a high incidence and a
high mortality [15, 42, 43], and about 40,450
women in the U.S. died in 2015 from breast
cancer, and will be increasing day by day in the
future [16, 17]. In breast cancer patients, with
the aggravation of the disease, the HER-2 often
over-expressed, and implied a significant bio
-marker for breast cancer diagnosis in clinic,
and however the differential expression profile
of miRNAs in breast cancer cells has been no
reported so far. Therefore, the MCF-7 cells and
its stable strain with HER-2 overexpression
were chosen, and the HER-2 mRNA and protein
expression level was analyzed. After
transfec-Table 6.
The primers used for amplification of miRNAs in this study
miRNA Sequence of primers (5’→3’)
hsa-miR-877-3p-frs ACACTCCAGCTGGGTCCUCTTCTCCCT
hsa-miR-877-3p-rvs CTCAACTGGTGTCGTGGAGTCGGCAATTCAGTTGAGCTGGGAGG
tion, the HER-2 could significantly express in
MCF-7 cells, and subsequently subcellular
location indicated it was mainly located in the
cell membrane as previous study described
(Data was not provided). In addition, to
knock-down the endogenous HER-2 gene, the BT474
cell strain with HER-2 gene expression was
chosen. After transfection, the HER-2 could
sig-nificantly knockdown in BT474 cells.
miRNAs are a kind of no-coding RNA with length
of 19-25 nt, and could be down-regulated the
target gene expression in transcription and
translation level, and as several previous
stud-ies documented, some miRNAs may be closely
associated with HER-2 in breast cancer
patients [28, 44, 45]. For instance,
hsa-miR-205 and has-miR-497 could significantly
inhibit the expression of HER-2 to intervene the
invasion and the tumorigenicity of breast
can-cer [34, 46], and the over-expressed
hsa-miR-125a/hsa-miR-125b could inhibited the
activi-ty of HER-2 over-expressed breast cancer cells
[35], etc. In this study, several differential ex-
pression miRNAs were identified, and indicated
that with the over-expression of HER-2, a total
of 217 miRNAs containing 123 up-regulated
miRNAs and 94 down-regulated miRNAs were
significantly changed, and also with the inter
-vention of HER-2, a total of 374 miRNAs
con-taining 121 up-regulated miRNAs and 253
down-regulated miRNAs were significantly
[image:21.612.94.523.76.428.2]miR-877-3p, was chosen, and detected by
RT-qPCR. In accordance with gene-chip results
demonstrating, the expression of
hsa-miR-877-3p was significantly decreased with HER-2 gene
over-expression, and significantly increased
with HER-2 intervention, and involved in several
biological process as GO and KEGG pathway
analysis.
This study using miRNA gene-chip screened
several significantly miRNA in breast cancer
cells after HER-2 overexpression and
interven-tion, and implied several potentially regulated
process of miRNA to HER-2, and exhibited a
sig-nificant application value in clinic.
Acknowledgements
This research project was sponsored by the
National Natural Science Foundation of China
(Grant No. 81372476). Thanks to the technical
support of Dr. Li Wei from the University College
London.
Disclosure of conflict of interest
None.
Address correspondence to: Drs. Zhengsheng Wu and Qiang Wu, Department of Pathology, Anhui Medical University, Hefei 230032, Anhui, China. Tel: +86-13965012315; E-mail: [email protected] (ZSW); Tel: +86-13866714496; E-mail: aydjohn@ yahoo.com (QW)
References
[1] Mauro GP, de Andrade Carvalho H, Stuart SR, Mano MS and Marta GN. Effects of locoregion-al radiotherapy in patients with metastatic breast cancer. Breast 2016; 28: 73-78. [2] Bedognetti D, Maccalli C, Bader SB, Marincola
FM and Seliger B. Checkpoint inhibitors and their application in breast cancer. Breast Care (Basel) 2016; 11: 108-115.
[3] Han Y, Sun S, Zhao M, Zhang Z, Gong S, Gao P, Liu J, Zhou J, Ma D, Gao Q and Wu P. CYC1 predicts poor prognosis in patients with breast cancer. Dis Markers 2016; 2016: 3528064. [4] Garcia-Fernandez A, Barco I, Fraile M, Lain JM,
Carmona A, Gonzalez S, Pessarrodona A, Gimenez N and Garcia-Font M. Factors predic-tive of mortality in a cohort of women surgically treated for breast cancer from 1997 to 2014. Int J Gynaecol Obstet 2016; 134: 212-216. [5] Denkert C and Schutz F. Immunological
mech-anisms in breast cancer - from bench to bed-side. Breast Care (Basel) 2016; 11: 93-94.
[6] Feiten S, Dunnebacke J, Friesenhahn V, Hey -manns J, Koppler H, Meister R, Thomalla J, van Roye C, Wey D and Weide R. Follow-up reality for breast cancer patients - standardised sur-vey of patients and physicians and analysis of treatment data. Geburtshilfe Frauenheilkd 2016; 76: 557-563.
[7] Thill M, Pisa G and Isbary G. Targets for neoad-juvant therapy - The Preferences of patients with early breast cancer. Geburtshilfe Frauen-heilkd 2016; 76: 551-556.
[8] Marchese A, Barbieri R, Pesce M, Franchelli S and De Maria A. Breast implant infection due to Paenibacillus residui in a cancer patient. Clin Microbiol Infect 2016; 22: 743-4.
[9] De Marchi T, Foekens JA, Umar A and Martens JW. Endocrine therapy resistance in estrogen receptor (ER)-positive breast cancer. Drug Dis-cov Today 2016; 21: 1181-1188.
[10] Kwa M, Plottel CS, Blaser MJ and Adams S. The intestinal microbiome and estrogen receptor-positive female breast cancer. J Natl Cancer Inst 2016; 108.
[11] Holst F. Estrogen receptor alpha gene amplifi -cation in breast cancer: 25 years of debate. World J Clin Oncol 2016; 7: 160-173.
[12] Piasecka D, Skladanowski AC, Kordek R, Ro-manska HM and Sadej R. [Aspects of proges-terone receptor (PR) activity regulation - im-pact on breast cancer progression]. Postepy Biochem 2015; 61: 198-206.
[13] Mohammed H, Russell IA, Stark R, Rueda OM, Hickey TE, Tarulli GA, Serandour AA, Birrell SN,
Bruna A, Saadi A, Menon S, Hadfield J, Pugh M, Raj GV, Brown GD, D’Santos C, Robinson JL,
Silva G, Launchbury R, Perou CM, Stingl J, Cal-das C, Tilley WD and Carroll JS. Corrigendum: Progesterone receptor modulates ERalpha ac-tion in breast cancer. Nature 2015; 526: 144. [14] Mohammed H, Russell IA, Stark R, Rueda OM,
Hickey TE, Tarulli GA, Serandour AA, Birrell SN,
Bruna A, Saadi A, Menon S, Hadfield J, Pugh M, Raj GV, Brown GD, D’Santos C, Robinson JL,
Silva G, Launchbury R, Perou CM, Stingl J, Cal-das C, Tilley WD and Carroll JS. Progesterone receptor modulates ERalpha action in breast cancer. Nature 2015; 523: 313-317.
[15] Asif HM, Sultana S, Ahmed S, Akhtar N and Tariq M. HER-2 positive breast cancer - a mini-review. Asian Pac J Cancer Prev 2016; 17: 1609-1615.
[16] Jonjic N, Mustac E, Tomic S, Razumovic JJ,
Sarcevic B, Blazicevic V, Labinac LP, Svagelj D, Kopjar A, Sikic NL, Vrbicic B and Boric I. Inter -laboratory concordance in Her-2 positive breast cancer. Acta Clin Croat 2015; 54: 479-485.
role of HER-2 in breast cancer. J Surg Sci 2014; 2: 4-9.
[18] Li MH, Hou CL, Wang C and Sun AJ. HER-2, ER, PR status concordance in primary breast can-cer and corresponding metastatic lesion in lymph node in Chinese women. Pathol Res Pract 2016; 212: 252-257.
[19] Nishimura R, Okamoto N, Satou M, Kojima K and Tanaka S. HER 2 immunohistochemistry for breast cancer cell blocks can be used in the same way as that used for histological specimens. Diagn Cytopathol 2016; 44: 274-279.
[20] Jia H, Jia W, Yang Y, Li S, Feng H, Liu J, Rao N, Jin L, Wu J, Gu R, Zhu L, Chen K, Deng H, Zeng Y, Liu Q, Song E and Su F. HER-2 positive breast cancer is associated with an increased risk of positive cavity margins after initial lumpecto-my. World J Surg Oncol 2014; 12: 289. [21] Kim JY, Jung WH and Koo JS. Expression of
autophagy-related proteins according to an-drogen receptor and HER-2 status in estrogen receptor-negative breast cancer. PLoS One 2014; 9: e105666.
[22] Quintela-Fandino M, Urruticoechea A, Guerra J, Gil M, Gonzalez-Martin A, Marquez R, Her-nandez-Agudo E, Rodriguez-Martin C,
Gil-Mar-tin M, Bratos R, Escudero MJ, Vlassak S, Hil -berg F and Colomer R. Phase I clinical trial of nintedanib plus paclitaxel in early HER-2-nega-tive breast cancer (CNIO-BR-01-2010/GEI-CAM-2010-10 study). Br J Cancer 2014; 111: 1060-1064.
[23] Cao XZ, Xiang HL, Quan MF and He LH. Inhibi-tion of cell growth by BrMC through inactiva-tion of Akt in HER-2/neu-overexpressing breast cancer cells. Oncol Lett 2014; 7: 1632-1638. [24] Singh R, Gupta S, Pawar SB, Pawar RS,
Gand-ham SV and Prabhudesai S. Evaluation of ER,
PR and HER-2 receptor expression in breast cancer patients presenting to a semi urban cancer centre in Western India. J Cancer Res Ther 2014; 10: 26-28.
[25] Garcia-Munoz C, Cortijo-Cascajares S, Cana-mares-Orbis I, Goyache-Goni MP and Ferrari-Piquero JM. [Lapatinib plus transtuzumab for HER-2 positiva metastatic breast cancer: expe-rience of use]. Farm Hosp 2014; 38: 130-134. [26] Liang AL, Zhang TT, Zhou N, Wu CY, Lin MH and Liu YJ. MiRNA-10b sponge: An anti-breast can-cer study in vitro. Oncol Rep 2016; 35: 1950-1958.
[27] Ruiz Esparza-Garrido R, Torres-Marquez ME,
Viedma-Rodriguez R, Velazquez-Wong AC, Sal
-amanca-Gomez F, Rosas-Vargas H and Velazquez-Flores MA. Breast cancer cell line MDA-MB-231 miRNA profile expression after
BIK interference: BIK involvement in autopha-gy. Tumour Biol 2016; 37: 6749-6759.
[28] Zaleska K. miRNA-Therapeutic tool in breast cancer? Where are we now? Rep Pract Oncol Radiother 2015; 20: 79-86.
[29] Lv J, Xia K, Xu P, Sun E, Ma J, Gao S, Zhou Q, Zhang M, Wang F, Chen F, Zhou P, Fu Z and Xie H. miRNA expression patterns in chemoresis-tant breast cancer tissues. Biomed Pharmaco-ther 2014; 68: 935-942.
[30] Mulrane L, McGee SF, Gallagher WM and O’Connor DP. miRNA dysregulation in breast cancer. Cancer Res 2013; 73: 6554-6562. [31] Riaz M, van Jaarsveld MT, Hollestelle A,
Prager-van der Smissen WJ, Heine AA, Boersma AW, Liu J, Helmijr J, Ozturk B, Smid M, Wiemer EA, Foekens JA and Martens JW. miRNA
expres-sion profiling of 51 human breast cancer cell
lines reveals subtype and driver
mutation-spe-cific miRNAs. Breast Cancer Res 2013; 15:
R33.
[32] Vrba L, Munoz-Rodriguez JL, Stampfer MR and
Futscher BW. miRNA gene promoters are fre-quent targets of aberrant DNA methylation in human breast cancer. PLoS One 2013; 8: e54398.
[33] Martin EC, Bratton MR, Zhu Y, Rhodes LV, Tilgh -man SL, Collins-Burow BM and Burow ME. In-sulin-like growth factor-1 signaling regulates miRNA expression in MCF-7 breast cancer cell line. PLoS One 2012; 7: e49067.
[34] Luo Q, Li X, Gao Y, Long Y, Chen L, Huang Y and Fang L. MiRNA-497 regulates cell growth and invasion by targeting cyclin E1 in breast can-cer. Cancer Cell Int 2013; 13: 95.
[35] Karbasy SH, Taheriazam A, Mirghasemi A, Sed-aghati F, Shakeri M, Yahaghi E and Bahador R. Upregulation of miR-300 and downregulation of miR-125b act as potential predictor bio-markers in progression, metastasis, and poor prognosis of osteosarcoma. Tumour Biol 2015; [Epub ahead of print].
[36] Zhao D, Sui Y and Zheng X. MiR-331-3p inhib-its proliferation and promotes apoptosis by tar-geting HER2 through the PI3K/Akt and ERK1/2 pathways in colorectal cancer. Oncol Rep 2016; 35: 1075-1082.
[37] Liu XH, Sun M, Nie FQ, Ge YB, Zhang EB, Yin DD, Kong R, Xia R, Lu KH, Li JH, De W, Wang KM and Wang ZX. Lnc RNA HOTAIR functions as a competing endogenous RNA to regulate HER2 expression by sponging miR-331-3p in gastric cancer. Mol Cancer 2014; 13: 92. [38] Epis MR, Giles KM, Barker A, Kendrick TS and
Leedman PJ. miR-331-3p regulates ERBB-2 ex-pression and androgen receptor signaling in prostate cancer. J Biol Chem 2009; 284: 24696-24704.
Genistein-induced mir-23b expression inhibits the growth of breast cancer cells. Contemp Oncol (Pozn) 2015; 19: 32-35.
[40] Jin L, Wessely O, Marcusson EG, Ivan C, Calin GA and Alahari SK. Prooncogenic factors miR-23b and miR-27b are regulated by Her2/Neu, EGF, and TNF-alpha in breast cancer. Cancer Res 2013; 73: 2884-2896.
[41] Fragni M, Bonini SA, Bettinsoli P, Bodei S, Gen-erali D, Bottini A, Spano PF, Memo M and Siga-la S. The miR-21/PTEN/Akt signaling pathway is involved in the anti-tumoral effects of zole-dronic acid in human breast cancer cell lines. Naunyn Schmiedebergs Arch Pharmacol 2016; 389: 529-538.
[42] Breast cancer risk variants affect estrogen re-ceptor. Cancer Discov 2016; 6: OF3.
[43] Alves C, Mendes D, Andrade S and Batel MF.
The benefit of Her-2 targeted therapies on
overall survival of patients with metastatic
breast cancer-a systematic review. Value
Health 2014; 17: A620.
[44] Yang F, Lyu S, Dong S, Liu Y, Zhang X and Wang
O. Expression profile analysis of long noncod -ing RNA in HER-2-enriched subtype breast can-cer by next-generation sequencing and bioin-formatics. Onco Targets Ther 2016; 9: 761-772. [45] Yang F, Wang Y, Xue J, Ma Q, Zhang J, Chen YF,
Shang ZZ, Li QQ, Zhang SL and Zhao L. Effect of Corilagin on the miR-21/smad7/ERK signal-ing pathway in a schistosomiasis-induced
he-patic fibrosis mouse model. Parasitol Int 2016;
65: 308-315.
[46] Wang Z, Liao H, Deng Z, Yang P, Du N, Zhanng
Y and Ren H. miRNA-205 affects infiltration