Software for the Quantification of Glistenings in
Intra-Ocular Lenses
Teeranoot Japunya, Parisut Jitpakdee, Bunyarit Uyyanonvara, Pakinee Aimmanee, Eva Philippaki, Chris Hull,
and Sarah Barman
Abstract—An intraocular lens (IOL) is implanted in the eye after a cataract surgery. When an IOL is in an aqueous environment, glistenings that are fluid-filled microvacuoles are often observed. Previously, studies of glistenings involved te-dious work of manual glistenings labeling and rough estimation of glistening distribution. This paper proposes a software that can be used for automatic glistenings detection. The software evaluates glistenings appearance in a lens, separating the IOL lens into 3 zones and accurately computingthe average area, density and distribution to assist the user. The results are compared with clinicians hand-drawn ground truth for validation. The proposed GUI front-end is easy to use and very suitable for users who want accurate and quick glistenings detection. Numerical results can be achieved without manual drawing and rough estimation.
Index Terms—Medical Image Processing, Intra-Ocular Lens, Medical Software, Software Development, Glistening Detection.
I. INTRODUCTION
A
Following cataract or refractive lens surgery, the crys-talline lens of the human eye is replaced by an artificial intraocular lens (IOL) typically inserted into the capsular bag [1]. When theIOL,is in an aqueous environment, glistenings, which are fluid-filled microvacuoles, can be observed [2], [3], [4], [5], [6], [7]. Many studies report the formation of glistenings although the times of onset can be different [see 2 for a review]. The earliest reported onset of glistenings is one week postoperatively [2].although, in some patients, glistenings were not found up to 6 months post implantation [2]. Irrespective of time of onset, the general trend is for the density of glistenings to increase with time [2], [5], [8]. There are many factors influencing the formation of glistenings, for example change in temperature, IOL material composition, IOL manufacturing technique, IOL packaging [2], [4], [5], [9], [10], [11].Manuscript received March 14, 2014; revised April 9,2014 This work was supported in part by the National Research University Project of Thailand Office of Higher Education Commission (Thammasat University), Thailand Advanced Institute of Science and Technology(TAIST), National Science and Technology Development Agency (NSTDA), Tokyo Institute of Technology, and Sirindhorn International Institute of Technology (SIIT), Thammasat University (TU) under the TAIST Tokyo Tech Program.
Teeranoot Japunya Author is with Thailand Advanced Institute of Science and Technology(TAIST), Sirindhorn International Institute of Technology, Thammasat University, Thailand (e-mail: [email protected]).
Parisut Jitpakdee, Bunyarit Uyyanonvara, Pakinee Aimmanee Authors are with Sirindhorn International Institute of Technology, Thammasat Uni-versity, Thailand (e-mail: [email protected], [email protected], and [email protected], respectively).
Eva Philippaki and Chris Hull Authors are with Applied Vision Research Centre, School of Health Sciences, City University London, Northamp-ton Square, United Kingdom (e-mail: [email protected] and [email protected], respectively).
Sarah Barman Author is with Digital Imaging Research Centre, Faculty of Science, Engineering and Computing, Kingston University, Penrhyn Road, United Kingdom (e-mail: [email protected]).
Glistenings are important because they can affect vision by increasing forward light scatter [12], [13], [14]. The amount of light scatter is likely to be affected by the size, density and location of the glistening. To our best knowledge, no algorithm has been published for glistenings detection although a few studies suggest that other groups have looked at detection using image processing [15].
Exudates are lipids and leakage of proteins [16], [17]. Hard exudates are seen as bright yellow lesions with different sizes, shapes, and locations [16]. Blobs are defined as a brighter or darker region compared with the surrounding area or in the same color in the image or video [18], [19]. The techniques used for the detection of exudates and blobs can be adapted to use as glistenings detection.
In this paper, a collaboration between researchers from Thammasat University in Thailand, Kingston University and City University in London, we propose an effective in-traocular lens glistenings quantification software. This novel software has a user friendly front-end and is designed to semi-automatically detect glistenings. Once detected, the software computes and displays important properties for the user. Its GUI is designed for the convenience of users who are typically clinicians or scientists with little image processing knowledge. The software is built based on Matlab.
The paper is organized as follows: Section 2 briefly describes the procedure for glistenings detection; Section 3 presents a detail of software features; The conclusion and future work are showed in Section 4.
II. PROCEDURE FOR GLISTENINGS QUANTIFICATION
A. Overall Procedure
For the quantification of the glistenings on an IOL, the boundary of the lens is detected. The radius is then calculated and the area of interest is divided into zones. Then glistenings are detected and the software calculates many properties such as area, density and glistenings distribution. The software contains an option to validate the glistenings detection result by comparing with the hand-drawn ground-truth image. The overall procedure is shown in Fig.1.
B. Lens Detection and Zoning
Fig. 1. The procedure of glistenings quantification.
C. Glistenings detection
Image processing techniques are used to detect the glisten-ings. The Sobel operator is employed to detect the edge of the glistenings. The Sobel filter is a mask operation which is a first order differential edge detection. In our method we applied both x and y coordinates and combined the two results into one image. Due to Sobel mask have line of high contrast in the image . The dilation operation is used for connecting broken lines. All gaps as a result of the dilation operation will be filled. After these operations, we get the glistenings area is output but it is combined with other smaller areas as a result of noise in the image.. To post-process, we we use the erosion operator to remove areas which are smaller or larger than our expecting target size.
D. Glistenings Quantification
All detected glistenings will be used in the calculation of its properties, namely, area, distribution and density in all 4 regions:within the whole lens, within the 3mm zone, 4mm zone, and 5mm zone. An area of each microvacuole is a number of pixels detected as glistenings. The average area of each zone is used to compare with the sizes of glistenings. The distribution shows whether glistenings are located on the lens evenly or if most of them are located on certain zones. Then the density of glistenings of each zone is calculated by the summation of the areas of glistenings divided by the area of the zone.
An area of each microvacuole is a number of pixels detected as glistenings. The average area of each zone is used to compare with the sizes of glistenings. The distribution shows whether glistenings are located on the lens evenly or if most of them are located on certain zones. Then the density of glistenings of each zone is calculated by the summation of the areas of glistenings divided by the area of the zone.
E. Result Validation
[image:2.595.317.538.69.208.2]The accuracy, sensitivity and error are used to inspect the performance comparing the glistenings detection result with the ground truth. The glistenings in ground truth images are hand marked in the red color by an expert in glistening (EP), as shown in Fig 3.
Fig. 2. Lens Zoning: 3mm, 4mm, and 5mm zones.
Fig. 3. Example ground truth image. Left hand side:Red marked Glistenings Image and Right hand side:White marked Glistenings.
III. SOFTWARE FEATURES
A user interface that can cope with different images of glistening has been created to allow for their different formation, size, density and position.Its features include IOL image selection and display, lens detection, parameter con-figuration and glistenings detection, ground truth selection, layer selection, quantification result and validation details.
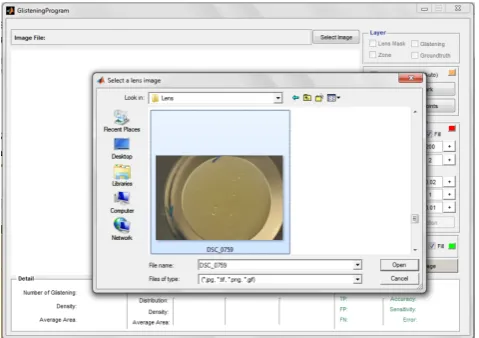
A. IOL Image Selection and display
The user can select the IOL image by opening the image file. The IOL image can be 4 types: JPG, TIFF, PNG, or GIF.
[image:2.595.308.544.267.346.2] [image:2.595.307.547.595.764.2]Fig. 5. IOL Image Showing Examples.
Fig. 6. IOL image and its lens mask.
B. Lens Detection
[image:3.595.306.546.315.485.2]Before theglistenings detection process can be applied, we need to specify the region of the lens. This front-end includes 2 ways to identify the boundary of the lens. First, the user can load the lens mask by selecting the lens mask image file where the white area is the region of interest of the lens. Fig. 6 shows the example of the IOL image and its lens mask image. If the user doesnt have a mask, the user can create a mask semi-automatically by specifying 5 different locations on the lens boundary. The lens mask area is then created by the program and shown on the screen. Fig. 7 shows the example of lens mask creation by clicking on the IOL image 5 times.
C. Glistenings detection
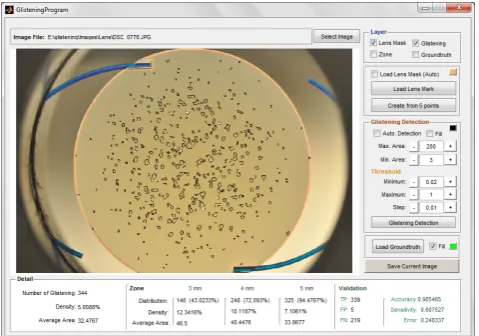
In the glistenings detection part of the software, the user can adjust many parameters for a variety of glistenings image input. There are 5 variables in this part consisting of Maximum area of glistenings (Max. area), Minimum area of glistenings (Min. area), Minimum Threshold, Maximum Threshold and step. The user can choose the color of the glistenings and choose to show only the boundary line or the glistenings area filled with color. Fig. 8 shows the example of the glistenings area filled with color and Fig. 9 shows an example of the glistenings boundary line and lens mask line.
D. Ground truth Selection (for development phase)
During the program validation phase, the user can load a ground truth image and compare it with the automatic glistenings detection result. Specificity and Sensitivity will be automatically calculated.
Fig. 7. 5 points clicking to create lens mask.
[image:3.595.307.547.565.733.2]Fig. 8. Screen of program, shows filled-glistenings, lens mask and zone boundaries.
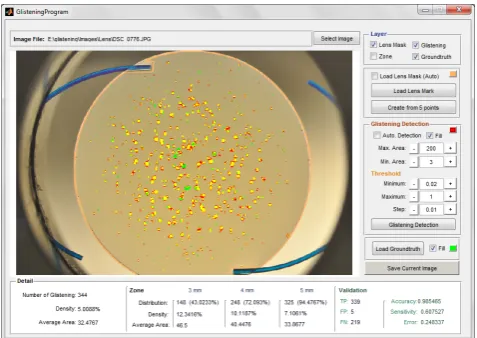
Fig. 10. Screen of program, shows the comparison of detected glistenings and the ground truth.
Fig. 11. Screen of program, shows the filled-glistenings from ground truth and zone boundary.
E. Layer Selection
The user can select the layers to be shown on the IOL image. There are 4 layers; Lens Mask, Zone, Glistenings, and Ground truth. The example of the comparing of detected glistenings, ground truth area and lens mask are shown in Fig. 10 and the filled-glistenings from ground truth and zone boundary are shown in Fig. 11.
F. Image Saving
A Save Current Image button is also added to help the user save the current processed image.
G. Quantification results
The results of the glistenings detection is shown on the Quantification Detail The Overall result is shown on the left hand side of the screen for easy access. The results consist of the number of glistenings, density and average area. The next panel shows results from each zone of the IOL lens. The results show the distribution, density and average area of each zone.
H. Validation Result
The accuracy and sensitivity are used to compute front-end performance. The accuracy is the result of the correct
result divided by the total number of classifications and sensitivity is the result of the true positive and the condition negative. After the user choses a ground truth image, the true positive (TP), false positive (FP), false negative (FN), accuracy, sensitivity and error are be shown on the right hand side of the detail section.
IV. CONCLUSION & FUTURE WORK
This paper proposed a software that is designed to detect glistenings and accurately compute important properties for the user. Glistenings detection results along with its proper-ties are shown on the screen, and comfortably help the user to analyze glistenings in real time. Its GUI is simplified for the convenience of users, so that even a first time user can find it easy to use. The software is built based on Matlab. It has an easy-to-use GUI and a semi-automatic algorithm to detect and quantify the glistenings. It is suitable for users who want accurate and quick glistenings detection. Numerical results can be achieved without manual drawing and rough estimation.
There are still limitations on the currently proposed soft-ware that need to be developed. The size of the IOL is considered as standard at 6mm while there are IOLs in the market with different diameters. In the case of glistenings overlapping, the software is still weak to distinguish this feature.
For future work, we will focus on the efficient algorithm for glistenings detection. We intend to develop a new tech-nique which is more accurate and effective.
ACKNOWLEDGMENT
We would like to thank the Applied Vision Research Centre, School of Health Sciences, City University London, for the IOL images and ground truth data.
REFERENCES
[1] R. Bellucci, “An introduction to intraocular lenses:material, optics, haptics, design and aberration,” 2013.
[2] L. Werner, “Glistenings and surface light scattering in intraocular lenses,” Journal of Cataract & Refractive Surgery, vol. 36, no. 8, pp. 1398 – 1420, 2010. [Online]. Available: http://www.sciencedirect.com/science/article/pii/S0886335010008308 [3] K. Hayashi, A. Hirata, M. Yoshida, K. Yoshimura, and H. Hayashi,
“Long-term effect of surface light scattering and glistenings of intraocular lenses on visual function,”American Journal of Ophthal-mology, vol. 154, no. 2, pp. 240 – 251.e2, 2012. [Online]. Available: http://www.sciencedirect.com/science/article/pii/S0002939412002024 [4] D. Tognetto, L. Toto, G. Sanguinetti, and G. Ravalico, “Glistenings
in foldable intraocular lenses,” Journal of Cataract & Refractive Surgery, vol. 28, no. 7, pp. 1211 – 1216, 2002. [Online]. Available: http://www.sciencedirect.com/science/article/pii/S0886335002013536 [5] N. Mamalis, “Intraocular lens glistenings,”
Jour-nal of Cataract & Refractive Surgery, vol. 38, no. 7, pp. 1119 – 1120, 2012. [Online]. Available: http://www.sciencedirect.com/science/article/pii/S088633501200675X [6] J. Colin, I. Orignac, and D. Touboul, “Glistenings in a large series of hydrophobic acrylic intraocular lenses,”
Journal of Cataract & Refractive Surgery, vol. 35, no. 12, pp. 2121 – 2126, 2009. [Online]. Available: http://www.sciencedirect.com/science/article/pii/S0886335009007822 [7] U. Gunenc, F. Oner, S. Tongal, and M. Ferliel, “Effects on
[8] J. Colin, D. Praud, D. Touboul, and C. Schweitzer, “Incidence of glistenings with the latest generation of yellow-tinted hydrophobic acrylic intraocular lenses,”Journal of Cataract & Refractive Surgery, vol. 38, no. 7, pp. 1140 – 1146, 2012. [Online]. Available: http://www.sciencedirect.com/science/article/pii/S0886335012004762 [9] K. Kato, M. Nishida, H. Yamane, K. Nakamae, Y. Tagami,
and K. Tetsumoto, “Glistening formation in an acrysof lens initiated by spinodal decompositionof the polymer network bytemperature change,” Journal of Cataract & Refractive Surgery, vol. 27, no. 9, pp. 1493 – 1498, 2001. [Online]. Available: http://www.sciencedirect.com/science/article/pii/S0886335001008951 [10] N. Z. Gregori, T. S. Spencer, N. Mamalis, and R. J. Olson,
“In vitro comparison of glistening formation among hydrophobic acrylic intraocular lenses,”Journal of Cataract & Refractive Surgery, vol. 28, no. 7, pp. 1262 – 1268, 2002. [Online]. Available: http://www.sciencedirect.com/science/article/pii/S0886335002012245 [11] T. Oshika, Y. Shiokawa, S. Amano, and K. Mitomo, “Influence of
glistenings on the optical quality of acrylic foldable intraocular lens,”
British Journal of Ophthalmology, vol. 85, no. 9, pp. 1034–1037, 2001. [Online]. Available: http://bjo.bmj.com/content/85/9/1034.abstract [12] E. Mnestam and A. Behndig, “Impact on visual function from light
scattering and glistenings in intraocular lenses, a long-term study,”
Acta Ophthalmologica, vol. 89, no. 8, pp. 724–728, 2011. [Online]. Available: http://dx.doi.org/10.1111/j.1755-3768.2009.01833.x [13] K. Hayashi, A. Hirata, M. Yoshida, K. Yoshimura, and H. Hayashi,
“Long-term effect of surface light scattering and glistenings of intraocular lenses on visual function,”American Journal of Ophthal-mology, vol. 154, no. 2, pp. 240 – 251.e2, 2012. [Online]. Available: http://www.sciencedirect.com/science/article/pii/S0002939412002024 [14] M. van der Mooren, L. Franssen, and P. Piers, “Effects
of glistenings in intraocular lenses,” Biomed. Opt. Express, vol. 4, no. 8, pp. 1294–1304, Aug 2013. [Online]. Available: http://www.opticsinfobase.org/boe/abstract.cfm?URI=boe-4-8-1294 [15] C. J and O. I, “Glistenings on intraocular lenses in healthy eyes:
effects and associations,” Journal of Refractive Surgery (Thorofare, N.J. : 1995), pp. 869–875, 2011.
[16] D. Youssef, N. Solouma, A. El-dib, M. Mabrouk, and A.-B. Youssef, “New feature-based detection of blood vessels and exudates in color fundus images,” inImage Processing Theory Tools and Applications (IPTA), 2010 2nd International Conference on, July 2010, pp. 294– 299.
[17] H. Jaafar, A. Nandi, and W. Al-Nuaimy, “Detection of exudates in retinal images using a pure splitting technique,” in Engineering in Medicine and Biology Society (EMBC), 2010 Annual International Conference of the IEEE, Aug 2010, pp. 6745–6748.
[18] L. Wang and H. Ju, “A robust blob detection and delineation method,” inEducation Technology and Training, 2008. and 2008 International Workshop on Geoscience and Remote Sensing. ETT and GRS 2008. International Workshop on, vol. 1, Dec 2008, pp. 827–830. [19] Z. Qiu, L. Yang, and W. Lu, “A new