1. L
EG
199 S
UMMARY
1Shipboard Scientific Party
2ABSTRACT
Ocean Drilling Program (ODP) Leg 199, “The Paleogene Equatorial Transect” (Sites 1215–1222), was designed to study the evolution of the equatorial Pacific current and wind system as Earth went from maxi-mum Cenozoic warmth to initial Antarctic glaciations. The drilling pro-gram was primarily devoted to a transect along the 56- to 57-Ma crust, old enough to capture the Paleocene/Eocene boundary in the basal, more carbonate-rich sediments. The Leg 199 transect extends from a paleolatitude of ~4°N–~4°S to encompass a relatively thick lower Eocene sediment section perhaps 8° north of the paleoequator. One site (1218) was also drilled on ~40-Ma crust to collect a near-equatorial sediment sequence from the middle Eocene to the Oligocene in order to investigate the transition in global climate from the Eocene “green-house” to Oligocene “icehouse.”
The Pacific plate has drifted northward through Cenozoic time trans-porting biogenic sediments deposited under the high-productivity equatorial belt into a zone of extremely slow sediment (red clay) accu-mulation. Thus, the central tropical North Pacific Ocean is an ideal re-gion in which to sample shallowly buried Paleogene sequences of equa-torially deposited biogenic sediments. The thin Neogene cover of red clay in the area means that the entire Paleogene sediment section is po-tentially drillable by ODP advanced piston coring and extended core barrel methods.
1Examples of how to reference the
whole or part of this volume.
2Shipboard Scientific Party
addresses.
BACKGROUND AND OBJECTIVES
Upwelling, Productivity, and Equatorial Sedimentation
The complex system of equatorial currents is one of the most persis-tent and clear traces of wind-driven circulation in the oceans. The Leg 199 drilling program (Fig. F1; Table T1) was designed to study the evo-lution of this system in the Pacific Ocean as Earth went from maximum Cenozoic warmth to initial Antarctic glaciations. In the Neogene, the northern position of the Inter-tropical Convergence Zone (ITCZ) rela-tive to the equator has given rise to tradewind-induced divergence at the equator and has caused a narrow band of equatorial upwelling (Fig.
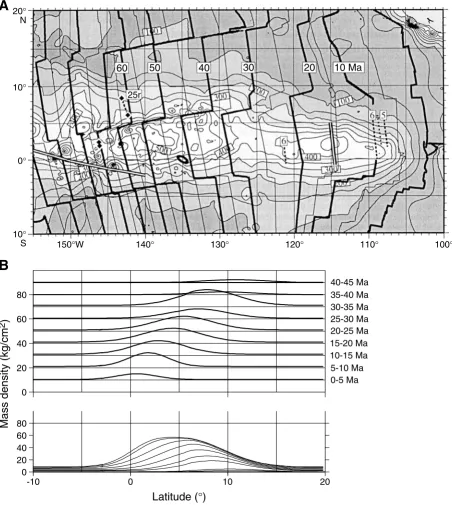
F2) as well as an equatorially asymmetric zonal current system. High productivity associated with equatorial upwelling results in a high rain of biogenic debris to the seafloor within 1.5°–2° of the geographic equa-tor, with peak values restricted to an even narrower zone. In the Pacific Ocean, this biogenic rain has built, over Neogene time, a mound of al-most pure calcareous and siliceous sediments stretching along the equa-torial region and reaching a thickness of >500 m (Fig. F3). The little that we knew about Paleogene sequences in the central tropical Pacific Ocean prior to Leg 199 suggested that pre-Oligocene latitudinal pat-terns of sedimentation were significantly different than this narrowly focused Neogene arrangement (Moore et al., 2002). Sedimentation rates in the Eocene appear to be significantly slower than Neogene rates, and the distribution of sediments from seismic reflection profiles appears different than a pattern resulting from a narrow, linear, well-focused source of biogenic sediments along the equator. Ocean Drilling Program (ODP) Leg 199 was designed to collect sediments along a latitudinal transect in order to better understand Eocene and Oligocene sedimenta-tion patterns and thereby reconstruct the dynamics of Eocene bio-geochemical cycles and paleoceanography.
Pacific Plate Movement and the
Cessation of Biogenic Sedimentation
The central equatorial Pacific is unique in the world’s oceans because the path of plate motion carries the linear trace of equatorial upwelling and productivity northward with time (van Andel, 1974). There are two clear implications of this northward plate motion: (1) the thickest part of the Neogene equatorial mound of biogenic sediment is displaced sev-eral degrees to the north of the equator and (2) sediments deposited a few tens of millions of years ago have moved completely out of the re-gion of high sediment flux. In principle, this set of circumstances pre-sents an excellent opportunity to recover relatively undisturbed sedi-ments through climatologically and paleoceanographically important time intervals that are notorious for extensive chert formation (e.g., the middle Eocene) thus grossly undersampled in the deep oceans.
Despite the high quality of plate tectonic models, the path of move-ment of the Pacific plate is still not perfectly understood, and it is not yet possible for us to backtrack drill sites to their paleopositions in the early Eocene with confidence. Therefore, paleomagnetic studies aimed at locating our drill sites with respect to the Eocene equator were an portant component of the Leg 199 shipboard science. An equally im-portant aim of the shipboard paleomagnetic program was to cross-calibrate geomagnetic reversal stratigraphy with biostratigraphy. In fact,
160°W 150° 140° 130°
0°
10°
20°
30°
N
0 500 1000 Site 1215 Site 1216 Site 1217 Site 1218 Site 1219 Site 1220 Site 1221 Site 1222 Site 40 Site 42 Site 43 Site 69 Site 70
Site 71 Site 72 Site 160 Site 161 Site 162 Site 163 Site 573 Site 574 Site 575 Honolulu
Leg 199 sites DSDP sites Molokai F.Z.
Clipperton F .Z. Clarion F.Z.
Site 1216 Site 1217 Site 1218 Site 1222 Site 1221 Site 1220 Site 1215 Molokai Fractu re Zone
Clarion Fracture Zone Mahi M
ahi Fracture Zone
Site 1219
Clipperton Fracture Zone
574 573 575 161 162 163 40 42 43 70 71 72 0° 10° 20° 5° 15° 25° N 150°W 145° 140° 135°
A
B km
F1. Leg 199 and DSDP drill sites
su-perimposed on bathymetry and Anomaly C25n, p. 52.
T1. Hole summary, p. 86.
F2. Chlorophyll contents in the
Pacific equatorial region, p. 53.
Mass density (kg/cm
2)
-10 0 10 20 Latitude (°)
0-5 Ma 35-40 Ma 30-35 Ma 25-30 Ma 20-25 Ma 15-20 Ma 10-15 Ma 5-10 Ma 40-45 Ma 20° N 10° 0° 10°
S 150°W 140° 130° 120° 110° 100°
60 50 40 30 20 10 Ma 25r 0 20 40 60 80 0 20 40 60 80 A B
F3. Position, thickness, and mass
the likelihood of recovering sediments with compositional changes linked to orbitally forced insolation variability made the production of astronomically calibrated timescales an important scientific goal for Leg 199.
Early Paleogene Warm Climates
The early Paleogene, particularly the early Eocene (~55–49 Ma), wit-nessed the warmest global climates recorded on Earth in the entire Cen-ozoic, and it has long been appreciated that abyssal ocean-water temperatures were significantly warmer than today (e.g., Shackleton and Kennett, 1975). This observation has led to widespread speculation that these warm temperatures originated through low-latitude water mass formation (e.g., Brass et al., 1982). Yet, this explanation has always posed formidable problems for dynamicists, and recent numerical ex-periments support the alternative, more conservative, view that the warm, abyssal water masses of the Paleocene and Eocene are more likely linked to deepwater formation in high-latitude regions having warmer sea-surface temperatures than today (Bice and Marotzke, 2001). Support is widespread for the view that surface temperatures were warmer in high-latitude oceans (and the interiors of continents) during the early Paleogene (Zachos et al., 1993). Diverse sets of paleontological, sedi-mentary, and geochemical proxy records indicate that, at that time, subtropical to temperate fauna and flora extended to subpolar regions of both hemispheres where continental polar ice sheets were conspicu-ously absent (Shackleton and Kennett, 1975). The surface-temperature regime of the early Paleogene tropics is an ongoing subject of investiga-tion (Bralower et al., 1995; Andreasson and Schmitz, 1998; Pearson et al., 2001), but the very warm temperatures (~12°C) estimated for high latitudes and deep waters mean that there can be little doubt that lati-tudinal temperature gradients during the early Paleogene were substan-tially smaller than today (Crowley and Zachos, 2000). This observation raises an intriguing paleoclimate problem because, if warmer high-lati-tude climates depend on enhanced wind-driven ocean currents or wind-carried heat and moisture to transport heat to the poles, it is diffi-cult to explain how this transport was maintained under the weaker pole-to-equator thermal gradients. Instead, weaker latitudinal tempera-ture gradients should give rise to weaker winds and diminished wind-driven transport. This apparent paradox is a persistent problem in nu-merical general circulation model reconstructions of warm paleocli-mates (Barron and Washington, 1984; Manabe and Bryan, 1985; Sloan and Huber, 2001).
Leg 199 was designed to drill a lower Paleogene transect across the world’s most long-lived wind-driven current structure, which features the confluence of the northern and southern hemispheric winds and has a pattern, strength, and biogenic productivity linked to global cli-mate patterns. The lower Eocene transect was aimed at providing basic records of sediment composition, mass accumulation, plankton com-munities, sea-surface and abyssal temperatures, and paleoproductivity across the paleoequator. These sorts of data are needed in order to assess the stability of the water column, the magnitude of heat transfer out of the tropics, surface ocean circulation, the location and strength of the trade wind belts, and the location of the ITCZ. The location of the ITCZ and the transition from the trade winds to the westerlies can be deter-mined by the changes in the composition and rates of deposition of wind-blown dust, whereas mass accumulation rates (MARs) of biogenic debris can be used to assess the position and the strength of upwelling zones. Stable carbon isotope data will be used to assess nutrient flows in the water column and to constrain the global carbon cycle.
General Circulation Model Reconstructions
Model reconstructions of the Eocene climate have been hampered by a severe lack of data to constrain marine boundary conditions and, un-til recently, the need to specify either the atmospheric or oceanic part of the heat transport equation. In addition, lack of adequate control on bathymetry and topography in the Eocene, particularly in ocean gate-way regions, severely weakens the capacity to model climate accurately from first principles (Deconto et al., 2000). Finally, computational con-straints generally force the number of model years to be short (a few thousand years or less) so long-term transitions cannot be easily mod-eled. Most paleoclimate modeling is, therefore, performed on time slices for which reasonable initial conditions are established. In order to adequately understand Paleogene ocean dynamics and climate, there must be a strong interaction between paleoceanographers who gather new observations and climate modelers who make use of them to de-velop more realistic models (Sloan and Huber, 2001; Huber and Sloan, 2000).
One recent development in paleoclimate modeling is the application of coupled, ocean-atmosphere, global circulation models (e.g., Huber,
this volume, and references therein). These types of models produce physically consistent worlds and can be used to study ocean-atmosphere interactions rather than to specify them. An example of the results of such modeling can be seen in Figure F4 with the estimated 56-Ma paleopositions of the Leg 199 drill sites superimposed. The figure shows annual upwelling velocity and indicates that the eastern Pacific should have been a relatively productive region, with respect to much of the world ocean, in the early Eocene.
Paleoceanographic Time Slices
We have known for many years that the early Paleogene, particularly the early Eocene (~55–49 Ma), represents the most extreme long-lived interval of global warming witnessed on Earth since the well-documented mid-Cretaceous greenhouse (e.g., Shackleton and Kennett, 1975; Wilson and Norris, 2001). Yet little is known about the number of constituent hyperthermals, the range of temperatures, or their effects on biotic evolution (Thomas and Zachos, 1999). Similarly, although we
Huber
10°
20°
30°
0°
10°
20°
30°
12191220 1221 12221217 1216 1215
120° 0°
120°
F4. Sites along the 56-Ma Leg 199
know that the Eocene greenhouse period was followed by a long shift toward lower temperatures and ice sheet growth into the late Eocene– Oligocene, the detailed history of these events and consequences for oceanic and atmospheric circulation, carbon cycling, and biotic evolu-tion are only vaguely understood. The late Eocene is also interesting with respect to the response of global climate and biodiversity to the history of large impact extraterrestrial bodies on Earth. Thus, the Paleo-gene can be thought of as containing numerous critical time slices that provide an excellent opportunity to improve our understanding of im-portant paleoclimatic problems involving the dynamics of greenhouse gas release, warm climate stability, biotic turnover associated with ex-treme climate transitions, extraterrestrial impacts, and initiation of ma-jor continental ice sheets.
Paleocene/Eocene Boundary
It is now well accepted that a substantial (~5°–7°C) warming in the Southern Ocean and subtropics, a 35%–50% extinction of deep-sea benthic foraminifers, and rapid perturbation to the global geochemical carbon cycle took place across the Paleocene/Eocene (P/E) boundary (e.g., Kennett and Stott, 1991; Zachos et al., 1993; Koch et al., 1992). A growing body of evidence attributes these events to the massive release and oxidation of methane from the marine gas hydrate reservoir (e.g., Dickens et al., 1997; Katz et al., 1999). High-resolution stable-isotope records (Bains et al., 1999) and orbitally tuned chronologies from sites in the Atlantic and off Antarctica (Norris and Röhl, 1999) suggest that carbon release occurred extremely rapidly (within one precession cy-cle). Thus, the P/E boundary event may represent the best example in the geologic record of the response of Earth’s ocean-atmosphere climate system to greenhouse warming on a timescale approaching that of the ongoing global anthropogenic experiment. Recently, elevated barium accumulation rates have been reported across the P/E boundary in various deep-sea sites. These data have been interpreted in terms of en-hanced deposition of organic matter in deep-sea sediments that may have acted as a negative feedback on atmospheric CO2 levels and global
temperatures to return Earth to average late Paleocene conditions (Bains et al., 2000). Alternatively, this signal may reflect increased ocean barite saturation levels possibly driven by the injection of barium into the global ocean from the marine gas hydrate reservoir (Dickens et al., 2001).
Eocene–Oligocene Transition
The Eocene–Oligocene transition represents an important point in the shift from the greenhouse world of the Cretaceous and early Paleo-gene into the late PaleoPaleo-gene–NeoPaleo-gene icehouse. Attempts to estimate global ice volumes from deep-sea benthic δ18O records have prompted
very different conclusions as to the timing of the onset of the accumu-lation of continental-scale ice sheets. These range from the Early Creta-ceous (Matthews and Poore, 1980) to the middle Miocene (Shackleton and Kennett, 1975). However, recent improvements in the stratigraphic resolution of the δ18O record have led to suggestions that either the late
middle Eocene (~43 Ma) or the earliest Oligocene (~34 Ma) are better es-timates of the timing of the initiation of greenhouse to icehouse transi-tion (Shackleton, 1986; Miller et al., 1987, 1991; Zachos et al., 1992). Supporting evidence for this interpretation comes from oceanic records of ice-rafted debris, weathered clay mineral compositions, microfossil assemblages, and sequence stratigraphic analyses (Kennett and Barker, 1990; Browning et al., 1996). Yet, the rarity of complete deep-sea sec-tions across these intervals has limited our understanding of the dy-namics of this important step leading to the modern icehouse world.
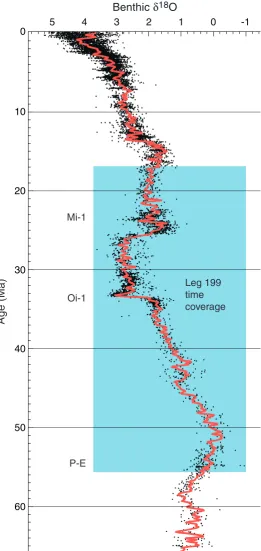
The Eocene–Oligocene transition is marked by a large rapid increase in the benthic foraminiferal calcite δ18O record in earliest Oligocene
time (Oi-1; Fig. F5). This excursion was first ascribed to a 5°C tempera-ture drop associated with the onset of thermohaline circulation, but more recently Oi-1 has been associated with the onset of continental ice accumulation on Antarctica. Such confusion reflects the long-stand-ing difficulty of separatlong-stand-ing the effects of temperature and ice on benthic δ18O. Recent application of an independent paleothermometry
tech-nique, based on Mg/Ca in benthic foraminifers, shows no significant change corresponding to “Oi-1” (Lear et al., 2000). This result suggests that all of the δ18O increase associated with Oi-1 can be ascribed to ice
growth with no concomitant decrease in polar temperatures. Appar-ently, according to these data, the trigger for continental glaciation lay in the hydrological cycle rather than the carbon cycle. Specifically, it has been proposed that the opening of the Australian-Antarctic seaway in earliest Oligocene time might have enhanced the supply of moisture as snow to the Antarctica interior (Lear et al., 2000). Support for this suggestion exists from both ocean drilling and numerical modeling ex-periments (Bartek et al., 1992; Hine et al., 1999). On the other hand, pa-leoproductivity studies suggest that the near-contemporaneous increase in seawater δ13C was driven by increased rates of C
org burial in marine
sediments, and this factor may be implicated in global cooling and ice sheet growth (Diester-Hass and Zahn, 2001). Either way, long-standing global lithologic compilations indicate a pronounced deepening of the CCD associated with the Eocene–Oligocene transition (van Andel et al., 1975) Unfortunately, our most complete records of the Eocene/Oli-gocene (E/O) boundary come from two midlatitude sites (Deep Sea Drilling Project [DSDP] Site 522 and ODP Site 744). Leg 199 offers an excellent opportunity to generate low-latitude records of the Eocene– Oligocene transition and thereby fully evaluate the competing roles played by global cooling and ice growth in the transition from the Cre-taceous greenhouse into the Neogene icehouse.
Oi-1 Mi-1
P-E
Leg 199 time coverage
· ·
· · · ·
··
·· ·
· · ··· ··· ···· ·· · · ··· ·· ··· ··· · ··· · ·· ·· · ··· ··· ···· ··· ··· ··· ···· ··· ··· ··· · ··· · ··· ··· ···· · ·· ·· ··· ·· ··· · ···· · ···· ·· ··· ·· ··· ···· ··· ···· ·· ·· ··· ·· · ···· ·· · ··· ··· · ···· ···· ··· ··· ··· ···· ·· ··· ···· ···· · ··· ·· ·· ··· ··· ·· ··· ·· ·· ·· · ··· ···· ··· ···· ··· ··· · ·
··· ·· ··· ··· ··· ·· ··· ··· ·· · ·· ·· ··· ··· ···· ··· ··· ··· ··· · ·· ·· ·· ··· ···· ···· ··· ·· ···· ··· · · ··· ··· ·· ··· ··· ···· ···· ··· ···· ··· ·· · ·· ·· ··· ··· ··· ··· ···· ··· · ·· ··· ·· ··· · ·· ··· ··· ···· · ··· ···· ··· ··· · ··· ···· · · ···· · ··· ··· ··· ··· · · ··· ··· · ··· ··· ···· ···· ··· ··· ··· ··· ·· ·· ··· ··· · ··· ··· ··· ··· ··· · ··· ·· ··· ··· ··· · ···· ··· ·· ··· · ··· ··· · ·· ·· ··· ··· ·· ··· · ··· ··· ··· ··· ··· · ··· ··· ·· ···· ··· ··· ··· ··· ·· · · ···· · ·· · ···· ··· · ··· ·· ··· ···· ··· ··· ··· ·· ··· ·· · ··· · ··· · ··· ··· ··· ···· ··· ··· ···· ···· · ··· ··· ··· ··· · ··· ··· ··· ··· ··· ··· ·· · ··· ·· ···· ··· ·· ··· · ···· ···· ··· ·· · ··· · ··· ··· ··· · ··· ·· · ··· ···· ··· ··· ·· ·· · ··· ··· ·· · ···· ··· · ··· ··· · ··· ·· · ··· ··· ···· ···· ·· ··· ··· ·· ·· ··· ···· ··· · ···· ·· ·· ··· ··· ··· ···· · · ··· ··· ·· ··· ··· ··· · ···· ··· ··· ··· ·· ·· ··· ···· ··· · ·· ··· ··· ··· ··· ··· ··· ··· ··· ··· ··· ·· ··· · ·· · ···· ···· ··· ·· ··· ···· ·· ·· ·· ··· ·· · ··· ·· ·· ··· ·· ··· ··· ··· ··· · ··· ··· ··· ··· ·· ··· ·· ··· ··· · ··· ··· ·· ··· ··· ·· ··· · ·· ··· ··· ·· · ··· · ·· ··· · ··· · ··· · ·· · ·· ·· ·· · ···· ··· ··· ·· · ··· ··· ··· ·· ··· ·· ···· ···· · ·· ··· ··· ···· ·· ··· · ··· ·· ···· ·· ··· ·· ·· ··· ···· ·· ··· ··· ··· · · ···· · ··· ·· ··· · ··· ··· ···· ··· ···· · · ··· ·· · ···· ··· ···· ··· ··· ·· · ···· · ··· ··· · ··· ··· ··· ·· · ··· ··· ···· ··· ·· ·· ··· ··· ·· ···· ··· ··· · ·· ·· · ··· ··· ···· ··· ·· ··· ··· ·· ··· ··· ··· ··· ··· ···· ··· ··· · · ··· ··· ·· ··· · ··· ··· ···· ·· ··· · ··· ·· ···· ··· ·· ··· ··· ··· ··· ··· ··· ··· ···· ··· ··· ··· ··· ··· ··· ··· ··· ··· ··· ··· ··· ·· ·· ··· ···· ·· ··· ···· ·· · ··· ··· ··· ···· · ··· ···· ·· ·· · ··· ··· ··· · ···· · ···· ···· ··· ··· ·· ···· · ··· ··· ··· ··· · ··· ··· ··· · ·· ·· · ···· ··· · ··· ··· ··· ·· · ··· ··· ··· ··· ··· ··· ·· ··· ·· · ··· ··· ·· · ··· ··· ·· ···· ··· ··· ··· ··· ·· ··· ··· ·· ·· ·· ··· ·· · ··· ··· · ··· ··· · ··· ··· · · ··· · ··· ·· ··· ··· ··· · ···· ···· ··· ···· ···· ··· ·· ·· · ·· ·· ·· ··· ···· ··· ··· ·· ··· ···· ·· ··· ··· ··· ··· ·· ··· ··· ··· ··· ··· ···· ··· ·· ··· ·· ··· ··· ··· ···· ··· ··· ··· ···· ···· ··· ·· ··· ·· · ··· ·· ··· ··· ··· · ·· ···· ···· ··· ···· ·· ··· ···· ···· ··· ··· ·· ··· · ···· ·· ·· ·· ··· ··· ···· ··· ··· ··· · ··· ··· ·· ··· ···· ···· · ··· ··· ···· ··· · ·· ··· ···· ·· ··· · ·· · ··· ··· ··· ·· ··· ··· ···· ·· ··· ·· ·· ··· ··· ··· ··· ·· ··· ··· ···· ···· ·· ··· ··· ···· · ··· ·· ··· ··· ··· ···· ··· ··· ··· ··· · ··· ··· ·· · ··· ·· · ··· ··· ·· ··· ·· ··· ··· ·· ·· ··· ··· ···· ··· ··· ··· ··· · ··· · ·· ·· ··· ··· ··· ·· ··· ···· ·· ··· · ··· ··· ·· ··· ··· ··· ··· ··· · ·· ··· ··· ·· ··· · ·· ··· ··· ··· ···· ··· ··· ·· ·· ··· ·· · ··· ··· ··· ··· ··· · ·· ··· ··· ··· ··· ··· ··· ··· ·· ·· ···· ··· ··· ··· ··· ··· ··· ··· ·· ···· ··· ··· ·· ·· ··· · ··· · · ·· ··· ·· ··· ·· ·· ··· · ·· · ·· ···· ·· ·· ··· · ···· ···· ···· ··· ··· ·· ··· ·· ··· ··· ···· ··· · ··· ··· ··· ···· ·· ··· ··· ···· ··· ··· ·· ·· ···· ··· ··· ··· ··· ·· ··· ··· ···· ··· ·· ··· · ···· ··· ···· ··· · ··· ·· · ··· ·· ·· ··· ···· ··· · ··· · ···· · ··· ··· · ··· ··· ···· ··· ·· ··· ··· ··· ··· ·· ··· ···· ··· ···· ···· ··· ··· ··· ··· ·· ··· ··· ·· ··· ··· ·· ··· ··· ··· ··· ···· · ··· ···· · ··· ·· ·· · ···· ··· ··· ···· ··· ·· ··· ··· ··· ··· · ·· ·· ··· ·· ·· ··· ··· ·· ·· ··· ·· ···· ··· ··· ··· ·· ··· ··· ··· ··· ··· ··· ··· ···· ··· ··· ··· ·· ·· ··· ·· ··· · ··· ·· · ·· ··· ·· ··· ··· ··· ·· ··· · ··· ··· ·· · ··· · ·· · ··· ··· ·· ···· ··· ··· · ···· · ·· · ···· · ··· ··· ··· ·· ···· ·· ·· ···· ··· ···· ·· ··· ··· ··· ·· ··· ···· ·· ··· ··· · ··· ··· ·· ·· ··· ··· ··· ··· ··· ··· ·· ··· ··· · ···· ··· · ·· ··· ··· ··· ··· ···· ··· ··· · ··· ·· ·· · ··· ··· ··· · ··· · ··· ··· ·· ··· ··· ·· ···· ··· ··· ···· ··· ··· ···· ··· ·· ··· ··· · ··· ··· ··· ···· · ··· ···· ·· ··· ·· ···· ··· ··· ··· ··· ··· ··· ·· ·· ··· ··· · · ·· ·· ··· ··· ··· ··· ··· ··· · ·· ··· ··· ··· · ··· ··· ···· ··· ·· ··· ·· ··· ··· ··· ··· · ··· ··· ·· ·· ··· ··· ·· · ··· ··· ··· ···· ·· ··· ··· ··· ·· ··· · ·· ··· ··· ···· ··· ··· ··· ··· ·· ··· ···· · ··· ··· ··· ···· ··· ··· ··· ··· ··· ··· ···· ··· ··· ··· ··· ··· ··· ··· ··· · ··· · ·· ···· ··· ··· · ··· ···· · ··· ···· ··· ··· ··· ·· · ··· ·· ··· ··· ··· · ··· ··· ··· ·· ·· ··· ···· ···· ··· ···· ··· ··· ··· ··· ·· ··· ··· ··· ··· ···· · ··· ··· · ··· ·· ··· ·· · ··· ··· ··· ··· ··· · ··· ··· ··· ···· ··· ··· ··· ··· ···· ··· ··· ··· ·· ··· ··· ··· · ··· ···· ··· ··· ··· ··· ··· ··· ··· ··· ·· ·· ·· · ··· · ··· ·· ··· · · ··· ··· ·· ··· ··· ·· ··· ···· · ···· ··· ··· ··· · ··· ··· ··· · ·· ··· ···· ·· ···· ··· ··· ··· ··· ··· ··· ··· ··· ·· ··· ··· ··· ···· ··· ·· ··· · ··· ··· ·· ··· ·· · ··· ··· ··· ·· ···· ··· · ·· ··· ··· ·· ··· ·· ··· ···· ··· ··· ··· ··· ·· ··· ··· ··· · ··· ··· ··· ··· ··· ··· ··· ·· ··· ···· ·· ··· ··· ·· · ··· ·· ··· ··· ··· ··· · ·· ··· ··· ·· ··· ··· ··· · ··· ··· ···· ·· ··· ··· ··· ···· ···· ···· ·· ··· ··· ···· ··· ·· ··· ··· ··· ··· ·· ··· ··· ··· ·· ··· · · ·· ··· · ··· ··· ··· ···· · ··· ··· · ··· · · ··· ··· ···· ·· ··· ·· ·· ···· ··· · ··· ···· ·· · ··· ···· ·· ·· ··· · ··· ···· ·· ···· ··· ··· ···· ··· · ··· ··· ··· ··· ·· ···· ··· · ··· ···· ·· ··· ···· · ··· ·· ··· ··· ·· · ···· ···· ·· ··· ··· ··· · ··· ···· ··· · ···· · ·· ··· ··· ··· ··· ··· ··· ··· ··· ··· ·· ·· ··· ··· ··· ··· ··· ·· ··· ··· ··· ·· ··· ··· ·· ·· ·· ·· ··· ·· ··· ··· · ·· ··· ···· ··· ···· ··· ··· ·· ···· ··· ··· ··· ··· · ·· ··· ··· · ·· ··· ··· ··· ··· ··· ·· · ··· ·· · ··· ··· ··· ·· · ··· ···· ·· ·· ··· ··· ···· ···· ··· ··· ··· ··· ·· ···· ·· ··· ··· ··· ··· ··· ··· ··· ···· ··· ··· ·· ··· ··· ··· ··· ··· · ·· ··· · ·· · ··· ··· · ··· ··· ··· ···· ··· ··· ··· ··· ··· ·· ··· ··· · ·· ··· ··· ··· ···· ···· ··· ··· ··· ··· ··· ··· · ···· ··· ··· ··· ··· ··· ··· ··· ·· ··· ··· · ···· ··· ··· ··· ···· ··· ·· · ··· ·· ··· ··· ··· ··· · ···· ·· · ··· ··· ··· ··· ··· ···· ··· ··· · ··· ··· ··· ··· ··· ·· ··· ··· ··· · · ··· ·· · ··· · ··· ···· ·· ·· ·· ··· ··· ·· ··· ··· ··· ··· ···· ··· ···· · · ··· · ···· ··· ··· ··· ··· ·· ··· ··· ··· · ·· ··· ··· ··· ··· ·· ··· ·· ··· ·· ··· ·· · ··· ··· ··· ··· · ·· ··· ·· ··· · ··· ··· ··· ··· ··· ··· ··· · ··· ·· ··· ··· ·· ·· · ···· ···· · ··· · ··· · ·· ··· ··· ·· ··· ···· ··· ··· ···· ··· ··· ··· · ··· ··· ···· · ··· ··· ·· ··· ··· ···
Benthic δ18O
Age (Ma)
60 50 40 30 20 10 0
5 4 3 2 1 0 -1
F5. Compilation of benthic
Late Eocene Impact Events
Widespread evidence now exists to support the occurrence of at least two large closely spaced extraterrestrial impact events on Earth during early/late Eocene time. In particular, two large craters (order ~100 km diameter; Chesapeake Bay, North America, and Popigai, northern Sibe-ria) have been proposed to explain impact-ejecta strewn fields that are documented in deep-sea sediments from around the world (e.g., Koe-berl et al., 1996; Bottomley et al., 1997). Proxy records for fine-grained extraterrestrial dust (3He measurements) in correlative marine
carbon-ate strata have been interpreted as evidence for a comet shower trig-gered by an impulsive perturbation of the Oort Cloud (Farley et al., 1998). Intriguingly, unlike the more famous and pronounced precursor extraterrestrial impact event at Cretaceous/Tertiary (K/T) boundary time, biostratigraphic studies indicate that the late Eocene impact hori-zons do not correspond to major extinctions among marine organisms. Only four or five radiolarian species seem to disappear from the record accompanied by modest compositional changes in planktonic foramin-ifers and organic walled dinoflagellate cysts (Sanfilippo et al., 1985; Keller, 1986; Brinkhuis and Biffi, 1993). On the other hand, although little evidence exists in the literature for climate change across the K/T boundary, recent work has suggested that the late Eocene impact event was associated with a short-term (~100 k.y.), albeit modest (maximum 2°C), cooling event at high latitude (Vonhof et al., 2000). Leg 199 pre-sents an ideal opportunity to study the climatic and biotic effects of im-pacts that were too small to precipitate global mass extinctions but were apparently large enough to have engendered regional changes in cli-mate.
Oligocene
Previous Drilling
Nearly 30 yr ago, DSDP rotary drilling and coring of the central Pa-cific equatorial mound of sediments (e.g., DSDP Legs 5, 8, 9, and 16) (Fig. F1) established the general pattern of equatorial sediment accumu-lation and plate migration through the Neogene and late Paleogene (e.g., van Andel et al., 1975; Berger and Winterer, 1974; Leinen, 1979). However, the rotary coring technology available to these early legs could not provide undisturbed sections or complete recovery and was utterly defeated by middle Eocene chert layers encountered in some of the more deeply buried sections. Since these early efforts, one leg (DSDP Leg 85; Mayer et al., 1985) has revisited the region and obtained hy-draulic piston core samples of Neogene sediments. However, the Paleo-gene sections of the Leg 85 holes were rotary cored because they were deeply buried beneath the Neogene equatorial sediment mound. Much of the Paleogene section was not recovered. For these reasons, even the broad outlines of equatorial sediment accumulation in Paleogene sedi-ments and the link of sedimentation to early Paleogene climate remain poorly defined. The P/E boundary interval in the central tropical Pacific Ocean has not been sampled, primarily because the DSDP sites were mostly placed on crust younger than the boundary. DSDP Site 163 (Fig.
F1), on early Campanian-age crust, is the only drill site in the central tropical Pacific that has drilled the interval. Unfortunately, there was poor recovery over the early Eocene caused by closely spaced cherts. The middle Eocene has been sampled at more sites. North of the Clip-perton Fracture Zone, where Leg 199 sites are situated, drilling at DSDP Sites 161 and 162 recovered continuous sediment sequences, albeit with core gaps and disturbed by rotary coring, to middle Eocene basalt crust. Sediments from Sites 40 and 41, between the Clarion and Molo-kai Fracture Zones, were upper to middle Eocene radiolarian oozes be-neath a 10-m-thick layer of red clay.
Leg 199 Objectives
Leg 199 drilling was designed to accomplish the following scientific objectives:
1. To define sedimentation, paleoproductivity, circulation, and wind patterns in the Eocene equatorial Pacific;
2. To study the Paleocene–Eocene and Eocene–Oligocene transitions in the equatorial Pacific as well as other boundaries mentioned above; and
3. To obtain complete, continuous Oligocene and lower Miocene paleoceanographic records to study the effects of glaciation in Antarctica upon equatorial Pacific circulation.
In addition, the following important but more general objectives shaped the Leg 199 drilling plan:
2. To place new constraints on the late Paleocene and early Eocene equatorial position using paleomagnetic and micropaleonto-logic indicators;
3. To link seismic stratigraphy from the site survey to sediment chronostratigraphy in order to extend the Neogene equatorial Pacific seismic stratigraphy (Mayer et al., 1985, 1986; Bloomer et al., 1995) back in time;
4. To document the transition between American and Asian dust sources in order to understand the primary structure of the Pa-leogene wind field;
5. To provide new constraints on the early Paleogene mass balance of carbonate and opal (SiO2) burial and to track the Eocene
movement of the CCD in detail;
6. To generate primary geochemical information needed to under-stand the widespread formation of Eocene cherts; and
7. To collect basal hydrothermal sediment sections for study of hy-drothermal activity in the early Paleogene.
RESULTS
Major Lithologies of the Paleogene Equatorial Pacific
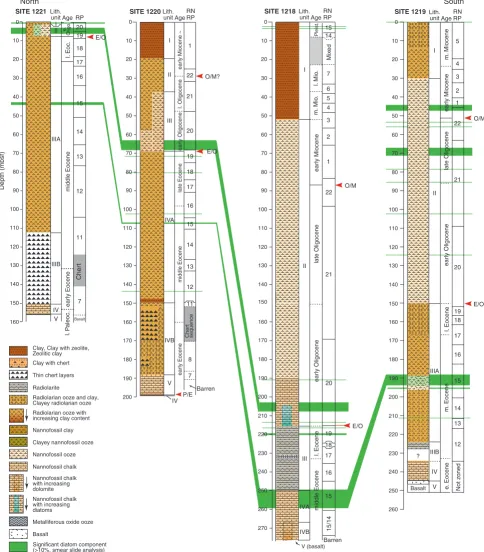
The sediments drilled during the Paleogene equatorial transect fall into the following five broad litho-chronostratigraphic units (Fig. F6): (1) a surficial clay unit, sometimes containing a basal radiolarian ooze with a basal age ranging from the middle Miocene in the south of the transect (Site 1218) to the early–middle Eocene in the north (e.g., Sites 1215 and 1216); (2) a nannofossil ooze/chalk unit whose base is at the E/O boundary and whose top is of early Miocene age in the south (Sites 1218 and 1219) and Oligocene age in the central part of the transect (Sites 1217, 1220, 1221, and 1222); Oligocene–Miocene carbonates are nonexistent in the north (Sites 1215 and 1216); (3) a middle–upper Eocene radiolarian ooze and radiolarian clay that is present at all sites except those in the north (Site 1215 and 1216); (4) a lower middle– lower Eocene unit composed of cherts, clays, and radiolarian ooze that is present in varying thicknesses at all Leg 199 sites along the 56-Ma transect except one in the extreme north (Site 1215); and (5) a lower Eocene–upper Paleocene nannofossil ooze or chalk resting upon basalt basement that is recovered at all sites (except Sites 1216 and 1222 where cherts overlie basement and the relevant stratigraphic interval was not drilled).
Surficial Clay and Radiolarian Ooze
The upper clay unit is composed of wind-blown dust, clays and ra-diolarians eroded and reworked from older sediment outcrops, authi-genic minerals, and (in sites marginal to the modern equatorial region) freshly deposited radiolarians.
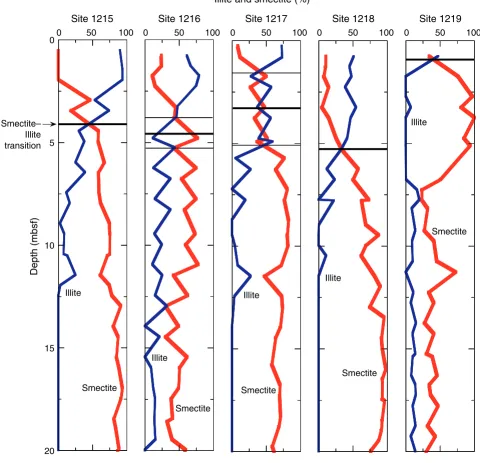
The clay mineral composition of eolian dust transported to Leg 199 sites may provide a way to track the latitudinal position of the ITCZ (Fig. F7). Enhanced precipitation in the ITCZ helps to “wash out” dust particles from the atmosphere, forming an effective barrier to inter-hemispheric dust transport. In other words, dust generated in the Northern Hemisphere is deposited only in latitudes north of the ITCZ. Today, Asian dust (rich in quartz and illite clays) dominates the
compo-IA
Holocene to m.
Eoc. Barren IB 12/11 m. Eoc. e. Eoc. SITE 1216 9/10 11 13 RP late Eocene
early Eocene to middle Eocene
e.Eoc. Unz oned Unz oned E/O SITE 1217 RP SITE 1221 e.Oligo . l. Eoc. middle Eocene e. Eocene l. P aleoc. RP Cher t Basalt E/O I II V IV IIIA IIIB mid.Miocene ear ly Oligocene middle Eocene Basalt ? ear ly Miocene late Oligocene e. Eocene late Eoc. SITE 1219 5 21 22 3 4 1 2 20 14 15 16 17 18 19 12 13 Not Zoned E/O O/M RN RP V (basalt) ear ly Oligocene middle Eocene late Eoc. late Oligocene III IVB Pleisto- cene l. Mio . m. Mio . ear ly Miocene IVA I II 22 1 2 3 4 5 6 7 15 14 Mix ed 19 18 21 20 15 15 /14 16 17 Barren E/O O/M
SITE 1218 RNRP SITE 1220
IV E/O P/E early Eocene middle Eocene late Eocene e. Oligo. l. Oligo. O/M?
e. Miocene ~
1 22 21 20 19 18 17 16 15 14 13 12 11 8 Chert sequence
7 RN
RP NP
Holo
. to e
. Eoc. Barren ear ly Eocene late P aleoc. 12 Not Zoned SITE 1215 10 11 9 8 SITE 1222 E/O RP 9 8 7
l. Oligocene to Holocene
e. to l. Oligo. e. Oligo.
m. Eoc.to u. Eoc.
e. Eoc. RP 18-19 16-18 Unz oned Unz oned Depth (mbsf) 110 120 130 140 100 150 160 170 180 190 210 220 230 240 260 270 200 250 10 20 30 40 60 70 80 90 50 0 10 20 30 40 60 70 80 90 110 120 130 140 50 100 150 160 170 180 190 210 220 230 240 260 200 250 0 10 20 30 40 60 70 80 90 110 120 130 140 50 100 150 160 170 180 190 200 0 10 20 30 40 60 70 80 90 110 120 130 140 50 100 150 160 0 10 20 30 40 60 70 80 90 50 100 0 10 20 30 40 60 70 80 90 110 120 130 140 50 100 0 10 20 30 40 50 60 0 10 20 30 40 60 70 80 50 0 Barren I II III IVA V IVB 16 20 19 18 17 15 14 13 12 11 7 I II IIIA IIIB IV V IA II III IV V IB 12 10 22 21 20 I IIA IIB III IV 19 18 17 16 15 14 I II IV III
Clay, Clay with zeolite, Zeolitic clay
Radiolarian ooze with increasing clay content Clay with chert
Clayey nannofossil ooze
Metalliferous oxide ooze Nannofossil clay Nannofossil ooze Basalt Nannofossil chalk Nannofossil chalk with increasing dolomite Radiolarite Thin chert layers
Nannofossil chalk with increasing diatoms Radiolarian ooze and clay, Clayey radiolarian ooze
Lith. unit Age Lith. unit Age Lith. unit Age Lith. unit Age Lith. unit Age Lith. unit Age Lith. unit Age Lith.unit Age
Oligo. to Holocene
l. Paleoc.
F6. Lithologic summary, p. 57.
Illite and smectite (%) 50 100 50 100 50 1000 50 1000 50
0 0 0
Illite Smectite Illite Smectite Illite Smectite Illite Smectite Illite Smectite 0 5 10 15 20 100 Site 1219 Site 1218 Site 1215 Site 1216 Site 1217
Depth (mbsf)
Smectite– Illite transition
F7. LAS determined
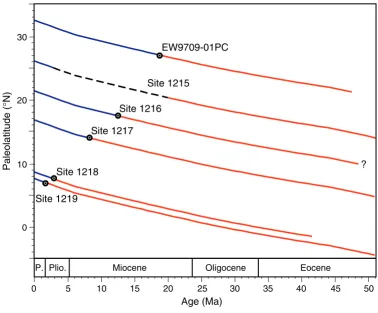
sition of dust deposited in the Pacific north of the ITCZ. In contrast, just south of the ITCZ, a clay mineralogy dominated by smectite is transported via the trade winds from Central and South American source regions. During Leg 199, we used light absorption spectroscopy (LAS) (see Vanden Berg and Jarrard, this volume) to produce ship-board estimates of clay mineralogy. In Figure F7, plots of LAS-determined mineralogical change downcore are shown vs. depth for Sites 1215–1219. Using paleoposition information, one can then iden-tify the change in ITCZ through time by the change from a smectite-rich to illite-smectite-rich clay suite (Fig. F8).
Radiolarian ooze or clayey radiolarian ooze are important sediment lithologies in the basal part of the surficial clay unit in Leg 199 sites drilled near the modern equator. These oozes are found at Sites 1219– 1221 (Fig. F6). In each case, the site occupied an off-equatorial position at the time that the radiolarian ooze was being deposited in the range of 3°–6° north of the paleoequator. Thus, in the Neogene and latest Oli-gocene, radiolarian ooze is deposited on the fringes of the equatorial upwelling zone. The zone of radiolarian ooze deposition is bound on the south by the appearance of foraminifers and disappears to the north as primary productivity decreases.
Oligocene–Lower Miocene Nannofossil Ooze/Chalk
The second broad litho-chronostratigraphic unit along the Leg 199 transect is the nannofossil ooze that first appears at the base of the Oli-gocene. The clay or radiolarian ooze to carbonate transition is an out-standing marker for the E/O boundary because it is very abrupt (see
“Eocene–Oligocene Transition,” p. 20). The unit has cyclic variations
of carbonate content related to orbitally driven changes in insolation. This cyclic variability will allow us to construct an orbitally tuned Oli-gocene age model of the sediments and to calibrate ages for magneto-stratigraphy and biomagneto-stratigraphy (see “Stratigraphic
Intercalibra-tions,” p. 17).
The nannofossil ooze/chalk unit is thickest at sites near the Oli-gocene equatorial region and thins to the north (Fig. F6). Nevertheless, traces of the lower Oligocene carbonate can be found as far north as Site 1217 (16°52′N). At the beginning of the Oligocene, Site 1217 was lo-cated ~9° north of the equator at a water depth of 4400 m.
The age of the uppermost nannofossil ooze/chalks depends on the paleoposition and water depth of each drill site. In the south (Sites 1218 and 1219), the uppermost nannofossil ooze unit has an age near the late Miocene. Traversing north, the uppermost nannofossil ooze at Site 1220 (10°11′N) is late Oligocene in age, whereas at Sites 1217 (16°52′N), 1221 (12°02′N), and 1222 (13°49′N), the uppermost nannofossil oozes are early Oligocene in age.
Late–Middle Eocene Radiolarian Ooze
The third broad litho-chronostratigraphic unit along the Leg 199 transect consists of radiolarian ooze, clayey radiolarian ooze, and radio-larian clays (Fig. F6). Clay content tends to be higher at the top and bottom of the unit. The radiolarian oozes are characteristic of the Eocene section and are the most enigmatic facies drilled during Leg 199, from a modern perspective, because of the lack of a true modern analog.
Age (Ma)
Paleolatitude (
°
N)
? P.Plio. Miocene Oligocene Eocene
5 10 15 20 25 30 35 40 45 50
0 0 10 20 30
Site 1215 Site 1216 Site 1217 Site 1218 Site 1219
EW9709-01PC
F8. Smectite–illite transition
In the southern sites of the Leg 199 transect (Site 1219) and in shal-lower drill sites (Site 1218 and DSDP Site 162), carbonate can be found at low concentrations in the upper Eocene and at higher levels in the middle Eocene, especially in Chron C18 (~39–41 Ma). For the rest of the transect, calcium carbonate (CaCO3) is absent from this unit even in
sites located at the contemporaneous paleoequator. The latitudinal width of the late–middle Eocene zone of radiolarian deposition varies through time. The middle Eocene, between ~40 and 45 Ma, represents the greatest latitudinal expansion—radiolarian oozes were found from the equator to a paleolatitude between 10° and 11°N (between DSDP Site 40 and Site 1216). In contrast, radiolarian deposition is confined to within a few degrees of the equator in the uppermost Eocene. Along the 56-Ma transect, radiolarian oozes are deposited only to the south of Site 1221, located at a paleolatitude of ~3°N. The upper Eocene–lower Oligocene sequence is condensed at Site 1221, and Sites 1222 and 162 both have a hiatus just below the Oligocene.
One of the striking features of a unit with such high biogenic silica content is the relative absence of diatoms. Only one major interval in the Eocene radiolarian ooze contains a relatively high diatom content (>10% diatoms in smear slides; Fig. F9). High numbers of diatoms ap-pear in Chron C18 (radiolarian Zone RP15; 39–39.6 Ma) and are associ-ated with the appearance of carbonates in the same sediment interval at Sites 1218 and 1219.
Lower Middle–Lower Eocene Cherts, Clay, and Radiolarian
Ooze
The fourth broad litho-chronostratigraphic unit along the Leg 199 transect consists of cherts, clays, and radiolarian oozes (Fig. F6). This unit proved predictably troublesome to recover. Leg 199 drilling results indicate that cherts are present at the boundary between the lower and middle Eocene throughout the transect with the exception of Site 1215 in the extreme north. A younger cherty chalk interval is present at Site 1218 near the middle/upper Eocene boundary, but this interval was continuously cored and recovered with the extended core barrel (XCB) (Fig. F10).
The lower–middle Eocene chert interval is relatively thin at Site 1219 in the south (~8 m thick; 7°48′N) but thickens to the north. At Site 1220 (10°11′N), the unit, including recovered cores of early Eocene radiolar-ian ooze, spanned 40 m. Poorly recovered cherty intervals span 30–40 m at Sites 1217 (16°52′N), 1221 (12°02′N), and 1222 (13°49′N). The unit is chronologically extensive. It typically first appears in radiolarian Zone RP11–12 (~45–49 Ma) and continues into the lower chalk unit around the top of radiolarian Zone RP7 (~53 Ma). The relationship be-tween these cherts and the lower nannofossil chalk is not yet clear. At Site 1219, a transition from zeolitic clay to nannofossil chalk was recov-ered, suggesting that the base of the unit may be marked by a grada-tional transition from clay to CaCO3. However, the chert recovered was
associated with most of the basal nannofossil chalk recovered on the leg; this lower unit is not free from chertification.
Lower Eocene–Upper Paleocene Nannofossil Ooze or Chalk
The basal litho-chronostratigraphic unit along the Leg 199 transect consists of nannofossil ooze or chalk of early Eocene–upper Paleocene age overlying basement basalt. Despite high numbers in the rest of theSITE 1221 RP Cher t Basalt e. Oligo . l. Eoc. middle Eocene ear ly Eocene l. P aleoc. E/O SITE 1220 IV E/O P/E early Eocene middle Eocene late Eocene early Oligocene l. Oligocene O/M?
early Miocene ~
Chert sequence
Barren RN RP ear ly Oligocene middle Eocene l. Eocene V (basalt) late Oligocene Pleist. l. Mio . ear ly Miocene Mix ed 15/14 Barren E/O O/M SITE 1218 RN
RP Not z oned m. Miocene ear ly Oligocene m. Eocene Basalt ? ear ly Miocene late Oligocene e. Eocene l. Eocene SITE 1219 E/O O/M RN RP
Significant diatom component (>10%, smear slide analysis) Clay, Clay with zeolite, Zeolitic clay
Radiolarian ooze with increasing clay content Clay with chert
Clayey nannofossil ooze
Metalliferous oxide ooze Nannofossil clay Nannofossil ooze Basalt Nannofossil chalk Nannofossil chalk with increasing dolomite Radiolarite Thin chert layers
Nannofossil chalk with increasing diatoms Radiolarian ooze and clay, Clayey radiolarian ooze 10 20 30 40 60 70 80 90 110 120 130 140 50 100 150 160 0 I II IIIA IIIB IV V 20 19 18 17 16 15 14 13 12 11 7 I II III IVA V IVB 1 22 21 20 19 18 17 16 15 14 13 12 11 8 7 10 20 30 40 60 70 80 90 110 120 130 140 50 100 150 160 170 180 190 200 0 110 120 130 140 100 150 160 170 180 190 210 220 230 240 260 270 200 250 10 20 30 40 60 70 80 90 50 0 III IVB IVA I II 22 1 2 3 4 5 6 7 15 14 19 18 21 20 15 16 17 m. Mio . 10 20 30 40 60 70 80 90 110 120 130 140 50 100 150 160 170 180 190 210 220 230 240 260 200 250 0 I II V IV IIIA IIIB 21 22 3 4 5 1 2 20 14 15 16 17 18 19 12 13 North South Depth (mbsf) Lith. unit Age Lith. unit Age Lith. unit Age Lith. unit Age
F9. Lithologic columns showing
where diatoms are common to abundant, Sites 1218, 1219, 1220 and 1221, p. 60.
Hole B 251.43 252.93 25X-1 250.97 253.97 Depth (mcd) 25X-1 25X-2
Hole A Hole C
GRA bulk density (g/cm3) 250.49
253.49
18X-3
18X-4
Site 1218 8.9°N, 135.4°W
4827.2 mbsl
0 1 2
GRA bulk density (g/cm3)
0 1 2
GRA bulk density (g/cm3)
0 1 2
Depth (mcd)
Depth (mcd)
F10. Late Eocene “pentachert”
Eocene, radiolarians are rare to absent in the basal carbonates. This unit is present at all sites except perhaps Sites 1216 (where the relevant stra-tigraphic interval was not drilled) and 1222, (where only chert was re-covered in the one hole drilled to basement). In three of the seven sites targeted to recover the P/E boundary (Sites 1215, 1220, and 1221), this objective was fulfilled (see “P/E Boundary,” p. 24). Where present, the basal carbonate unit is most lithified in the south, where overburden is greatest (~250 m burial depth; Sites 1218 and 1219). In contrast, at Site 1215, where the burial depth is significantly shallower (~25 m), we re-covered a nannofossil ooze. At three of the sites containing basal chalks (Sites 1217, 1218, and 1220), the sediments are partially to extensively dolomitized. The origin of this dolomite is unclear, but dolomitization appears to be related to proximity to basement rather than location along the latitudinal transect.
Paleogene CCD
One of the most striking features of the Paleogene equatorial Pacific sediments is the rapid appearance and disappearance of CaCO3 through
the stratigraphic record. Leg 199 drilling has significantly increased stratigraphic control for many of the Paleogene and early Neogene carbonate–noncarbonate transitions.
Van Andel et al. (1975) compiled DSDP data from all the drill sites in the region and used subsidence curves of ocean crust to develop the Cenozoic history of CaCO3 deposition. This compilation shows that the
Eocene was marked by a shallow CCD or level in the water column where the pelagic rain rate of biogenic carbonate is equal to the rate of depth-dependent dissolution. Specifically, the Eocene CCD in the equa-torial Pacific is estimated to have been ~3400 m shoaling to ~3200 m beyond 4° from the equator to either the north or south. Furthermore, one of the most prominent changes in the CCD through time captured in this early compilation was a pronounced deepening (by ~1600 m in the equatorial region) associated with the approximate transition from the Eocene to the Oligocene. Shipboard results from Leg 199 support this early interpretation of events. In fact, our shipboard data demon-strate that the correlation between the Eocene–Oligocene transition and the CCD deepening is strikingly precise and consistent across wide tracts of the tropical Pacific. These findings, raise the intriguing possi-bility that this pronounced deepening of the CCD is in some way re-lated to the first widely accepted sustained glaciation in Antarctica (Oi-1; Fig. F5). The nature of the relationship between these two significant paleoceanographic signals will be an important component of shore-based Leg 199 research. In addition, our shipboard data also demonstrate that the transition from silica-rich/carbonate-poor Eocene to silica-poor/ carbonate-rich Oligocene deep-sea sediments is remarkably rapid. The transition from carbonate-free to carbonate-bearing sediments is sharp (typically occurring over a 10- to 20-cm interval [Fig. F11]), implying that it took only a few tens of thousands of years to introduce the changes in ocean chemistry that depressed the CCD to >1 km below its Eocene depth.
Leg 199 sediments define other major CCD changes in the Eocene that will be better studied after the cruise. The Paleocene–lower Eocene basal chalks define a relatively shallow CCD in the beginning of the in-terval drilled during Leg 199 (Fig. F12). The transition from chalk to clay and radiolarian ooze occurs when near-equatorial sites passed through a water depth of only ~3200–3300 m (Sites 1219–1221),
Hole C 17X Hole A 23X-24X Hole B 23X-24X Hole A 3H-4H Hole B 2H-3H HoleA 16H-17H Hole A 7H-8H Hole B 4H Hole C 2H-3H Hole A 1H Hole B
2H Hole C 1H-2H Site 1218
8.9°N, 135.4°W 4826 m
Site 1217 16.9°N, 138.1°W
5342 m Site 1219
7.8°N, 142.2°W
5063 m Site 1220 10.2°N, 142.7°W
5218 m Site 1221 12.3°N, 143.7°W
5175 m
Increasing water depth
Uppermost Eoceneradiolarian ooze Lowermost Oligocenenannofossil ooze
F11. Cores across the E/O
bound-ary, Site 1218, p. 62.
B
0 10 20 30 40 50 60
Site 1220 Site 1219 Site 1218 P a leodepth (km)
Geologic age (Ma)
3300 m at 53.0 Ma 3200 m at 53.4 Ma
4200 m at 33.7 Ma
4600 m at 19.5 Ma
4300 m at 33.7 Ma 4550 m at 27 Ma
3200 m at 40.4 Ma 3700 m at 33.7 Ma
4550 m at 10.5 Ma
CaCO3
no CaCO3 CCD A 2.5 3.0 3.5 4.0 4.5 5.0 5.5 Site 1215 Site 1217 Site 1221 P a leodepth (km)
Geologic age (Ma)
3400 m at 53.3 Ma
3600 m at 50.8 Ma
3350 m at 52.7 Ma
4300 m at 33.7 Ma
4400 m at 33.7 Ma
CaCO3
no CaCO3 CCD
0 10 20 30 40 50 60 2.5 3.0 3.5 4.0 4.5 5.0 5.5
F12. Subsidence history of
whereas the off-equator sites record a shift from carbonate to clay when they passed below 3400–3600 meters below sea level (mbsl) (Sites 1215 and 1217). In contrast, the Oligocene and Neogene CCD is ~4500–4600 m (Fig. F12). The difference in early Eocene CCD between equatorial and northern sites is greater than the errors associated with the estima-tion and is the reverse of the Neogene trend. Typically, in the Neogene, the CCD is deeper beneath the equatorial region because of higher car-bonate production in the equatorial region relative to periequatorial re-gions, but this situation seems to have been reversed in the early Eocene.
Although carbonate disappears from the equatorial Pacific in the lower Eocene, CaCO3 is not absent from the Eocene record. A
promi-nent CaCO3 event appears in Chron C18r at ~40–41 Ma (defined by Site
1219 in the south) that can also be found at DSDP Site 162 (van Andel et. al, 1973) (Fig. F12). Smaller carbonate events occur in Chron C20n (~43 Ma) and near the base of C17n (~38 Ma) at Site 1219. The younger event can also be found at Site 1218. In contrast, none of these carbon-ate events can be found further north, nearer the middle Eocene paleo-equator (Site 1220). In fact, there is no CaCO3 in the middle and late
Eocene section at Sites 1220, 1221, or 1222.
The transition from chalks to radiolarite at ~40 Ma in Site 1218 ap-pears as abrupt as the transition from radiolarian clay to nannofossil oozes at the E/O boundary. The rapid transitions of sediment type in ei-ther direction suggest that ei-there is a strong climate switch at work. Sed-iments with poor carbonate preservation have also been identified dur-ing each of the Oligocene intervals that correlate to warm intervals between the “Oi” glacial advances of Miller et al. (1991). Thus, the Leg 199 shipboard scientists have developed a working hypothesis that car-bonate deposition in the tropical Pacific is in some way associated with continental glaciations, whereas tropical Pacific radiolarian oozes are associated with warm global climates. If this hypothesis is substanti-ated, one implication would be that the transition from cold to warm climates can be as abrupt as the transition from warm to cold climates.
Equatorial Position
Drill sites move with their respective plates and must be backtracked in space as well as depth. Van Andel et al. (1975) recognized the para-mount importance of backtracking tropical Pacific drill sites with re-spect to the motion of the Pacific plate because the equatorial up-welling system leaves a strong imprint on the sediment column when the site passes underneath the equator. This generalization holds for the Oligocene and Neogene. We can recognize the passage of Site 1219 un-der the equator in the Oligocene by the sedimentary changes, but we find confusing sedimentary signals in the earlier record.
lead to relatively large errors in a drill site position over long intervals of time.
Shipboard whole-core paleomagnetic analysis has been sufficient to make a preliminary definition of the position of the paleoequator and the change in paleolatitude of Leg 199 drill sites in the Oligocene and in the late middle Miocene (Figs. F13, F14). These data will be refined postcruise with discrete sample analyses. They suggest that the fixed hotspot backtrack of paleopositions is sufficiently accurate to estimate paleopositions back to the middle Eocene. Paleomagnetic analysis of older sediments should yield further evidence for equatorial positions in the early Eocene.
Fluxes and Paleoproductivity
Another primary objective of Leg 199 science is to assess the level of productivity over the Paleogene by using biogenic MARs in concert with other geochemical and micropaleontological data. With this goal in mind we designed a shipboard program to monitor the composition of pore waters in the sediments and measure the bulk chemical compo-sition of recovered sediments.
Organic Carbon Diagenesis and Interstitial Waters
In the context of productivity and biogenic sediment flux consider-ations, it is notable that none of the Leg 199 sediments contained sig-nificant organic carbon (Corg). As measured on board the ship, Corg
lev-els in Leg 199 sediments were consistently low (~0.1–0.2 wt%), essentially the detection limit for the analysis at sea. Chemical gradi-ents in Leg 199 interstitial waters primarily reflect the relatively limited organic matter diagenesis as well as dissolution of biogenic silica and varying amounts of diffusive influence of reactions in the underlying basalt (Fig. F15). Sulfate concentrations are high (>25 mM) throughout the transect, indicating little oxidation of labile organic matter (Fig.
F15). These high sulfate levels mean that barite in the sediments will be well preserved and as a result will potentially be useful for paleoproduc-tivity studies. This is especially important because it appears that any organic matter that may have been delivered to these sites has long since been degraded, if in fact it ever was deposited at all. Ammonium, another by-product of organic matter degradation, is only present in extremely low levels at all sites.
Dissolved silica concentrations generally increase with depth at all sites (Fig. F15). These high interstitial water silica values are consistent with the presence and dissolution of biogenic silica throughout the sed-iment. Strontium concentrations are generally constant at about sea-water value (87 mM) for several of the sites containing little carbonate (Sites 1215–1217, 1220, and 1221), but strontium increases with depth at Sites 1218 and 1219 (Fig. F15) reflecting the presence and dissolution of biogenic carbonate.
Calcium, magnesium, and potassium concentrations at most Leg 199 sites show little evidence for exchange with basalt and subsequent dif-fusion (Fig. F15). However, the increase in calcium concentration and decrease with depth in magnesium, potassium, and lithium concentra-tions at Site 1219 are significantly greater than that seen at other Leg 199 sites. These patterns are consistent with alteration of basement rocks and with the recovery of highly altered basalt at Site 1219, unlike the other sites in the Leg 199 transect. The higher levels of lithium at
39-Ma Equator 26-Ma Equator
1218
1219 1220
Murray Molokai
Clarion Clipperton
F13. Relative position of the
paleo-equator for the middle Eocene and late Oligocene, p. 64.
0 10 20 30 40
Age (Ma)
Paleolatitude (
°
N)
Site 1220 Site 1219 Site 1218
0 10
F14. Inferred paleolatitudes, Sites
1218, 1219, and 1220, p. 65.
30 60
Site 1215 Site 1216 Site 1217 Site 1218 Site 1219 Site 1220 Site 1221 Site 1222 0
50 100 150 200 250 300 0 50 100 150 200 250 300
0 30 0 30 600 10 20 25 30 350 700 1400 50 100 150
Ca (mM) Li (µM) K (mM)
Mg (mM)
SO4 (mM) H4SiO4 (µM) Sr (µM)
Depth (mbsf)
Depth (mbsf)
F15. Interstitial water profiles,
Site 1215 relative to other Leg 199 sites could be linked to the volcanic ash layers recovered at that site.
Bulk-Sediment Analyses
The Leg 199 shipboard geochemical program differed from typical ODP protocol by incorporating relatively detailed downcore profiles of Corg composition. The resulting profiles primarily reflect the shifts in
li-thology between sediments dominated by silica to those dominated by carbonate (Fig. F16). When these data are combined with sedimenta-tion rates (Fig. F17) and bulk density data, it is possible to examine burial fluxes through the Paleogene. MAR calculations are a means to distinguish rates of elemental deposition even under conditions of sig-nificant dilution by other sedimentary phases. This is best shown by comparing Si weight percent profiles at Sites 1218 and 1219 to the Si MAR profiles (Fig. F16). Low Si contents between 20 and 30 Ma are pri-marily caused by dilution of Si by CaCO3. The MAR profile indicates
that Si fluxes decreased much less dramatically than percentage data seems to indicate.
Changes in Si MARs should reflect biogenic SiO2 production because
the detrital Si contribution by aluminosilicates is relatively low and constant. Al analyses reflect the detrital aluminosilicate contribution (Fig. F18) and are relatively low with respect to the high Si MAR in the Eocene and Oligocene. A rough indicator of baseline aluminosilicate contribution to Si MARs is given by the Si MAR in the period younger than 15 Ma when clays were the principal sediment accumulating at all Leg 199 drill sites. By comparison to this baseline (15 Ma to present value), it is clear that biogenic Si deposition has decreased since a peak in the middle Eocene between ~38 and 45 Ma.
Virtually all calcium MAR results from the deposition of CaCO3 (Fig.
F16). High Ca contents and high Ca MARs occur in the high-CaCO3
in-tervals of the Oligocene and lower Miocene. Smaller events can be seen in the middle Eocene, particularly ~40 Ma. The lower Eocene Ca MAR is approximately one-half to two-thirds of the high rates of deposition in the Oligocene. Phosphorus burial has a primary source term driven by export productivity (Fig. F18). The phosphorus MAR peaks in the early Oligocene and also in the period ~40–45 Ma in the middle Eocene, which suggests that this part of the middle Eocene had elevated paleo-productivity relative to the late Eocene.
Ratios to an element assumed to be constantly delivered (or nearly so) is another quick way to assess changes in deposition. Figure F19 il-lustrates this approach by showing ratios of Si, Ba, and Al to Ti. We as-sume that titanium is bound to aluminosilicates and has relatively con-stant deposition. The plots of Si/Ti and Ba/Ti suggest that there was relatively high burial of Ba and Si during the Eocene. The relatively con-stant Al/Ti is an indication that clay minerals are a primary contributor of the Ti flux.
Latitudinal MAR Transects
Observing MARs in time slices along latitudinal transects is another way to assess how sedimentation in the Eocene differs from that in the Oligocene and Neogene. We have chosen three time slices for shipboard comparison: (1) an early Eocene time slice (50–55 Ma), when all parts of the 56-Ma transect were above the CCD; (2) a middle Eocene time slice (38–45 Ma), during the period of highest radiolarian ooze deposition;
0 50100150200 Si (MAR)
0200 400 600 800
Site 1215 Site 1216 Site 1217 Site 1218 Site 1219 Site 1220 Ca (MAR) 010203040
Si (wt%)
Age (Ma)
01020304050 Ca (wt%) 0 10 20 30 40 50 60
F16. Analyses of sedimentary Si
and Ca weight percent and MARs, p. 67.
51015
Age (Ma)
Site 1219
Average linear sedimentation rates (m/m.y.)
51015 510 5 1015 510510 510 51015 Site 1218 Site 1220 Site 1221 Site 1222 Site 1217 Site 1216 Site 1215
7°48'N 8°53'N 10°10'N 12°01'N 13°49'N 16°52'N 21°27'N 26°01'N early Oligocene/ late Eocene middle Eocene early Eocene 0 10 20 30 40 50
F17. Summary of sedimentation
rates derived from age-depth models, p. 68.
0 5 10 1520 Al (MAR)
0 12 3
Site 1215 Site 1216 Site 1217 Site 1218 Site 1219 Site 1220 P (MAR) 0 4 8 12
Al (wt%)
Age (Ma)
0 0.51.01.52.0 P (wt%) 0 10 20 30 40 50 60 4 4
F18. Analyses of sedimentary Al
and P weight percent and MARs, p. 69.
0 32000 60000 Ba/Ti (based on ppm and wt%)
Site 1215 Site 1216 Site 1217 Site 1218 Site 1219 Site 1220 Si/Ti (based on wt%)
Age (Ma)
020406080 100 Al/Ti (based on wt%) 10 20 30 40 50 60
01000 2000 3000 4000 0
F19. Si/Ti, Ba/Ti, and Al/Ti of Leg
and (3) an Oligocene time slice (25–34 Ma), when high CaCO3
sedi-mentation had been established.
The Si MAR is highest in the middle Eocene (Fig. F20), but the latitu-dinal gradient of the Si MAR does not peak in the equatorial region as it does in the Neogene. Instead, the Si MAR increases southward. A high Si MAR in the middle Eocene may be due, in part, to the fact that Eocene radiolarians are heavily silicified (Moore, 1969). An individual middle Eocene radiolarian test has an average weight about four or five times that of an average Pleistocene radiolarian test and is much less susceptible to dissolution at the seafloor. The high Si MAR may repre-sent low dissolution prior to burial as well as relatively high Si flux to the sediments.
In the early Eocene, we observe low Si MARs at all latitudes— sufficiently low that a large contribution of Si to sediments must be from clay minerals. Only the Oligocene has a MAR pattern that resem-bles that of the Neogene with the highest MAR peaking in the equato-rial region. The flux of Si at the Oligocene equator is roughly equivalent to the modern MAR at 110°W (Lyle, 1992). Lyle (1992) expressed the modern flux as SiO2 rather than biogenic Si. The SiO2 fluxes in the
Ho-locene equatorial region are equivalent, however, to ~50 mg/cm2/k.y.
biogenic Si.
Ca MARs in the early Eocene time slice (Fig. F21) are actually equiva-lent to or higher than modern fluxes of Ca from CaCO3 along a 110°W
transect, except in the equatorial region (Lyle, 1992). In the early Eocene, however, there is no well-developed equatorial maximum in CaCO3 deposition. In fact, CaCO3 burial in the equatorial region may
be only half as much as burial in the subtropical flank of the transect. In the middle Eocene, essentially no CaCO3 is deposited anywhere
ex-cept the southernmost part of the transect, which reflects the shallow middle Eocene CCD and the lack of CaCO3 deposition in the equatorial
region. Only the Oligocene latitudinal transect resembles a Neogene equatorial profile. CaCO3 deposition at the equator is as high as
Ho-locene deposition.
It is clear from our shipboard examination that sedimentation pat-terns of the Eocene are significantly different from modern equatorial sedimentation. Postcruise analyses utilizing other paleoproductivity in-dicators will be needed to understand the development of primary and export productivity through the Eocene. Nevertheless, there are few in-dicators that productivity was high in the Eocene central tropical Pa-cific Ocean.
One important problem to be approached by postcruise studies is whether Corg levels are low in Eocene sediments because of a long
pe-riod of exposure to oxidants diffusing into the sediment from seawater or whether Corg levels were never high in the first place. Shipboard
paleomagnetic studies provide circumstantial evidence for the riddle of low Corg. Preservation of the paleomagnetic record in sediments
strongly depends on diagenesis. For example, Fe3+-Fe2+ reduction
dis-solves magnetite, leading to a decrease of both magnetic susceptibility and magnetic intensity of the sediments. Along the Leg 138 transect, the Neogene equivalent of the Leg 199 transect, sites at the equator or under regions of relatively high Corg deposition have
magnetostrati-graphic records limited to the upper sediments (Mayer, Pisias, Janecek, et al., 1992), whereas sites under regions of low primary productivity have more extended magnetostratigraphic records. The long magneto-stratigraphic records obtained on the Leg 199 transect, along with the
0 20 40 60 80 100 120
-5 0 5 10 15 20
Si (25-34 Ma) Si (38-45 Ma)
Si (50-55 Ma)
Paleolatitude (°) early Eocene time slice Oligocene time slice middle Eocene time slice 1219 1219 1219 1218 1218 1220 1221 1220 1221 1217 1217 1217 1216 1216 1215 1215 1215
Si MAR (mg/cm
2 per k.y.)
F20. Latitudinal transect of Si
MARs for the early Oligocene, middle Eocene, and early Eocene, p. 71. 0 50 100 150 200 250 300 350 400
-5 0 5 10 15 20
Ca (25-34 Ma) Ca (38-45 Ma)
Ca (50-55 Ma)
Paleolatitude (°) early Eocene time slice Oligocene time slice middle Eocene time slice 1219 1219 1219 1220 1220 1220 1221 1221 1217 1217
12171216 1216 1215
1215 1215
Ca MAR (mg/cm
2/k.y.)
F21. Latitudinal transect of Ca
absence of a systematic decrease in magnetic intensity and susceptibil-ity downcore, suggest that there never were high levels of Corg
deposi-tion in the Eocene.
Stratigraphic Intercalibrations
A major success of Leg 199 is the recovery of continuous sedimentary records with uninterrupted sets of distinct Cenozoic geomagnetic polar-ity chrons from the paleoequatorial Pacific Ocean (Fig. F22). The sedi-mentation rates of the recovered and complete composite sections pro-vide acceptable resolution for meaningful magnetobiochronologic calibrations for the early middle Eocene–early Miocene time interval. Biogenic silica is ubiquitously present and will permit, for the first time, the establishment of a precise Cenozoic biochronology of radiolarians, diatoms, and silicoflagellates from a tropical Pacific Ocean setting.
Biogenic carbonate is variably preserved and exhibits moderate to complete dissolution. The upper Paleocene–lower Eocene and Oli-gocene–lower Miocene intervals have the best preservation, which of-fers huge potential for establishing a tropical Pacific Ocean biochronol-ogy of calcareous nannofossils and planktonic foraminifers tied to magnetostratigraphy. Nannofossils can also be calibrated through much of the Eocene. As most existing age estimates for these groups have been derived from the Atlantic Ocean region, the establishment of an accurate biochronology based on Leg 199 sediments will permit as-sessments of the degree of interbasin synchrony among the calcareous plankton.
It follows that the sediments recovered during Leg 199 from the paleoequatorial Pacific Ocean will be an exceptionally valuable refer-ence material for years to come for paleoceanography as well as studies of the evolution, biochronology, and intergroup and interbasin correla-tions among siliceous and calcareous micro- and nannofossils.
One of the enduring legacies of Leg 199 will undoubtedly be the revi-sion of tropical radiolarian biostratigraphy. The opportunity to tie ra-diolarian biostratigraphic events directly to unambiguous magneto-chronology will provide some of the first direct ties between the tropical siliceous microfossil record and the absolute timescale of the Paleogene. Furthermore, the repeated recovery of lower Miocene, Oli-gocene, and middle and upper Eocene radiolarian-rich sediments at four sites makes it possible to check the reliability of radiolarian events. Most radiolarian bioevents have been calibrated indirectly to the ab-solute timescale by correlation to calcareous nannofossil biostrati-graphy. During Leg 199, radiolarian bioevents were accompanied by high-resolution magnetostratigraphy, which allows the ages of biozone boundaries to be determined directly from the Cande and Kent (1995), Hilgen (1991a, 1991b), and Shackleton et al. (1995) timescales. Figure
F23 shows a comparison between the newly determined zonal bound-ary ages, calibrated using the reversal stratigraphy from Sites 1218 to 1220, with those estimated by Sanfilippo and Nigrini (1998; SN98). The age estimates of SN98 are based on an unpublished catalog and chart constructed from a reexamination of all Paleogene low- and middle-latitude DSDP/ODP sites from Leg 1 through 135 in which there is a recognizable radiolarian fauna. The published information was reevalu-ated using current, uniform species concepts and integrreevalu-ated, where pos-sible, with published nannofossil and paleomagnetic data. Sanfilippo and Nigrini (1998) cautioned that their chronology of Paleogene radio-larian zonal boundary events is at best a good approximation.
late middle Eocene late Oligocene ear ly ear ly Miocene Site 1217 Site 1218 Site 1219 Site 1220 middle 100 50 150 100 50 150 200 100 50 150 200 250 50 20 80 16°52'N 138°6'W
7°48'N 142°1'W
10°11'N 142°45'W 20 21 22 23 24 25 26 27 28 29 30 31 32 33 34 35 36 37 38 39 40 41 42 43 44 19 18 17 15 14 13 12 11 16 33.7 23.8 C5A C5r C5n C5B C6 C5E C5D C5C C6A C6AA C6B C6C C7 C7A C8 C9 C10 C11 C12 C13 C15 C16 C17 C18 C19 C20
8°53'N 135°22'W
F22. Synthesis of magnetic
stratig-raphy, p. 73.
F23. Comparison of estimated ages
of radiolarian zones, p. 74.
Leg 199 age (Ma)
0 5 10 15 20 25 30 35 40 45 Published age (Ma)
Site 1220 Site 1219 Site 1218 RN7/RN6 RN6/RN5 RN5/RN4 RN4/RN3 RN3/RN2
Figure


Related documents
Estas ventajas admiten dos categorías: aquéllas que crean una nueva situación política de gravitación internacional; y aquéllas que disminuyen o ponen término a los obstáculos
8) Secondary production is limited primarily by A) water availability.. 10) The base of the detrital food chain is formed by A) primary producers.. B) decomposers. Answer:
Paragraph 1904.4(a) of the final rule mandates that each employer who is required by OSHA to keep records must record each fatality, injury or illness that is work-related, is a
ischemic stroke patients with disease in other vascular beds were at particularly high risk of future vascular events as pre- viously suggested, 13,14 we studied patients
Aim of the study: To investigate the antinociceptive effect of ethanol extract from Lecythis pisonis leaves (LPEE), fractions (hexane-LPHF, ether-LPEF and ethyl acetate-LPEAF)
To find local farmers’ markets in North Carolina, visit myeatsmartmovemore.com/FarmersMarkets S Nutrition Information Servings 4 Calories 120/serving Total Fat 6g Saturated Fat
Authentication of users/clients accessing the Hadoop cluster using Kerberos Protocol Authorization for accessing data residing.. over the HDFS (by granting and
The focus of dissemination will be on scientific publications, presentations at scientific and other meetings, project website as well as the stakeholders and
