Department of Economics University of Southampton Southampton SO17 1BJ UK
Discussion Papers in
Economics and Econometrics
1999
This paper is available on our website
Economic Integration, Intensity of Competition and R&D
Incentives
*+Duncan McVicar
University of Southampton
and
Northern Ireland Economic Research Centre, Queen’s UniversityBelfast
JEL: L1, O3, O4
Keywords: Integration, R&D, Competition, Scale effects
Abstract
A two-country differentiated duopoly model is set out in which economic integration
increases firms’ incentives to invest in R&D, purely through the effect of increased
intensity of competition between firms. The model is extended to incorporate
knowledge spillovers, which, if related to the degree of integration, give rise to an
inverted u-shaped relationship between R&D incentives and integration. The model is
also extended to the n-firm general equilibrium case in which integration stimulates
economic growth through intensity of competition. As such, the model suggests a
positive growth effect of economic integration that does not rely on the usual scale
effects.
*Correspondence Address: Duncan McVicar, NIERC, 46-48 University Road, Belfast BT7 1NJ, UK.
D.McVicar@qub.ac.uk.
+ The support of ESRC Award No. R00429534230 is gratefully acknowledged, as are helpful
1: Introduction
If there are dynamic efficiency gains to be made as a result of economic integration
then it is possible that integrating a set of economies may lead to a higher long run rate
of growth. This possibility has attracted some attention in recent years as regional and
global integration has progressed, A variety of ways in which the R&D and
subsequent innovation decisions of profit maximising entrepreneurs might be affected
by integration have been suggested. The most generally used arguments are that
integrating a number of economies enlarges the market and knowledge base available
to firms and may therefore enable them to exploit scale economies in R&D.
The technology-push hypothesis discussed by Phillips (1966) argues that there is a
relationship between the level of underlying scientific knowledge in an economy and
the rate of technological progress. Rivera-Batiz and Romer (1991) argue that if the rate
of innovation is positively related to the current stock of knowledge capital in an
economy, economic integration will allow access to an international stock of
knowledge and therefore increase the rate of technological progress. Rivera-Batiz and
Romer (1991) also discuss the importance of what Schmookler (1966) referred to as
the demand-pull hypothesis, where integration presents a bigger market and therefore
a greater reward to a successful innovator. This market enlargement effect will have an
unambiguously positive effect on incentives to innovate, other things being equal. The
problem with these predictions is that empirical evidence for such scale effects is, at
best, mixed.
At the same time as these scale effects, integration will change the nature of the
competition resulting in extra pressure on home market shares and added opportunities
to steal shares in foreign markets. It is likely that such changes in the intensity of
competition will have an effect on R&D incentives. These ‘increased competition’
effects of integration have not, so far, received as much attention in the literature as
the demand-pull and technology-push scale effects. However, a considerable wealth of
knowledge on these matters can be found in the IO literature. Drawing on this
literature, this paper takes a closer look at the competition effects of integration and
their implications for R&D and long run growth.
The remainder of this paper is set out as follows. The following Section discusses the
IO literature on competition and innovation and some of the particular characteristics
of these models that may have critical implications when they are extended to consider
integration. Section 3 presents a simple two-firm two-country model where integration
is modelled as an increase in the substitutability between differentiated goods. Two
interesting special cases of this model are also considered: Firstly, when firms are
allowed to co-operate in research and secondly when the extent of appropriability of
R&D is related to the degree of integration. Section 4 extends the model to allow for
asymmetric initial costs of production. Section 5 further extends the basic symmetric
model to an n-sector general equilibrium model in which national growth rates are
shown to be positively related to the intensity of competition and therefore the degree
of integration. Section 6 summarises and concludes.
2: Intensity of Competition, Integration and R&D
How might increased intensity of competition affect R&D? More intense competition
its competitors. This will give added incentives to keep up with R&D. Equally,
successful innovation will allow the firm to more easily expand its share of a given
market at the expense of its competitors by stealing their shares (Sutton, 1996). In
other words, there is strategic complementarity in R&D between firms (Miyagiwa &
Ohno, 1997). These strategic considerations add to R&D incentives when competition
is intensified.
However, as ever, the story is not that simple. The relationship between concentration
and R&D incentives may be very different for different types of innovation and
different types of competitive behaviour. For example, the relationships between R&D
aimed at reducing production costs and market concentration, and between R&D
aimed at introducing new products and concentration may be of opposite sign (Cohen
& Levin, 1989). Sutton (1996) finds a similar discrepancy between quality improving
R&D and new product R&D.
Many authors have discussed the different implications for R&D incentives of
modelling competition by quantity or by price (Cournot or Bertrand), mainly for
process innovation. Brander and Spencer (1983), for example, argue that Cournot
competition favours innovation in that one firm’s cost reduction will lower the output
of its competitors, whereas under Bertrand competition, a cost reduction will lower its
competitors’ price. In general, no real consensus has emerged as to the relationship
between concentration and R&D under either Cournot or Bertrand competition. For
example, for a homogenous good and process innovation, Dasgupta and Stiglitz
(1980) find a negative relationship between R&D and competition. Qui (1994) finds a
Bester and Petrakis (1993) find a positive relationship between the degree of product
substitutability and R&D incentives for both Cournot and Bertrand competition, and
that incentives to innovate are higher (lower) under Bertrand than Cournot for a high
(low) degree of substitutability.1
This lack of consensus highlights the sensitivity of results to the particular
assumptions on which these models are built. I discuss three such assumptions below,
which are of particular interest in the current paper. Firstly, the specification of linear
demand functions is shown to have critical implications. Secondly, the degree of
appropriability of the benefits of R&D can be important. Thirdly, the degree to which
firms can co-operate in research has implications for the competition/R&D
relationship.
Given the overall ambiguity of the competition/R&D relationship in the theoretical
literature, a critical role for empirical evidence is implied. However, the empirical
literature is also lacking consensus and evidence is mixed. Positive relationships
between competition and innovation are found by, for example, Horowitz (1962) and
Mansfield (1968). Williamson (1965) and Bozeman and Link (1983) find negative
relationships. Scherer (1967) finds evidence of a non-linear inverted U-Shaped
relationship, with an optimum degree of competition. Sutton (1996) shows how
apparent relationships are weakened when industry-specific effects, such as
technological opportunity, are included. Problems with data, such as distinguishing
between process and product innovations and the lack of reliable industry level
elasticity estimates have prevented a definitive empirical examination of these matters.
There is also the added complication of reverse causality between R&D and
concentration. Cohen and Levin (1989) discuss these problems in a detailed review of
the empirical market concentration and R&D literature, pre 1989.
A key assumption shared by the models of Brander and Spencer (1983), Bester and
Petrakis (1993), Qui (1994) and Sutton (1996) is the specification of linear demand
functions.2 With such a linear demand specification, increasing the substitutability
between goods, or increasing the intensity of competition, has the effect of shrinking
the size of the market available to each firm. This effect is outlined and contrasted
with the effect of increasing substitutability in the non-linear demand specification
adopted in the current paper. It is this shrinking market effect that is behind Qui’s
predicted U-Shaped relationship, with R&D incentives being driven by a similar
shaped marginal profits function. More specifically, R&D incentives are responding to
the interaction between the negative shrinking market effect and the positive strategic
market-share effects discussed above, which eventually dominate. In what follows, I
adopt a non-linear demand specification that does not have this shrinking market
effect. This is more appropriate to a study of integrating markets, whereas the linear
demand specification may be more appropriate to studies of entry into given markets.
This is my first formal point of departure from the IO literature.
The usual linear demand specification (taken from Qui (1994)) is as follows:
2 In fact, Sutton presents both a relatively simple linear model and a less simple, but more general,
bounds-approach model. He advises us to take both theoretical results from such simple linear models
pi = αi – qi - γqj, (1)
where γ (0<γ<1) is the degree of substitution between the two goods and i and j denote
competing firms. Inverting and summing over i gives us total market demand:
qi + qj = {(αi + αj) – (pi + pj)}/(1 + γ). (2)
This is clearly decreasing with γ.
In contrast, the non-linear demand specification adopted in the model of the following
Section displays market-size stability when the degree of substitutability is altered, as
shown by (3). For simplicity, I assume symmetric prices, pi = pj = p.
qi + qj = 2mp-γ/2p1-γ= mp-1, (3)
Clearly, in this case, market size is invariant with γ.
Another common assumption in the IO literature on concentration and innovation
discussed above is the full appropriability of the benefits of R&D, or in other words,
that there are no knowledge spillovers. The presence of such spillovers has been
shown to have important implications for R&D incentives in a related literature on
R&D co-operation (see, for example, D’Aspremont & Jacquemin 1989; Kamien et al,
1992). These papers argue that the incentives to invest in R&D will be lower if some
of the benefits of that R&D spill over to firms in direct competition, because spillovers
direct competition, this is not such an important consideration. If we accept this
argument, then integration should increase this spillover disincentive for R&D. This is
likely to have important implications for the overall integration/R&D relationship
through intensity of competition effects, and is another point of departure from the
papers discussed above.
The assumption of incomplete appropriability is given further importance in this
context if we assume the level of spillovers is related in some way to the degree of
integration between firms or countries. That knowledge spillovers across national
boundaries might be positively related to the level of interaction between countries has
been suggested by, among others, Grossman and Helpman (1991). There is also strong
evidence that flows of goods within countries are highly correlated with spillovers
between firms and industries. If this is the case, then integration, by strengthening
spillovers, may have a further disincentive effect on R&D. This possibility is
considered in Section 3.3, and is shown to have some very interesting implications. In
particular, the interaction of the positive strategic and negative spillover effects can
lead to an inverted U-Shaped relationship between R&D incentives and integration,
suggesting the possibility of an optimum level of integration.
R&D co-operation and integration is an area of research that has been largely
overlooked so far in the literature, although claims have been made that integration
might stimulate co-operation and therefore dynamic performance (Cecchini, 1988). To
recap, co-operation in research, or research joint ventures (RJVs) may have benefits
and costs. On the one hand, knowledge may diffuse more quickly between venturers
the disincentive effects of spillovers may be reduced. Further, high fixed costs in R&D
can be shared and economies of scale realised. On the other hand, co-operative
research agreements may be anti-competitive in both the research and production
markets, which could lead to both dynamic and static inefficiency. According to
Ordover and Willig (1985), generally the benefits of co-operation can be expected to
outweigh the costs. However, as the degree of product market rivalry increases, a
co-operative research agreement is less likely to lead to increased research (Katz, 1985).
This is the key point here. By fostering anti-competitive behaviour in RJVs,
integration may lead to reduced R&D expenditure and slower technological progress.
This is considered in Section 3.2.
One of the most important fault lines running through the competition/R&D literature
is the assumption of symmetry or the nature of the asymmetry assumed. Bester and
Petrakis (1993) find a firm that has gained a cost advantage in the past is more inclined
than its competitors to invest in further cost reductions.3 In a dynamic setting, this
would suggest a dominant firm outcome, such as found by Grossman & Shapiro
(1987) and Harris & Vickers (1987), for example. In these models, the follower
becomes increasingly disillusioned as the technology gap widens. However, the
predictions of these models depend on assumptions made about the technological
opportunities facing firms. In many cases, it is assumed that the best followers can do
is catch up (see Aghion and Howitt, 1998, for an example). Alternative assumptions
can lead to the opposite implications for follower incentives. In Section 4, I present a
model where the low-technology firm has the greater incentive to invest in R&D,
resulting in a stable symmetric equilibrium. A detailed review of such symmetry
considerations is provided by Beath et al (1994).
In the following Section I set up a simple two-firm, two-country model in which
integration is modelled by an increase in the substitutability in preferences between the
two goods. Although commonly used in the IO literature to model increased
competition, this is a novel approach to modelling economic integration. It is not
without precedent, however. Danthine and Hunt (1994) adopt the technique in their
study of integrating labour markets. What this approach allows is the isolation of the
intensity of competition effect from other integration effects, such as demand-pull. By
modelling integration in this way the market enlargement effect of integration
disappears. A market may become twice as big, but a firm’s share of this market is
divided by half because the number of equal competitors doubles. This is perhaps the
most crucial assumption of the model presented in the following Section. By
concentrating solely on the strategic intensity-of-competition effects of integration on
R&D, this paper formalises an alternative mechanism through which integration can
affect long run growth to the standard scale effects discussed above.
Before presenting the model, it is useful to consider the legitimacy of modelling
integration in this non-standard way. The simplest justification is to think of
integration as being a standardization process. For example, European integration may
involve the standardization of electrical products to common European specifications.
The benefit of this interpretation is that it requires no leap of imagination to swallow,
although there is a cost in terms of the narrowness of the integration concept.
integration can be thought of in much broader terms. Danthine and Hunt (1994) warn
that we should not take it literally that integration manifests itself as a change in
consumer preferences. However, from the producer’s point of view, it is as if
integration has caused preferences to shift. Consumers pay more attention to goods
sold by foreign producers. Market shares become more sensitive to price differentials
as competition is intensified. A simple example is presented below in order to clarify
this concept.
Imagine two supermarkets, far enough apart so that consumers living near one cannot
walk to the other costlessly and vice versa. This would manifest itself as if the food
products offered by the two supermarkets were not close substitutes in preferences,
with the supermarkets having monopoly power over the consumers living at their end
of town. Overall market share would be insensitive to the prices set in the other
supermarket at the other end of town. Now consider a reduction in the barriers to
trade, such as the introduction of a free bus service between the supermarkets.
Consumers could now shop at either supermarket costlessly, which would manifest
itself as if the products offered by the supermarkets were closer substitutes. The
market share of each supermarket would now be much more sensitive to the price
setting of the other supermarket. Intuitively, we can consider integration in this way.4
4 A companion paper reworks the model of Section 3, for the symmetric competitive case, with
integration modelled in the more standard way as falling tariffs. The fundamental results of the
3: A Two-Country Duopoly Model of Integration with
Process Innovation
At the expense of a modicum of generality, the following model allows the intensity of
competition effects of integration on R&D to be formalised in a very simple way. The
stylized nature of the model does not detract from the potential of its conclusions,
however. It is left to further research to relax some of the more extreme assumptions in
order to generalise the model’s predictions. In the light of this, the model should be
seen as a first step in formalising the intensity-of-competition effects of integration on
growth through R&D, rather than an end product. This step is made all the more
important given the continuing lack of convincing evidence for scale effects, such as
those suggested by Rivera-Batiz and Romer (1991).
Consider an industry consisting of two firms, each producing a single differentiated
good. Assume for now that entry into the market is impossible, due to, say, high fixed
costs that have been paid in the past by the incumbents. This assumption simplifies the
analysis, allowing the isolation of integration effects through intensity of competition.
Imagine that the first firm is located in the first of the two countries and that the other
is located in the second country. As in Rivera-Batiz and Romer (1991), consider only
similar countries, so avoiding any question of comparative advantage.5 With this
approach, the existence of these countries is not explicitly modelled, and there is no
5 Section 4 relaxes this assumption to allow technological superiority in one of the countries. All else is
explicit modelling of international trade.6 However, thinking of the market for the two
goods as being made up of these two countries allows a significantly different
interpretation of an otherwise fairly standard differentiated duopoly model. Integration
is modelled as an increase in the elasticity of substitution in consumer preferences
between the two goods, which is assumed to be exogenous.
Identical consumers across both countries have Cobb-Douglas preferences over a
composite of the R&D goods and a non-R&D competitive good. They therefore spend
a fixed proportion of their income, m, on the two goods, i and j, which they do
according to the constant elasticity of substitution (CES) utility function given by
equation (4).
U(qk) = {qik(θ-1)/θ + qjk(θ-1)/θ}θ/(θ-1), for all θ>1, for consumer k. (4)
The parameter θ is the elasticity of substitution in preferences between the two goods.
Consumers divide their lump of income, m, between the two goods, giving us a
representative consumer’s demand for each good, as given by equation (5).
qik(p,m) = mpi-θ/(pi1-θ + pj1-θ), and similarly for good 2. (5)
The demand curves (6) facing each firm can be found by summing over all consumers,
where ‘a’ denotes the aggregate of the m’s. The resulting non-linear specification of
6 All that is required is some way of differentiating between consumers located close to the producer of
good 1 and consumers located close to the producer of good 2, whether geographically, or in some other
the demand curve does not share the shrinking market effect of Qui (1994) and Bester
and Petrakis (1993) and is therefore more suitable for a study of economic integration.
Increasing the elasticity of substitution makes market share more sensitive to price but
does not reduce market size.
qi = api-θ/(pi1-θ + pj1-θ). (6)
Costs of production are linear and given by:
Ci(qi) = ciqi. (7)
Firms may invest in deterministic R&D which results in process innovation, reducing
unit costs by f(Xi), where Xi denotes the effective level of research, given by (8), with
xi being firm i’s investment in research and β being the spillover parameter between
firms, 0≤β≤1, assumed to be exogenous.
(3.8): Xi = xi + βxj,
This set up for R&D is an extension of that of D’Aspremont and Jacquemin (1988)
and Kamien et al (1992). Following these earlier papers, I assume f(Xi) to be concave,
and more precisely to be defined as:
Therefore R&D displays diminishing returns. D’Aspremont and Jacquemin (1988) cite
Dasgupta (1986) as evidence in support of such a concave R&D function. The extent
to which costs can be reduced through R&D is also related to the level of initial costs.
In other words, it gets more difficult, in absolute terms, to reduce unit costs through
time. This assumption is necessary in order to ensure a constant growth rate in the
extension to the model presented in Section 5.7
Firms play a two-stage game. First they determine R&D expenditure, x, which
determines unit costs for stage 2 in which there is Cournot competition.8 Three
alternative scenarios are considered. First, firms have identical initial production costs
and compete in both stages of the game. This case is worked through in Section 3.1
below. An interesting extension of this case is presented in Section 3.3, where
spillovers and integration are related. Secondly, firms with identical unit costs
compete in the product market but can co-operate in the R&D stage. This is shown in
Section 3.2. Thirdly, I consider the case where one firm has an initial cost advantage,
due, for example, to a higher level of innovation historically. The first two scenarios
can be solved analytically. The third is solved numerically in Section 3.4. In all cases,
the model is treated simply as a one-shot game.
3.1: R&D Competition with Identical Unit Costs
7
It is not necessary to obtain the partial equilibrium results, however. An earlier version of the model
assumes f(Xi) = Xi
1/2
and the same pattern of results is obtained (see McVicar, 1998).
8 I am implicitly assuming there is no difficulty in obtaining funding to carry out R&D from retained
Equation (9) assumes both firms have the same R&D opportunities, being in the same
industry, and that they face the same R&D function, which follows from the
assumption of similar countries. These symmetry assumptions lead us naturally to a
symmetric equilibrium.
Consider the stage 2 output decision In the second stage, firm i finds its profit
maximizing level of output, for a given level of R&D expenditure in stage 1. Total
costs are given by (10) and revenue, after first inverting the demand curve, by (11).
Hence profits are given by (11) – (10). The subscripts are not dropped from unit costs
at this stage for consistency with the asymmetric case outlined in Section 4.
TCi = (ci – f(Xi))qi + xi. (10)
TRi = a/ {(qj/qi)(θ-1)/θ + 1}. (11)
The marginal condition for firm i is given by (12), where φ = (θ-1)/θ.
ci – f(Xi) = [aφ(qj/qi)φ] / [qi{(qj/qi)φ + 1}2]. (12)
The Cournot model displays the standard downward sloping reaction curves, so the
two goods are strategic substitutes. Manipulation of equation (12) and the mirror
equation for firm j, gives us:
So, relative outputs just depend on initial costs and R&D expenditures. If a firm can
adopt a lower cost technology than its competitor, it can increase its market share at
the expense of the higher cost firm. Matters are further simplified here because initial
unit costs are assumed to be equal, so that output shares just depend on differences in
R&D expenditures. This is where the R&D incentive comes from in the model. The
incentive is purely strategic. No other R&D incentive exists.9
Substituting (13) into (12) gives us the firm’s profit maximizing level of output, as
shown in (14). Let F(X) denote [ci – f(Xi)] / [cj – f(Xj)].
qi = [aφF(X)φ] / [(ci – f(Xi){F(X)φ + 1}2]. (14)
Substituting (14) into the expression for profits (11)–(10), gives profits in terms of
R&D expenditure:
Πi = [a + (a/θ)F(X)φ] / [{F(X)φ + 1}2] – xi. (15)
In Stage 1, the firm sets the profit maximizing level of R&D expenditure, xi. Notice
that ∂Xi/∂xi = 1 and that ∂Xj/∂xi = β. Given that the model has been set up with
symmetry maintained throughout, there is nothing to make one firm’s R&D decision
any different to the other’s, so xi = xj. The first order conditions give us the following
expression for optimal effective R&D:
9 Because of the cost of R&D, in symmetric equilibrium, profits are decreasing in R&D expenditure. If
Xi1/2 = 1/2 ± [ {1 – a(1-β)(θ-1)/2θ}]/2. (16)
Second order conditions rule out the larger of these two solutions. So, the smaller of
the two solutions denotes profit-maximizing effective R&D level.
In order to ensure a non-negative expression in the square root, the parameters have to
obey the following condition:
1 ≥ a(1-β)(θ-1)/2θ. (17)
Rearranging gives us a condition linking the demand parameter, a, with the elasticity
of substitution, θ, as shown in (18):
θ≤ a/(a-2). (18)
The condition is binding when θ=a/(a-2). In other words, for the model to be valid,
a≥2. When a is close to 2, θ can be large. When a is large, θ must approach 1.
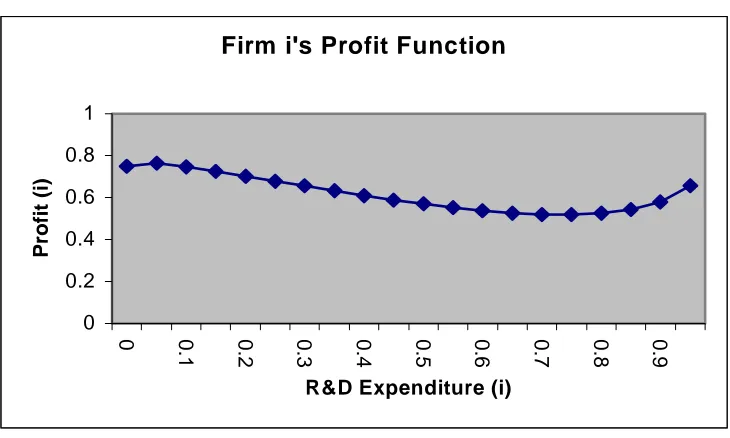
Figure 1 shows firm i’s profit function for a given level of firm j R&D expenditure.
The local maximum and minimum are clear. Note that profits tend to infinity as R&D
expenditure tends towards 1. However, this extreme scenario can be ruled out by
assuming there is some lower bound on post-R&D costs at all times: xi<0.25, for
example.
∂(Xi1/2)/∂θ = a(1-β)/{8θ2 [1 – a(1-β)(θ-1)/2θ]}, (19)
which is positive for all β<1. So, integration, as measured by an increase in the
substitutability parameter, θ, leads monotonically to a higher level of effective R&D
for any given level of spillovers. Therefore firms’ expenditure in R&D is increasing
with integration.
R&D increases with integration at a decreasing rate the more integrated the industry
becomes. There is no shrinking market effect, so integration has no negative effect at
low levels of integration, such as that found by Qui (1994). As expected, a firm closely
integrated with its competitor loses a big slice of its market share if its price is
undercut. Equally, it can steal a big slice of its competitor’s market share if it can
undercut its price. These effects are much more muted when substitutability is low.
Although R&D is expensive, and although cost reduction is of no benefit to the firm
when matched by its competitor, these strategic incentives to carry out R&D result in a
situation where both firms invest more and more the more integrated the industry
becomes.10
What of the effect of spillovers on R&D? From (16) it can be seen that:
Given θ>1, the expression in (20) is negative. In other words, effective R&D and
firm’s own R&D are decreasing with spillovers. This is a common result for this kind
of model (see, for example, D’Aspremont & Jacquemin, 1988). For higher spillovers,
investment in R&D lowers the competitor’s costs and this increases the competitive
pressure on the firm. Also for high spillovers the firm may be tempted to free ride on
its rival’s R&D expenditure. Both these factors act to lower R&D expenditure. These
factors outweigh the positive spillover effect on effective R&D from (8) at all
parameter values. In the extreme, with perfect spillovers, there is no R&D carried out
at all, since no strategic advantage can be gained.
The negative spillover/R&D relationship is stronger the higher the value of θ. In other
words, the more intense is the competition between the firms, the stronger the
disincentive effect of spillovers on R&D expenditure. As discussed in Section 2, it is
more of a disincentive to lower a direct competitor’s costs than a distant competitor’s
costs.
3.2: R&D Co-operation with Identical Unit Costs
Consider the co-operative research scenario, where firms set R&D expenditure to
maximise total industry profits in the first stage, but still compete in the product
market in the second stage. This corresponds to D’Aspremont and Jacquemin’s second
case (D’Aspremont & Jacquemin, 1988) and case C of Kamien et al (1992). This is
probably the most realistic scenario of co-operative research since antitrust legislation
does not generally encourage product market co-operation but, certainly in Europe,
10 The Single European Market (SEM), if modelled in this way, should lead to higher technology levels
does allow for co-operative R&D in many cases (see Jacquemin, 1988, for an
informative discussion of EC Antitrust Law).
Profit maximizing output is given by (14), since firms still compete in the second
stage. In (15), firms now maximise Πtotal = Π1 + Π2, with respect to research
expenditure, xi. Solving this gives us the corner solution of ∂Πtotal/∂xi = -1. In contrast
to the competitive scenario, there is no longer any strategic incentive to invest in R&D
so firms do not conduct any R&D. Firms prefer to co-operate and hold back
innovation, since they save themselves wasted R&D costs.11 For a given level of
spillovers, integration increases the profit-gap between the co-operative R&D and
competitive R&D scenarios, and therefore increases the incentives to co-operate in
R&D. Katz (1985) makes a similar prediction for firms producing a homogenous good
under Bertrand competition.
3.3: Integration and Spillovers
Section 2 introduced the possibility of a positive relationship between integration and
spillovers. For example, Grossman and Helpman (1991) argue that increased trade
between countries will involve increased interaction between agents in different
countries and therefore more opportunity for knowledge to pass from agent to agent.
Equally, increased trade might lead to more opportunities to reverse engineer technical
products. Empirical evidence for such a relationship is strong (see Coe and Helpman,
1995, for example).
11 There will, however, be an incentive for firms to cheat on the agreement and lower unit costs
unilaterally in order to capture a bigger market share. This may make such agreements unstable in the
In the current model, this spillovers/integration relationship can be captured by a
simple function, such as (21), where 0≤g(θ)≤1.
β = g(θ), (21)
with g’(θ)>0, g’’(θ)<0 and g(θ)→0 as θ→1.
In other words, a reduction in product differentiation makes it easier for a firm to
apply any process innovation by its competitor to its own production process.
Substituting (21) into (16) and differentiating with respect to θ gives us the following
expression for the effect on R&D of integration:
∂(Xi1/2)/∂θ = {a/8 [1 – a(1-g(θ))(θ-1)/2θ]}.{(1-g(θ))/θ2 – g’(θ)(θ-1)/θ}. (22)
The first term is positive, as is the first term in the right-hand bracket. The second term
in the right-hand bracket is negative which gives us an ambiguous sign for the whole
expression. Sketching the relationship shows an inverted U-shaped relationship
between integration and effective R&D. With small θ (ie: a high degree of product
differentiation), integration leads to a higher level of R&D expenditure. With large θ
(ie: a low degree of product differentiation), further integration leads to a lower level
There is therefore an optimal level of integration at which the negative spillover effect
and positive competition effects are balanced.12 This is given by the stationary point of
the expression in (22), as shown in (23).
θ*g’(θ*)(1-θ*) – g(θ*) + 1 = 0. (23)
Imposing a simple form on function g that meets the conditions outlined in (21) can
give us an illustrative optimum integration level. Take the example of g(θ) = 1-1/θ. In
this case (23) solves for an optimum integration level of θ*=2. Of course, this is all
somewhat stylized. Nonetheless, the suggestion that the interaction of a negative
spillover effect on R&D incentives and a positive strategic effect on incentives might
give rise to such a non-linear integration/R&D relationship purely through intensity of
competition effects is potentially very interesting. If the prediction is robust to
generalization of the model in further research, then there may be significant
implications for trade policy.
4: R&D with Asymmetric Initial Unit Costs
The results so far have assumed all is symmetric in the model. This means that firms
cannot start with a cost advantage, or build such an advantage by their R&D efforts.
Also, all the potential benefit in terms of profits from R&D is lost when any cost
reduction is matched exactly by the competition. Now consider relaxing the symmetry
assumption to allow one firm to have an initial cost advantage, due to, say, historical
innovation in cost-reducing processes. Are the relationships between integration,
spillovers and R&D robust to this change? I consider only R&D competition in this
case, leaving aside any question of co-operation. The model is also only considered
explicitly as a one-shot game.
The model is exactly the same as that set out in Section 3 except that initial unit costs
are not the same for each firm. This means a crucial simplifying assumption is lost at
the profit maximizing stage, and the system of non-linear equations, given by
maximising (15), can no longer be solved analytically. However, solving the model
numerically is relatively straightforward.13
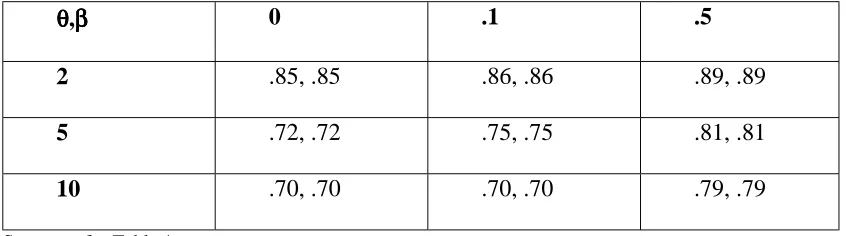
Results are presented below, in Tables 1 and 2, for the case where firm 1 has initial
unit costs equal to 1.005 and firm 2 has initial unit costs equal to 0.995. In other
words, firm 2 has a slight initial cost advantage. The other parameters are set as a=2,
β=0, 0.1 and 0.5 and θ=2, 5 and 10. These are chosen as plausible values for zero, low
and high spillovers and low, medium and high substitutability. Three points in each
range is sufficient to see the pattern of solutions emerge. As long as the parameter
values chosen fall within the range determined by the condition θ≤a/(a-2), the pattern
of the numerical results is consistent with alternative sets of parameter values outside
these ranges.
In the asymmetric case, the high cost firm engages in significantly more R&D than the
low cost firm, for all permitted parameter values. In other words, the initial cost gap
gets endogenously smaller through profit maximising R&D. In fact, the higher R&D
expenditure of the high cost firm is always sufficient to equalise post-innovation unit
costs, as shown in Table 2. The symmetric equilibrium presented in Section 3.1 is
13
therefore stable, so that a shock to one of the firm’s cost levels is absorbed by the
model and the symmetric equilibrium reverted to in a single period. This result is
driven by the fact that R&D expenditure is more effective in reducing costs for the
high cost firm (from Equation (9)) until technology levels are exactly equalised.14
Since the benefits to R&D are largely competed away, the low cost firm prefers to
save on R&D costs when it can.
Bester and Petrakis (1993) find the opposite result for firms with asymmetric costs, ie:
that the low cost firm invests more in R&D than the high cost firm, making the cost
gap endogenously wider. This is likely to be the result of the fact that the marginal
returns to investment in R&D in the Bester and Petrakis model are increasing over
time, as cost reduction is absolute rather than proportional to initial unit costs as in the
current model. In other words, the marginal return to R&D is higher for the low cost
firm. An alternative version of the current model, with a different specification for
Equation (9), where cost reduction does not depend on the level of unit costs, but
where all else is unchanged, leads to the same prediction as the Bester and Petrakis
model (see McVicar, 1998).15 Despite obtaining the opposite prediction concerning the
evolution of the technology gap using the two alternative specifications for (9), the
effects of increasing integration and increasing spillovers are the same in both cases.
The current specification for Equation (9) is preferred to the alternative for the
stability property of the symmetric equilibrium and to give a constant growth rate in
the extension to the model outlined in the following section.
14 The single-period reversion to symmetric equilibrium is a reflection of the one-shot nature of the
model and the small size of the initial cost difference. Making the game dynamic, with a larger cost
How does R&D expenditure relate to the degree of integration and the level of
spillovers? Firstly, R&D expenditure is everywhere decreasing with spillovers, as in
the symmetric case. This is unsurprising, since the intuition applies equally to both
scenarios. More interestingly, the ratio of high cost to low cost firm R&D expenditure
is higher when spillovers are larger, in all cases. In other words, the higher the level of
spillovers, the more benefit of the low cost firm’s R&D expenditure acts to narrow the
technology gap, so the less inclined to invest in R&D it is. The relationship between
integration and R&D expenditure is similar in the asymmetric case to that in the
symmetric case. In other words, R&D increases at a decreasing rate with integration
for both firms. The negative spillover incentives and positive intensity of competition
incentives are therefore robust to alternative specifications for initial technology
levels.
5: A Symmetric N-Sector Extension
A simple extension to the model of Section 3.1 allows the economy-wide growth rate
at a given point in time to be calculated. This is intended to be illustrative of the
potential of the model, rather than being a serious contender for a model of
endogenous growth and integration in its own right. This is left for further research.
The predictions of the partial equilibrium model carry over to the simple general
equilibrium model. This has significant implications for the growth/integration
literature. Foremost of these is that it is possible for integration to increase the growth
rate in a simple R&D-based endogenous growth model, without relying on scale
15
Cost reduction is defined as f(Xi) = Xi
1/2
effects, but purely through the effects of the intensity of competition on R&D
incentives.
Assume there are a fixed number, N, of sectors, all differentiated duopolies, with one
firm in each sector in each country as before. The goods are differentiated both
between and within sectors. Cobb-Douglas preferences across sectors ensure a
constant proportion of consumer’s income is spent on the goods from each sector. Two
assumptions allow us to focus on a single representative time period and to apply
directly the results of Section 3.1. Firstly, discounted utility and profit functions are
additively separable for each period. Secondly, the countries, sectors and firms are all
symmetric and all are integrated to the same degree at any one time. Relaxation of this
additional symmetry assumption is left for further research. By making this
assumption, a common θ is imposed.
Each individual sector is set up as before. A labour endowment, L, is introduced for
each country, being the only factor used in production. Innovation can now be thought
of as labour saving. Assuming equal sized sectors, with market clearing wages, each
firm uses L/N units of labour. The unit cost of production can now be thought of as the
amount of labour needed to produce a single unit of output multiplied by the wage,
giving total costs as in (24).
TCi = qi(ci-f(Xi))wi – xi, (24)
where notation carries through from Section 3 and wi is the wage paid to workers in
Total revenue for firm i is given, as before, by equation (11), where firms i and j are
two firms in a given sector. Profit maximizing output in Stage 2, for given R&D, is
therefore given by the marginal condition (25).
qi = [aφF(Xi)φ] / [wi(ci–f(Xi)){F(Xi)φ+1}2]. (25)
Note that φ=(θ-1)/θ, as before. The only difference in notation is that F(Xi) now
includes a term for relative wages, ie: F(Xi) = wi(ci-f(Xi))/wj(cj-f(Xj)).
Country output is given by Nqi. Given the (unchanged) symmetric equilibrium R&D
expenditure from equation (16), and given all else is symmetric, wi=wj and F(Xi)=1.
Therefore (25) simplifies to:
q = aφ/4w(c-f(X)). (26)
Firm output is increasing in the demand parameter and the substitutability parameter,
and decreasing with the wage and unit costs. The labour demand equation gives us a
second expression for q:
q = L/N(c-f(X)). (27)
Equations (26) and (27) solve for the symmetric equilibrium wage, given by (28):
Equilibrium wages are increasing in the demand parameter, the elasticity of
substitution and the total number of sectors, N and decreasing with the size of the
labour force. Substituting (28) back into (26) gives country output, Y:
Y = L/(c-f(X)). (29)
Costs are reduced in period t, consisting of the research and production stages, through
innovation, by f(X). If initial costs at the start of period t are labelled as c then starting
costs in period t+1 are c-f(X). So, from (29):
Yt = L/c and Yt+1 = L/(c-f(X)). (30)
The growth rate of country output, for given t, is therefore given by (31).
(Yt+1 – Yt)/Yt = {[L/(c-f(X))] – [L/c]} / [L/c]. (31)
Equation (31) simplifies to the following per capita growth rate:
g = [c/(c-f(X)] – 1. (32)
Therefore, unsurprisingly, growth is increasing in R&D. It is a small step to substitute
the expression for f(X) from (16) into (32) to give per capita growth as a function of
g = 2/[1 + {1 – a(1-β)(θ-1)/2θ}] – 1. (33)
So, per capita growth is a function g(a,β,θ) with g’(a) and g’(θ) > 0, and g’(β) < 0.
Growth is driven purely by the endogenous R&D decisions of profit maximising
firms. The growth rate is positively related to the degree of integration, solely because
of the intensity of competition effect. Although there are scale effects in the model,
given by the positive relationship between g and a, this integration/growth result is not
related to scale, as the parameter a is assumed constant. In other words, the model
shows how the intensity of competition effect of economic integration can be used to
obtain a non-scale endogenous growth effect of integration. The intuition for this
result and the other results given by (33) is the same as that discussed in Section 3.
Holding all other parameters constant, the productive capability of the whole economy
grows over time. In fact, the economy displays a constant growth rate, given by:
g = [2/(1+η)] – 1, (34)
where η≤1.
6: Summary and Concluding Remarks
This paper considers the effects of economic integration on a firm’s incentives to
innovate starting from the viewpoint of the IO literature concerning innovation and
market structure. A model is set up of an industry consisting of two competing firms
spillovers. Increased competition resulting from integration makes a firm’s market
share more sensitive to prices. A symmetric equilibrium results where R&D is
increasing with integration. This is because of intensified strategic incentives to both
steal the competitor’s market share and to protect own market share. In addition, two
special cases of the model are considered. If firms are allowed to co-operate in R&D,
the strategic incentives are removed and R&D stops. Secondly, if spillovers are
positively related to the degree of integration, then an inverted U-Shaped relationship
between integration and R&D is the result, with an optimal level of integration.
Finally, the model is extended to an n-sector two-country economy that displays a
constant growth rate. This growth rate increases with integration.
Existing models explaining possible mechanisms for a positive link between growth
rates and integration are generally driven by improved R&D performance resulting
from the scale effects of increasing market size and access to a wider stock of
technical knowledge (eg: Rivera-Batiz and Romer, 1991). This paper sets up a model
where increased strategic incentives to innovate provide an alternative mechanism to
these scale effects through which integration can stimulate R&D.
The model is consistent with the weight of the empirical evidence in the IO literature
suggesting a positive relationship between competition and innovation. By adopting a
simple extension, the model can also be made consistent with the kind of non-linear
relationship found by Scherer (1967). The intensity of competition effects described
here may be small compared to the demand-pull and technology-push effects, which is
Of course, given the somewhat stylised nature of the model, the results should be
treated with caution. This paper is intended as a starting point for further research,
which can move towards generalising the model. It would be interesting to see if the
results hold when the model is extended to an explicit dynamic framework on which a
more solid growth model could be built. Alternative forms of competition and
innovation (eg: Bertrand and new product) may lead to different conclusions. Clearly
this line of research has potential for development.
References
Aghion, P. and Howitt, P. (1998), Endogenous Growth Theory, MIT Press.
Beath, J., Katsoulacos, Y. and Ulph, D. (1994), Strategic R&D and Innovation, in
Current Issues in Industrial Economics, MacMillan.
Bester, H. and Petrakis, E. (1993), The incentives for cost reduction in a differentiated
industry, International Journal of Industrial Organization, 11, 519-534.
Bozeman, B. and Link, A. (1983), Investments in Technology: Corporate Strategies
and Public Policy Alternatives, NY, Praeger.
Brander, J. and Spencer, B. (1983), Strategic commitment with R&D: The symmetric
case, Bell Journal of Economics, 14, 225-235.
Coe, D. and Helpman, E. (1995), International R&D spillovers, European Economic
Review, 39, 859-887.
Cohen, W. and Levin, R. (1989), Empirical studies of innovation and market
Structure, in Schmalensee, R. and Willig, R. (eds), Handbook of Industrial
Organization, Volume II.
Danthine, J. and Hunt, J. (1994), Wage bargaining structure, employment and
economic integration, Economic Journal, 104, 528-541.
Dasgupta, P. (1986), The theory of technological competition, in Stiglitz, J. and
Mathewson, F. (eds), New Developments in the Analysis of Market Structure,
Cambridge, MIT Press.
Dasgupta, P. and Stiglitz, J. (1980), Industrial structure and the nature of innovative
activity, Economic Journal, 90, 266-293.
D'Aspremont, C. and Jacquemin, A. (1988), Co-operative and non co-operative R&D
in duopoly with spillovers, American Economic Review, 78, 1133-1137.
Grossman, G. and Helpman, E. (1991), Trade, Knowledge Spillovers and Growth,
European Economic Review, 35, 517-26.
Grossman, G. and Shapiro, C. (1987), Dynamic R&D competition, Economic Journal,
Harris, C. and Vickers, J. (1987), Racing with uncertainty, Review of Economic
Studies, 54, 1-21.
Horowitz, I. (1962), Firm size and research activity, Southern Economic Journal, 28,
298-301.
Jacquemin, A. (1988), Co-operative agreements in R&D and European antitrust
policy, European Economic Review, 32, 551-560.
Kamien, M., Muller, E. and Zang, I. (1992), Research joint ventures and R&D cartels,
American Economic Review, 82, 1293-1306.
Katz, M. (1985), An analysis of co-operative research and development, Rand Journal
of Economics, Winter 1985, 527-543.
Mansfield, E. (1968), Industrial Research and Technological Innovation: An
Econometric Analysis, NY, Norton.
McVicar, D. (1998), Strategic R&D and Economic Integration, Mimeo, University of
Southampton, May 1998.
McVicar, D. (1999), R&D in a two country differentiated duoploy with tariff
Miyagiwa, K. and Ohno, Y. (1997), Foreign technology, spillovers and R&D policy,
International Economic Review, 38, 2, 405-430.
Ordover, J. and Willig, R. (1985), Antitrust for high technology industries: Assessing
research joint ventures and mergers, Journal of Law and Economics, 28, 311-333.
Phillips, A. (1966), Patents, potential competition and technical progress, American
Economic Review, 56, 301-310.
Qui, L. (1994), R&D investment and product differentiation: Cournot vs Bertrand
competition, Mimeo, Honk Kong University of Science and Technology.
Rivera-Batiz, L. and Romer, P. (1991), Economic Integration and Endogenous
Growth, Quarterly Journal of Economics,106, 531-555.
Romer, P. (1990), Endogenous Technological Change, Journal of Political Economy,
98, No. 5, S71-S102.
Scherer, F. (1967), Market structure and the employment of scientists and engineers,
American Economic Review, 57, 524-531.
Schmookler, J. (1966), Invention and Economic Growth, Cambridge MA, HUP.
Sutton, J. (1996), Tehnology and market structure, European Economic Review, 40,
Williamson, O. (1965), Innovation and market structure, Journal of Political
Figure 3.1: Firm i’s Profit Function.
Notes: The above function is Equation (15) for parameter values a=2, θ=2, β=0 and xj=.1.
Firm i's Profit Function
0 0.2 0.4 0.6 0.8 1
0 0.1 0.2 0.3 0.4 0.5 0.6 0.7 0.8 0.9
R&D Expenditure (i)
Table 1: R&D Expenditure with Asymmetric Initial Unit Costs
θθθθ,ββββ 0 .1 .5
2 .027, .018 .021, .016 .010, .005
5 .080, .075 .060, .055 .028, .020
10 .094, .090 .090, .085 .034, .025
Notes: Values of θ=2,5 and 10 represent low, medium and high elasticity of substitutability
respectively, and therefore low, medium and high levels of integration. Values of β=0, .1 and .5
represent zero, low and high spillovers. Figures for firm 1 (the high cost firm) are on the left of each
[image:39.595.114.529.99.219.2]Table 2: Stage 2 Unit Costs with Asymmetric Initial Unit Costs
θθθθ,ββββ 0 .1 .5
2 .85, .85 .86, .86 .89, .89
5 .72, .72 .75, .75 .81, .81
10 .70, .70 .70, .70 .79, .79