Measuring Complexity of System/Software
Architecture Using Higraph-Based Model
Hycham Aboutaleb*, Bruno Monsuez
Abstract—The exponential growing effort, cost and time investment of complex systems in modeling phase emphasize the need for a methodology, a framework and a environment to handle the system model complexity. For that, it is necessary to be able to measure the system model complexity. This paper highlights the requirements a model needs to fulfill to match human user expectations. It suggests a hierarchical graph-based formalism for modeling complex systems and presents transformations to handle the underlying complexity. Finally, a way to measure complexity based on Shannon theory of information is proposed and applied to an example.
Index Terms—Higraph, Complexity, Graph transformations, System Modeling.
I. INTRODUCTION
S
INCE the introduction of System Engineering in industry model-based development has been adopted more or less in development of complex systems. A model has a clear purpose: to help designing the system of interest. Modelers must exclude all factors not relevant to the problem to ensure the project scope is feasible and the results timely. The value of the modeling process begins early on, in the problem definition phase. The modeling process helps focus diagnosis on the system of interest.Given the limited cognitive capabilities of humans, we use models of the properties of the system and its context/environment that are of relevance and interest, and disregard details considered irrelevant for the system design and development. A model is thus a deliberate simplification of reality with the objective of explaining a set of selected properties of the real system that is relevant for the purpose of its development. This model starts first with a mental process to capture relevant information, then the information captured is expressed through means to be communicated. This information is the minimum information necessary to have a satisfactory understanding of the perceived real system and environment.[1]
Systems are inherently complex. However, to fully understand a system without reaching human mind limitations, it is necessary to handle this complexity. This system real complexity is indeed reflected in the corresponding system model. In fact, the system perceived complexity is the model complexity. To obtain a model that istrustworthy,understandable, anduseful, it is necessary to architecture the complexity. As it is described in [2], there is a form of organized complexity in systems.
Hierarchically flat representations, as graph-based models, are more prevalent in the modeling of systems. They are
* ENSTA ParisTech, Computer and System Engineering Department, 91120 Palaiseau, France, [email protected]
now a natural approach to a large family of problems. Moreover, the graphs remain intuitive on all problems of small size, they can be represented and manipulated graphically, which gives a quick overview of the situation. Unfortunately, when systems size increases, it becomes difficult to navigate quickly in such a representation, where all the information is placed at the same level, even if they are really useful in the subparts of the overall system. A graph with a large number of variables can be visually incomprehensible.The approach divide and conquer can then separate a complex system into simpler subsystems and thus return to a viewable representation of parts of more reasonable size.
This paper presents how to organize a system model to handle the complexity issue. It first introduces general concepts to address this issue. Then it presents a formalism for a higraph-based model that will be used in this paper for system modeling. Necessary graph-based transformations that apply general concepts are also presented. Finally com-plexity is evaluated using Shannon’s entropy and Information theory.
II. MODELCOMPLEXITY ANDHIERARCHY
To handle large amounts of data, it is often useful to have a classification or an order. One effective way to classify a set of elements is to use a hierarchical organization of this set of elements, introducing sometimes a new order relations among the elements. With the hierarchy, in addition to be able to handle elements together, it becomes possible to handle subsets of elements together. There are two ways how to organize hierarchically a set: grouping and encapsulation.
• It is possible to group items based on similar properties
or characteristics.
• It is possible to encapsulate many elements within a single element of a higher level and then consider only the properties of this element when an analysis is performed.
Therefore, to handle complexity of the real system, its model should be the result of a simplification strategy consisting in:
• Conceptual chunking: refers to the formation of a higher-level concept that captures the essence of the problem-at-hand and reduces the complexity by omit-ting irrelevant detail and reducing its dimensionality [3].
isolation, in order that the capacity limitations of the human mind are avoided.
Consequently, we can indentify two types of models hierarchies. On one hand, there is the generalization, i.e. hierarchy of types. The word type refers generally to a representation that gather main properties of objects that have common characteristics [4]. One type allows to group elements with common characteristics. The mechanism of subtyping induces a hierarchy: an entity type T2, derived from type T1 has at least all the properties of an entity typeT1. On the other hand, there isaggregation. The word aggregationrefers generally to a representation that gathers elements into another higher-level element to hide them when necessary. The higher-level element that encapsulates its contained elements has properties that are the emerging properties at this level due to the contained elements. Other names like nested hierarchy or container hierarchy are also common Encapsulation decreases the complexity of the system model [5]. Finally, the hierarchy has an additional advantage: depending on the selected level, it is possible to observe different points of view.
III. HIGRAPH-BASEDMODEL
Based on literature and industrial experience, a set of system modeling requirements have been identified.
1) Simplicity: The language shall be simple, with few basic concepts [6], [7]. It should be straight-forward to determine what a model element represents. 2) Visual, graphical language: The language shall allow
a visual, graphical depiction of the model, giving both an overview of the whole system and details about its parts [7].
3) Visual flexibility: The language shall allow to modify the graphical properties of the elements represented in the model if necessary (for example to highlight elements) [8]
4) Semantic Preciseness: Since models have many users and uses, they shall be precise and unambiguous. Any ambiguity will lead to errors, confusion and conse-quently to increased cost[9].
5) Compositionality: Modeling languages shall allow composition of models from parts [10].
Graphs have been naturally used to represent and model problems since the emergence of computer science. Graph-based models give a visual and intuitive representation, as well as with required accuracy. They are a well-suited means to describe in a natural way all kind of systems, where nodes describe system entities and edges describe relations between them [11].
A higraph is a graph extended to include notions of depth and orthogonality and was introduced by Harel in [12], [13]. In other words:
Higraph=Graph+Depth+Orthogonality
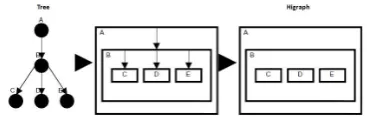
[image:2.595.334.518.53.114.2]Definition 1 (Higraph). A higraph is a quadruble H = (B,E, ρ,Π)where :
Fig. 1. Developing a Higraph from a Tree
• Bis the set of blobs (or nodes);
• E is the set of edges.
• ρis the hierarchy function. It assigns to each blobb∈ B its set of sub-blobsρ(b)
• Πis the orthogonality (or partitioning function) defined
as Π : B → 2B×B, associating with each blob b ∈ B some equivalence relationπ(b)on the set of sub-blobs,
ρ(b).
By its definition, the depth, shown by a higraph is defined by the enclosure of one node within another. Thus, it is possible to develop a higraph from a tree. The higraph in Figure 1 shows the same information as the tree in Figure 1. Besides, a node might have more than one parent.
To apply the general concepts defined previously, we need to define higraph-based transformations that will fulfill these concepts expectations.
First, we need to define the Type HigraphMΠ associated to the Higraph M. To achieve this it is necessary to define firstgeneralization.
Definition 2(Generalization). LetMΠ= (BMΠ, EMΠ, ρ,Π)
be a Type higraph. LetM = (BM, EM, ρ,Π) be a higraph. Letg:M →MΠa morphism that associates to each element
xof the higraph to its type, withMΠ, the Type Higraph, x
ofM to its type. We have:
• ∀x∈M, g(x)∈MΠ;
• ∀x∈M, g(ρ(x))⊂ρ(g(x));
• ∀t∈MΠ, g(πt(x))∈ρ(t).
Besides, MΠ = (BMΠ, EMΠ, ρ,Π) have the following
properties:
• EMΠ =∅, i.e. there is no edge;
• ∀x ∈ BMΠ, π(x) = ρ(x), i.e. all elements are of the
same type.
Now we define the function aggregation. This allows a higher-level element to encapsulates its contained elements while having its properties that are the emerging properties at this level due to the contained elements.
Definition 3 (Aggregation). LetM be a Model higraph. Letxbe a model node.
Letyi be model nodes such that yi∈ρ(x).
The aggregation functionfagg maps a set of elementsyi to a single elementx.
fagg:M →M such thatfagg(y1, . . . , y|ρ(x)|) =x.
inverse function is thedecomposition function.
Definition 4 (Decomposition). Let M be a Model higraph. Letxbe a model node.
Letyi be model nodes such thatyi ∈ρ(x).
The decomposition function fdec maps a single element x to a set of elements yi.
fdec:M →M such thatfdec(x) =x, y1, . . . , y|ρ(x)|.
This function is used to represent an object as a glass box, i.e. with its children elements.
IV. COMPLEXITY ANDENTROPY
A. Shanon Entropy
Statistical theory of information, as developed by Shannon [14], is an answer to the question: given a set of messagesmi each of which occurs with probabilitypi, what is the amount of information they convey. The first step is the determine the amount of information provided by a single messagemi, which is:
I(mi) =−log2pi
Definition 5 (Shannon’s entropy). Let then X be a set of discrete random variables with valuesx1, x2, . . . , xnwithxi having probability pi,(1≤i≤n)Shannon’s entropyH is defined as:
H(X) =−
n X
i=1
pilog2pi .
Consider a set S containing NS states. We can split S into k independent subsets such that (Figure 2):
S=Sk
iSi, Si 6=∅,∀iandNS = Pk
i=1NSi
The probability of a state x belonging to Si is:
pi=p(x∈Si) =NSi/NS
The complexity of this system is thus:
H(S) =−
k X
i=1
pilog2pi =− k X
i=1
NSi/NSlog2(NSi/NS)
[image:3.595.47.285.479.657.2].
Fig. 2. Decomposing a set [15]
By changing the perspective from working with a large set S of NS individual states (x) to a collection of subsets containing a smaller number NSi of states (x ∈ Si), the
whole set complexity has been replaced with the probability weighted sum of the complexity found within each subset. This is a very powerful principle in design: a complex problem is decomposed into a set of smaller problems with smaller complexity. Besides, the global complexity is the same. Thus, we have:
H(S) =
k X
i=1
H(Si)
However, if the subsetsSi are not independent, we get:
H(S) =X
i
H(Si) + X
i,j
HhSi|Sji
B. Higraph Entropy
We use Shannon’s entropy as an indicator of the complex-ity. We get the entropy of the model higraphM as follows:
H =HB+HE+Hρ+HΠ
To evaluate the complexity of a higraphM, it is consequently necessary to get the complexity get each term separately.
• HB:
HB=H(B) =−log(1/|B|) = log|B|
• HE:
HE =H(E) =−2 log(1/|E|) = 2 log|E| It takes into account the head and the tail of the edge.
• Hρ:
Hρ relates to the number of hierarchical relationships between the elements of the model N. Multiple locations of an element, i.e. an element has several parents, are taken into account.
N = X
x∈M
|ρ(x)|
It is obvious that if there is no hierarchy,N =|B|, i.e. the diagram contains all the elements at the same level.
Hρ =−2 log(1/N) = 2 logN, (because of parent and child)
Hρ= 2 logN = 2 log( X
x∈B
|ρ(x)|)
• HΠ:
HΠ = H(MΠ), where MΠ is the Type Higraph associated to the higraphM.
We have:
H(MΠ) =H(BMΠ)+H(EMΠ)+Hρ(MΠ)+HΠ(MΠ)
. where
– H(BMΠ) = log|BMΠ|
– H(EMΠ) = 0
– Hρ(MΠ) = 2 log(Px∈MΠ|ρ(x)|)
– HΠ(MΠ) = 0
H(MΠ) = log|BMΠ|+ 2 log(
X
x∈MΠ
Thus, we get the entropy of the model higraph as follows:
H=HB+HE+Hρ+HΠ .
i.e:
H = log|B|+ 2 log|E|+ 2 log(P
x∈B|ρ(x)|)
+ log|BMΠ|+ 2 log(
P
x∈MΠ|ρ(x)|)
The objective is to decrease the entropyHwhile modeling a system.
V. EXAMPLE
[image:4.595.372.477.54.200.2]In this paper, we take the following example: an ATM machine. A detailed view of the attributes and functions for the hardware and software is shown (Figure 3). An ATM is of type System. It can contain elements of typesHardware or Software. Hardware may then contain elements of typesFunctions,Physical AttributesandLogical Attributes. Software may contain elements of types Attributes and Functions.
Fig. 3. Detailed system breakdown for an ATM Machine [16]
We now apply the aggregation transformation and obtain a top-level higraph representation for an ATM system structure composed of hardware and software (Figure 4).
We finally apply the generalization transformation and get the corresponding type higraph (Figure 5).
The entropy of the type higraphMΠ is:
H(MΠ) = log|MΠ|+ 2 log(Px∈MΠ|ρ(x)|)
H(MΠ) = log 7 + 2 log 5 = log 175 The entropyH of the modelM is
[image:4.595.354.498.231.489.2]H(M) =HB+HE+Hρ+HΠ
[image:4.595.81.258.348.563.2]Fig. 4. Top-level higraph representation for an ATM Machine [16]
Fig. 5. Type higraph for a System
• HB:
Elements are: ATM Hardware, ATM Software, Height, Depth, Width, Weight, Power Consumption, Physical Connector, Power Connector, Turn On, Turn Off, Mem-ory Usage, Disk Space Usage, Execute Program.
HB = log|B|= log 14
• HE:
There are no edges in the higraph. Therefore, we have:
HE= 0
• HMρ:
Hρ = 2 log( X
x∈M
|ρ(x)|= 2 log 12
• HMΠ:
HΠ= log 56 VI. CONCLUSION
Shannon’s information entropy can be used as an indicator of complexity. Its value depends on the amount of details, elements and relationships between them, as well as the number of hierarchy levels. As shown, according to Shannon’s information entropy, smaller sets mean less complexity. The choice of aggregation allows to deal with subsets separately to handle this complexity.
Handling complexity has impacts on the design whether it is cost, effort, planning or safety. However, the fact that there is little literature is mainly due to the fact that system architects use their intuition to measure and handle complexity. For models that are easily glanced at, they are able to measure if they are excessively complex or not [9]. For large models, complexity measure is useful to identify the most complex subsystems, since they are the ones that need the most attention due to their expected impact on the overall design. Many studies show that less complex systems are more likely to be more successful from a business point of view.
Proposed transformations enable to handle complexity of a higraph model, on one hand, by obtaining the associated type higraph and, on the other hand, by generating aggregated views that are more useful within human mind limitations. However, the way to organize elements at each level remains a challenge. In fact, too many levels with too few elements at each level would keep the same complexity but would be irrelevant: intricacy, i.e. amount of information per element, needs to be taken into consideration.[17]
REFERENCES
[1] A. Mostashari, “Stakeholder-assisted modeling and policy design process for engineering systems,” Ph.D. dissertation, MIT, USA, 2005. [2] H. A. Simon, “The architecture of complexity,” Proceedings of the American Philosophical Society, vol. 106, no. 6, pp. 467–482, 1962. [3] G. S. Halford, R. Baker, J. E. McCredden, , and J. D. Bain, “How
many variables can humans process?”Psychological Science, vol. 16, no. 1, pp. 70–76, 2005.
[4] L. Cardelli and P. Wegner, “On understanding types, data abstraction, and polymorphism,”ACM Comput. Surv., vol. 17, no. 4, pp. 471–522, 1985.
[5] V. Ahl and T. F. H. Allen,Hierarchy Theory - A Vision, Vocabulary, and Epistemology. Columbia University Press, 1996.
[6] A. Agostini and G. DeMichelis, “A light workflow management system using simple process models,”Computer Supported Cooperative Work, vol. 9, no. 3-4, pp. 335–363, 2000.
[7] M. Jaccheri, G. Picco, and P. Lago, “Eliciting software process models with the e3 language,”ACM Transactions on Software Engineering and Methodology, vol. 7, no. 4, pp. 368–410, 1998.
[8] H.-Y. B. Koo, “A meta-language for systems architecting,” Ph.D. dissertation, MIT, USA, 2005.
[9] M. J. Kinnunen, “Complexity measures for system architecture mod-els,” Master of Science in Engineering and Management, Mas-sachusetts Institue of Technology, 2006.
[10] B. C. Warboys, D. Balasubramaniam, R. Greenwood, G. N. C. Kirby, K. Mayes, R. Morrison, and D. S. Munro, “Collaboration and composition: Issues for a second generation process language,” in
Proceedings of the 7th European Software Engineering Conference. Springer-Verlag, 1999, pp. 75–90.
[11] L. Lambers, “Certifying rule-based models using graph transforma-tion,” Ph.D. dissertation, Technical University of Berlin, Germany, 2009.
[12] D. Harel, “Statecharts: A visual formalism for complex systems.”
Science of Computer Programming, vol. 8, no. 5, pp. 231–274, 1987. [13] ——, “On visual formalisms,”Communications of the ACM, vol. 31,
no. 5, pp. 514–530, 1988.
[14] C. E. Shannon, “A mathematical theory of communication,” Bell System Technical Journal, vol. 64, pp. 379–423,623–656, 1948. [15] B. R. Meijer, “Organization structures for dealing with complexity,”
Ph.D. dissertation, TU Delft, Netherlands, 2006.
[16] K. Fogarty, “System modeling and traceability applications of the higraph formalism,” Master of Science in Systems Engineering, Uni-versity of Maryland, 2006.
![Fig. 2.Decomposing a set [15]](https://thumb-us.123doks.com/thumbv2/123dok_us/419985.539570/3.595.47.285.479.657/fig-decomposing-a-set.webp)
![Fig. 4.Top-level higraph representation for an ATM Machine [16]](https://thumb-us.123doks.com/thumbv2/123dok_us/419985.539570/4.595.354.498.231.489/fig-level-higraph-representation-atm-machine.webp)