Original Article
Association between polycystic ovary syndrome (PCOS)
and
CYP11A1
polymorphism in Hainan, China:
a case-control study
Bao Shan
1, Long Zhou
2, Shuying Yang
1, Mengdan Yan
3, Zhimin Wang
1, Yongri Ouyang
3, Siqi Yao
1, Tianbo Jin
2,
Zhuori Li
4Departments of 1Gynecology and Obstetrics, 4Surgery, Hainan Provincial People’s Hospital, Haikou, China; 2School of Life Sciences, Northwest University, Xi’an, Shaanxi, China; 3National Engineering Research Center for
Miniaturized Detection Systems, Xi’an, China
Received October 15, 2015; Accepted November 28, 2015; Epub January 1, 2016; Published January 15, 2016
Abstract: Polycystic ovary syndrome (PCOS) is one of the most common female endocrine disorders and a leading cause of female subfertility. The cytochrome P-450 11A1 (CYP11A1) gene encodes the key enzyme that cata-lyzes the initial and rate-limiting step in steroid hormone synthesis. In this study, the associations between sev-en single nucleotide polymorphisms (SNPs) in CYP11A1 and PCOS susceptibility were examined. Sevsev-en SNPs in CYP11A1 were genotyped using the MassARRAY iPLEX platform in 285 PCOS patients and 299 control individuals. Associations between the SNPs and the risk of PCOS were tested using various genetic models (co-dominant,
domi-nant, recessive, and additive). Logistic regression models were used to derive odds ratios (ORs) and 95% confidence intervals. By χ2 test, the differences of genotype frequencies of rs4887139 (P = 0.035) and rs4886595 (P = 0.046)
were significant statistically difference between PCOS patients and controls under recessive model. In the genetic
model analyses, we also found that the genotype “GG” of rs4887139 (P = 0.035) and genotype “CC” of rs4886595 (P = 0.04) were significant associated with increased the risk of PCOS by recessive model. We found four SNPs
(rs12917295, rs11632698, rs1484215, and rs6495096) constructed four haplotypes (“CACG”, “CATC”, “CACC”, and “GGCC”) in the CYP11A1 gene and none of the haplotype was significantly associated with risk of PCOS.
Keywords: Polycystic ovary syndrome (PCOS), cytochrome P-450 11A1 (CYP11A1), single nucleotide polymor-phisms (SNPs), case control study
Introduction
Polycystic ovary syndrome (PCOS) is a
hetero-geneous hormonal disorder affecting a fif
-teenth in women, and is one of the most
com-mon causes of female infertility. PCOS is a kind
of reproductive and metabolic disorder
charac-terized by hyper-androgen and insulin
resis-tance, which affects 5.6% of reproductive aged
women in Chinese and 6-8% in Caucasian [1,
2]. PCOS is a complex multifactor disorder and
genetic factors have been implicated in its
pathogenesis [3]. However, it’s now widely
accepted that genetic factors play an
indis-pensable role in the development of PCOS and
several candidate genes have been reported
recently [4, 5].
Exposure to endogenous sex hormones has
dis-(less than 32 days) and normal body mass
index (BMI), excluding hyperandrogenism,
hir-sutism, diabetes mellitus, etc. BMI was
calcu-lated as body weight in kilograms divided by
square of height in meters. Venous blood
sam-ples (5 ml) and signed informed consent were
obtained from each participant. All blood
sam-ples were quickly frozen in liquid nitrogen and
stored at -80°C. This study was approved by
the Hainan Province People’s Hospital, and
informed consent was obtained from all the
women prior to inclusion.
SNP selection and genotyping
Using the HapMap database, seven candidate
SNPs (rs12917295, rs11632698, rs1484215,
rs6495096, rs4887139, rs9806234, rs4886-
595) in
CYP11A1
with minor allele frequencies
> 5% in the Asian population and previously
published associations with PCOS or
steroido-genic enzymes were selected by previous
stud-ies [10, 16, 19]. The phenol-chloroform
extrac-tion method was performed to extract genomic
DNA from whole blood [20]. The concentration
of DNA was measured by spectrometry (DU530
UV/VIS™ spectrophotometer, Beckman Instru-
ments, Fullerton, CA, USA). We used the
Sequenom MassARRAY® Assay Design 3.0
Software to design a Multiplexed SNP Mass-
EXTEND® assay [21]. SNP genotyping using
the standard protocol recommended by the
manufacturer was performed using Sequenom
MassARRAY® RS1000. The SequenomTyper
4.0 Software™ was used to perform data
man-agement and analyses [22].
Statistical analysis
Differences in demographic characteristics
between the POCS cases and controls were
cancer [9], endometrial cancer and PCOS [10,
11].
Previous association studies between
CYP11A1
and PCOS have focus on the (TTTTA)n
microsat-ellite polymorphism in the promoter of
CYP11A1
[9, 12-15]. However, single nucleotide
polymor-phisms (SNPs) of
CYP11A1
have less been
reported [16]. In this study, we chose seven
SNPs in
CYP11A1
(rs12917295, rs11632698,
rs1484215, rs6495096, rs4887139, rs9806-
234, and rs4886595) and investigate their
association with PCOS.
Materials and methods
Study population
This Hainan region population-based
case-con-trol study comprising 285 PCOS patients
diag-nosed from January 2010 to May 2014 from
the Hainan Province People’s Hospital and 299
random samples of unrelated healthy
individu-als women on the same time from the health
centers of Hainan Province People’s Hospital
were conducted.
PCOS diagnostic criteria
PCOS were diagnosed by the revised 2003
con-sensus on diagnostic criteria and long-term
health risks related to polycystic ovary
syn-drome [17, 18]. Simply, at least two of following
three criteria was required: Clinical and/or
bio-chemical sign of hyperandrogenism,
oligomen-orrhea or anovulation, and polycystic ovarian
morphology on ultrasound. Meanwhile, other
diseases which could cause hyperandrogenism
should be excluded, such as hypothyroidism,
congenital adrenal hyperplasia, Cushing’s
syn-drome, androgen-secreting tumors, etc.
Demographic clinical data
and ethic support
[image:2.629.99.386.105.224.2]For each participant, a
stan-dardized epidemiological qu-
estionnaire including
residen-tial region, weight, height,
age, ethnicity, education
sta-tus, number of pregnancies,
age of menarche, and family
history of cancer was used to
collect personal data through
in-person interviews. Addi-
tionally, all the controls had
normal menstrual cycles
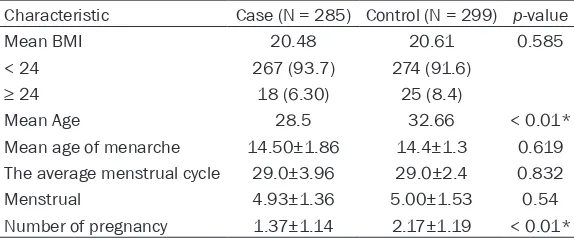
Table 1.
Characteristics of 285 POCS cases and 299 healthy
indi-viduals in this study
Characteristic Case (N = 285) Control (N = 299) p-value
Mean BMI 20.48 20.61 0.585
< 24 267 (93.7) 274 (91.6)
≥ 24 18 (6.30) 25 (8.4)
Mean Age 28.5 32.66 < 0.01*
Mean age of menarche 14.50±1.86 14.4±1.3 0.619
The average menstrual cycle 29.0±3.96 29.0±2.4 0.832
Menstrual 4.93±1.36 5.00±1.53 0.54
Number of pregnancy 1.37±1.14 2.17±1.19 < 0.01*
the number of pregnancy distribution (1.37 ±
1.14 in cases vs 2.17 ± 1.19 in controls).
Additionally, BMI, mean age of menarche, the
average menstrual cycle and menstrual were
equally distributed among PCOS cases and
control subjects (
Table 1
).
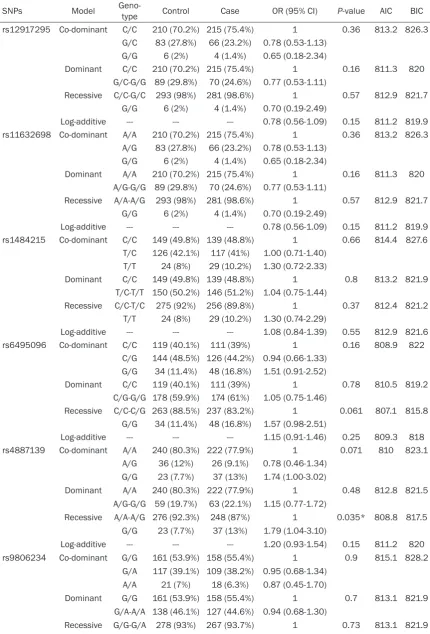
[image:3.629.103.531.95.236.2]Association between the SNPs and PCOS risk
Table 2
summarizes the basic characteristics
of the seven SNPs in the
CYP11A1
, and showed
the minor allele and major allele of each SNP.
We compared the differences in frequency
dis-tributions of alleles between cases and
con-trols by Pearson χ
2test under the recessive
model and found only the minor allele “G” in
rs4887139 (
P
= 0.035) and “C” of rs4886595
(
P
= 0.046) were significantly associated with
risk.
We also used SNP Stats to assess the
associa-tion between these SNPs and PCOS risks using
four genetic models (co-dominant, dominant,
recessive, and log-additive) by unconditional
logistic-regression analysis. As shown in
Table
3
, we also found the genotype “G/G” of
rs4887139 was associated with increased
PCOS risk with OR = 1.79, 95% CI = 1.04-3.10,
P
= 0.035, and the genotype “CC” of rs4886595
was associated with increased PCOS risk with
OR = 4.29, 95% CI = 0.90-20.36,
P
= 0.04 by
the log-additive model.
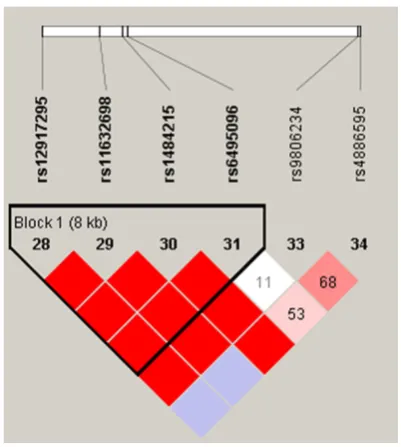
One haplotype block that included four SNPs
(rs12917295, rs11632698, rs1484215, and
rs6495096) with D’ = 1 (
Figure 1
) was
detect-ed in
CYP11A1
SNPs by haplotype analyses.
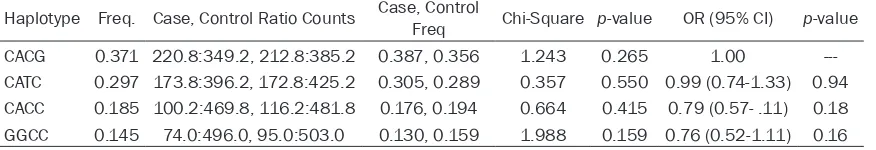
Haplotypes with frequencies > 1% which
includ-ing “CACG”, “CATC”, “CACC”, and “GGCC” were
evaluated by the Chi-square test (for cate-
gorical variables) or the Student’s t-test (for
continuous variables). Four unconditional
logis-tic regression genelogis-tics models (dominant,
co-dominant, recessive, and log-additive genetic
models) were used to evaluate the association
of each of the SNPs with POCS by SNP Stats
[23] (Catalan Institute of Oncology, Barcelona,
Spain), a web-based software http://bioinfo.
iconcologia.net/snpstats/start.htm. We used
Microsoft Excel (Microsoft Corp, Redmond, WA,
United States) and the SPSS 18.0 Statistical
Package (SPSS, Chicago, IL, USA) to perform
statistical analyses. 95% confidence intervals
(CIs) and Odds ratios (ORs) were calculated
using unconditional logistic regression
analy-ses adjusted for age and BMI. All
p
values
reported in this study were two-tailed, and
p
values less than 0.05 were considered
statisti-cally significant. Linkage disequilibrium (LD) of
the candidate SNPs was analyzed using
HaploView v4.2 (Mark Daly’s Laboratory,
Massachusetts Institute of Technology/
Harvard Broad Institute, Cambridge, MA, USA)
[24]. Pairwise LD and haplotype constructions
were performed using the SHEsis Software
(http://analysis.bio-x.cn/myAnalysis.php) [25].
Results
Characteristics of the study participants
A total of 584 participants, including 285 PCOS
cases and 299 controls, were successfully
gen-otyped for further analysis. All of participants
were women and at least 18 years old. There is
significant (
P
< 0.05) difference between the
cases and controls in terms of mean age
distri-bution (28.5 in cases vs 32.6 in controls) and
Table 2.
Basic information of the seven SNPs and Chi-square under the recessive model
SNPs Gene Position Allele A/B
Case Control Pearson
Chi-Square Chi-Squarep-Pearson AA count AB-BB count AA count AB-BB count
rs12917295 CYP11A1 74632284 G/C 4 281 6 293 0.315 0.574
rs11632698 CYP11A1 74637867 G/A 4 281 6 293 0.315 0.574
rs1484215 CYP11A1 74640109 T/C 29 256 24 275 0.816 0.366
rs6495096 CYP11A1 74640647 G/C 48 237 34 263 3.496 0.061
rs4887139 CYP11A1 74661945 G/A 37 248 23 276 4.429 0.035*
rs9806234 CYP11A1 74663033 A/G 18 267 21 278 0.117 0.732
rs4886595 CYP11A1 74663265 C/A 8 277 2 297 3.963 0.046*
Table 3.
Single SNPs association with PCOS (adjusted by BMI and age)
SNPs Model Geno-type Control Case OR (95% CI) P-value AIC BIC
rs12917295 Co-dominant C/C 210 (70.2%) 215 (75.4%) 1 0.36 813.2 826.3
G/C 83 (27.8%) 66 (23.2%) 0.78 (0.53-1.13)
G/G 6 (2%) 4 (1.4%) 0.65 (0.18-2.34)
Dominant C/C 210 (70.2%) 215 (75.4%) 1 0.16 811.3 820
G/C-G/G 89 (29.8%) 70 (24.6%) 0.77 (0.53-1.11)
Recessive C/C-G/C 293 (98%) 281 (98.6%) 1 0.57 812.9 821.7
G/G 6 (2%) 4 (1.4%) 0.70 (0.19-2.49)
Log-additive --- --- --- 0.78 (0.56-1.09) 0.15 811.2 819.9
rs11632698 Co-dominant A/A 210 (70.2%) 215 (75.4%) 1 0.36 813.2 826.3
A/G 83 (27.8%) 66 (23.2%) 0.78 (0.53-1.13)
G/G 6 (2%) 4 (1.4%) 0.65 (0.18-2.34)
Dominant A/A 210 (70.2%) 215 (75.4%) 1 0.16 811.3 820
A/G-G/G 89 (29.8%) 70 (24.6%) 0.77 (0.53-1.11)
Recessive A/A-A/G 293 (98%) 281 (98.6%) 1 0.57 812.9 821.7
G/G 6 (2%) 4 (1.4%) 0.70 (0.19-2.49)
Log-additive --- --- --- 0.78 (0.56-1.09) 0.15 811.2 819.9
rs1484215 Co-dominant C/C 149 (49.8%) 139 (48.8%) 1 0.66 814.4 827.6
T/C 126 (42.1%) 117 (41%) 1.00 (0.71-1.40)
T/T 24 (8%) 29 (10.2%) 1.30 (0.72-2.33)
Dominant C/C 149 (49.8%) 139 (48.8%) 1 0.8 813.2 821.9
T/C-T/T 150 (50.2%) 146 (51.2%) 1.04 (0.75-1.44)
Recessive C/C-T/C 275 (92%) 256 (89.8%) 1 0.37 812.4 821.2
T/T 24 (8%) 29 (10.2%) 1.30 (0.74-2.29)
Log-additive --- --- --- 1.08 (0.84-1.39) 0.55 812.9 821.6
rs6495096 Co-dominant C/C 119 (40.1%) 111 (39%) 1 0.16 808.9 822
C/G 144 (48.5%) 126 (44.2%) 0.94 (0.66-1.33) G/G 34 (11.4%) 48 (16.8%) 1.51 (0.91-2.52)
Dominant C/C 119 (40.1%) 111 (39%) 1 0.78 810.5 819.2
C/G-G/G 178 (59.9%) 174 (61%) 1.05 (0.75-1.46)
Recessive C/C-C/G 263 (88.5%) 237 (83.2%) 1 0.061 807.1 815.8
G/G 34 (11.4%) 48 (16.8%) 1.57 (0.98-2.51)
Log-additive --- --- --- 1.15 (0.91-1.46) 0.25 809.3 818
rs4887139 Co-dominant A/A 240 (80.3%) 222 (77.9%) 1 0.071 810 823.1
A/G 36 (12%) 26 (9.1%) 0.78 (0.46-1.34)
G/G 23 (7.7%) 37 (13%) 1.74 (1.00-3.02)
Dominant A/A 240 (80.3%) 222 (77.9%) 1 0.48 812.8 821.5
A/G-G/G 59 (19.7%) 63 (22.1%) 1.15 (0.77-1.72)
Recessive A/A-A/G 276 (92.3%) 248 (87%) 1 0.035* 808.8 817.5
G/G 23 (7.7%) 37 (13%) 1.79 (1.04-3.10)
Log-additive --- --- --- 1.20 (0.93-1.54) 0.15 811.2 820
rs9806234 Co-dominant G/G 161 (53.9%) 158 (55.4%) 1 0.9 815.1 828.2
G/A 117 (39.1%) 109 (38.2%) 0.95 (0.68-1.34)
A/A 21 (7%) 18 (6.3%) 0.87 (0.45-1.70)
Dominant G/G 161 (53.9%) 158 (55.4%) 1 0.7 813.1 821.9
G/A-A/A 138 (46.1%) 127 (44.6%) 0.94 (0.68-1.30)
Further genetics model analysis found the
minor of rs4887139 was protective allele, and
the minor allele “C” of rs4886595 was a risk
allele.
Ovarian steroidogenesis begins with the
con-version of cholesterol into pregnenolone that is
catalyzed by P450scc enzyme, an initial and
rate-limiting step at the start of steroid
hor-mone biosynthetic pathway. Several SNPs of
CYP11A1
have been reported to be involved in
the aetiopathogenesis of PCOS that may alter
testosterone levels. Numerous studies have
examined
CYP11A1
gene polymorphisms, but
most have focus on the pentanucleotide
[TTTTA]n repeat (D15S520) located 528 bp
upstream of the translational initiation site,
which showed six common polymorphisms with
four, six, seven, eight, nine, or ten repeats. In
the Chinese population, the main variants are
the four-, six-, and eight-repeat alleles, which
are correlated with risks of breast cancer [26]
and polycystic ovarian syndrome [10]. Although
CYP11A1
polymorphism was associated with
breast cancer and POCS, mechanism was
dif-ferent. Estrogen is closely related and breast
cancer [27], androgen is associated with PCOS.
So far single nucleotide polymorphisms (SNPs)
of
CYP11A1
have less been reported. However,
PCOS cannot be associated with a single factor
of this gene, more research on predisposing
causes of PCOS and the function of
CYP11A1
gene is needed in the future.
Some limitations of the present replication
study should be mentioned. First, the sample
size of this replication study was relatively small
and this replication study maybe not sufficient
to detect the potential association between
A/A 21 (7%) 18 (6.3%) 0.89 (0.47-1.71)
Log-additive --- --- --- 0.94 (0.72-1.22) 0.65 813.1 821.8
rs4886595 Co-dominant A/A 222 (74.2%) 203 (71.2%) 1 0.11 810.9 824
C/A 75 (25.1%) 74 (26%) 1.08 (0.74-1.57)
C/C 2 (0.7%) 8 (2.8%) 4.37 (0.92-20.83)
Dominant A/A 222 (74.2%) 203 (71.2%) 1 0.41 812.6 821.3
C/A-C/C 77 (25.8%) 82 (28.8%) 1.16 (0.81-1.68)
Recessive A/A-C/A 297 (99.3%) 277 (97.2%) 1 0.04* 809 817.8
C/C 2 (0.7%) 8 (2.8%) 4.29 (0.90-20.36)
Log-additive --- --- --- 1.24 (0.89-1.73) 0.2 811.6 820.4
*P < 0.05 indicates statistical significance. Abbreviations: OR, odds ratio; CI confidence interval. SNP, single nucleotide poly -morphism; AIC, Akaike’s information criterion; BIC, Bayesian information criterion.
selected for analyze, and the association
between inferred haplotypes and PCOS risk
among the individuals was analyzed. However,
we found no association between the selected
haplotype and PCOS risk (
Table 4
).
Discussion
[image:5.629.97.298.256.480.2]In this study, we found the frequency of
rs4887139 and rs4886595 were different
between PCOS and healthy controls in Hainan
region. Due to PCOS were not easy to get
preg-nant, the number of pregnancy among PCOS
were significant less than healthy individuals.
Figure 1. Linkage disequilibrium plots containing six SNPs from CYP11A1. Red squares displaystatisti-cally significant associations between a pair of SNPs,
CYP11A1
gene and PCOS. Second, only seven
SNPs were chosen which may cause
incom-plete coverage of the gene variations. Third, the
recruited subjects were all Han Chinese women
and the result could not represent other
population.
Future studies should focus on early detection
of the predisposing risk factors in PCOS
devel-opment. Large and more genome-wide
associa-tion studies devoted solely to PCOS among
dif-ferent populations will be necessary to identify
new candidate genes and proteins that are
involved in PCOS risk.
Acknowledgements
This study was funded by the Social De-
velopment of Hainan Province Special Fund of
Science and Technology (SF201302). We are
grateful to the PCOS patients and control
sub-jects for their participation in this study. We
also thank the clinicians and hospital staffs
who contributed to the sample and data
collection.
Disclosure of conflict of interest
None.
Address correspondence to: Tianbo Jin, School of Life Sciences, Northwest University, 386, #229 North Taibai Road, Xi’an 710069, Shaanxi, People’s Republic of China. Tel: +86 29 8830 2831; Fax: +86 29 8830 2831; E-mail: tianbojinprofessor@163. com; Zhuori Li, Department of Gynecology and Obstetrics, People’s Hospital of Hainan Provincial, 19, Xiuhua Road, Haikou 570102, Hainan, People’s Republic of China. Tel: 86-898-68622452; Fax: 86-898-68622452; E-mail: [email protected]
References
[1] Li R, Zhang Q, Yang D, Li S, Lu S, Wu X, Wei Z, Song X, Wang X, Fu S, Lin J, Zhu Y, Jiang Y, Feng
HL and Qiao J. Prevalence of polycystic ovary syndrome in women in China: a large commu-nity-based study. Hum Reprod 2013; 28: 2562-2569.
[2] Azziz R, Woods KS, Reyna R, Key TJ, Knochenhauer ES and Yildiz BO. The preva-lence and features of the polycystic ovary syn-drome in an unselected population. J Clin Endocrinol Metab 2004; 89: 2745-2749. [3] Zhao S, Tian Y, Zhang W, Xing X, Li T, Liu H,
Huang T, Ning Y, Zhao H and Chen ZJ. An as-sociation study between USP34 and polycystic ovary syndrome. J Ovarian Res 2015; 8: 30. [4] Chen ZJ, Zhao H, He L, Shi Y, Qin Y, Shi Y, Li Z,
You L, Zhao J, Liu J, Liang X, Zhao X, Zhao J, Sun Y, Zhang B, Jiang H, Zhao D, Bian Y, Gao X, Geng L, Li Y, Zhu D, Sun X, Xu JE, Hao C, Ren CE, Zhang Y, Chen S, Zhang W, Yang A, Yan J, Li Y, Ma J and Zhao Y. Genome-wide association
study identifies susceptibility loci for polycystic
ovary syndrome on chromosome 2p16.3, 2p21 and 9q33.3. Nat Genet 2011; 43: 55-59.
[5] Li T, Zhao H, Zhao X, Zhang B, Cui L, Shi Y, Li G,
Wang P and Chen ZJ. Identification of YAP1 as
a novel susceptibility gene for polycystic ovary syndrome. J Med Genet 2012; 49: 254-257. [6] Sun M, Yang X, Ye C, Xu W, Yao G, Chen J and Li
M. Risk-association of CYP11A1 polymor-phisms and breast cancer among Han Chinese women in Southern China. Int J Mol Sci 2012; 13: 4896-4905.
[7] Payne AH and Hales DB. Overview of steroido-genic enzymes in the pathway from cholesterol to active steroid hormones. Endocr Rev 2004; 25: 947-970.
[8] Zheng W, Gao YT, Shu XO, Wen W, Cai Q, Dai Q and Smith JR. Population-based case-control study of CYP11A gene polymorphism and breast cancer risk. Cancer Epidemiol Biomarkers Prev 2004; 13: 709-714.
[9] Celhar T, Gersak K, Ovcak Z, Sedmak B and Mlinaric-Rascan I. The presence of the CYP11A1 (TTTTA) 6 allele increases the risk
of biochemical relapse in organ confined and
[image:6.629.99.537.97.172.2]low-grade prostate cancer. Cancer Genet Cytogenet 2008; 187: 28-33.
Table 4.
Haplotype association with response (adjusted by age and BMI)
Haplotype Freq. Case, Control Ratio Counts Case, Control Freq Chi-Square p-value OR (95% CI) p-value
CACG 0.371 220.8:349.2, 212.8:385.2 0.387, 0.356 1.243 0.265 1.00
---CATC 0.297 173.8:396.2, 172.8:425.2 0.305, 0.289 0.357 0.550 0.99 (0.74-1.33) 0.94
CACC 0.185 100.2:469.8, 116.2:481.8 0.176, 0.194 0.664 0.415 0.79 (0.57- .11) 0.18
GGCC 0.145 74.0:496.0, 95.0:503.0 0.130, 0.159 1.988 0.159 0.76 (0.52-1.11) 0.16
[10] Gao GH, Cao YX, Yi L, Wei ZL, Xu YP and Yang C. [Polymorphism of CYP11A1 gene in Chinese patients with polycystic ovarian syndrome]. Zhonghua Fu Chan Ke Za Zhi 2010; 45: 191-196.
[11] Terry K, McGrath M, Lee IM, Buring J and De Vivo I. Genetic variation in CYP11A1 and StAR in relation to endometrial cancer risk. Gynecol Oncol 2010; 117: 255-259.
[12] Gharani N, Waterworth DM, Batty S, White D, Gilling-Smith C, Conway GS, McCarthy M, Franks S and Williamson R. Association of the steroid synthesis gene CYP11a with polycystic ovary syndrome and hyperandrogenism. Hum Mol Genet 1997; 6: 397-402.
[13] Wang Y, Wu XK, Cao YX, Yi L, Zou Y, Qu JW and Hou LH. [Microsatellite polymorphism of (tttta) n in the promoter of CYP11a gene in Chinese women with polycystic ovary syndrome]. Zhonghua Yi Xue Za Zhi 2005; 85: 3396-3400. [14] Wang Y, Wu X, Cao Y, Yi L and Chen J. A micro-satellite polymorphism (tttta) n in the promoter of the CYP11a gene in Chinese women with polycystic ovary syndrome. Fertil Steril 2006; 86: 223-226.
[15] Gaasenbeek M, Powell BL, Sovio U, Haddad L, Gharani N, Bennett A, Groves CJ, Rush K, Goh MJ, Conway GS, Ruokonen A, Martikainen H, Pouta A, Taponen S, Hartikainen AL, Halford S, Jarvelin MR, Franks S and McCarthy MI. Large-scale analysis of the relationship between CYP11A promoter variation, polycystic ovarian syndrome, and serum testosterone. J Clin Endocrinol Metab 2004; 89: 2408-2413. [16] Zhang CW, Zhang XL, Xia YJ, Cao YX, Wang WJ,
Xu P, Che YN, Wu XK, Yi L, Gao Q and Wang Y. Association between polymorphisms of the CYP11A1 gene and polycystic ovary syndrome in Chinese women. Mol Biol Rep 2012; 39: 8379-8385.
[17] Legro RS, Arslanian SA, Ehrmann DA, Hoeger KM, Murad MH, Pasquali R, Welt CK and Endocrine S. Diagnosis and treatment of poly-cystic ovary syndrome: an Endocrine Society clinical practice guideline. J Clin Endocrinol Metab 2013; 98: 4565-4592.
[18] Rotterdam ESHRE/ASRM-Sponsored PCOS consensus workshop group. Revised 2003 consensus on diagnostic criteria and long-term health risks related to polycystic ovary syn-drome (PCOS). Hum Reprod 2004; 19: 41-47. [19] Tripodi G, Citterio L, Kouznetsova T, Lanzani C,
Florio M, Modica R, Messaggio E, Hamlyn JM, Zagato L, Bianchi G, Staessen JA and Manunta P. Steroid biosynthesis and renal excretion in human essential hypertension: association with blood pressure and endogenous ouabain. Am J Hypertens 2009; 22: 357-363.
[20] Kochl S, Niederstatter H and Parson W. DNA extraction and quantitation of forensic sam-ples using the phenol-chloroform method and real-time PCR. Methods Mol Biol 2005; 297: 13-30.
[21] Gabriel S, Ziaugra L and Tabbaa D. SNP geno-typing using the Sequenom MassARRAY iPLEX platform. Curr Protoc Hum Genet 2009; Chapter 2: Unit 2.12.
[22] Thomas RK, Baker AC, Debiasi RM, Winckler W, Laframboise T, Lin WM, Wang M, Feng W, Zander T, MacConaill L, Lee JC, Nicoletti R, Hatton C, Goyette M, Girard L, Majmudar K, Ziaugra L, Wong KK, Gabriel S, Beroukhim R, Peyton M, Barretina J, Dutt A, Emery C, Greulich H, Shah K, Sasaki H, Gazdar A, Minna J, Armstrong SA, Mellinghoff IK, Hodi FS, Dranoff G, Mischel PS, Cloughesy TF, Nelson SF, Liau LM, Mertz K, Rubin MA, Moch H, Loda M, Catalona W, Fletcher J, Signoretti S, Kaye F, Anderson KC, Demetri GD, Dummer R, Wagner S, Herlyn M, Sellers WR, Meyerson M and Garraway LA. High-throughput oncogene
muta-tion profiling in human cancer. Nat Genet
2007; 39: 347-351.
[23] Sole X, Guino E, Valls J, Iniesta R and Moreno V. SNPStats: a web tool for the analysis of as-sociation studies. Bioinformatics 2006; 22: 1928-1929.
[24] Barrett JC, Fry B, Maller J and Daly MJ. Haploview: analysis and visualization of LD and haplotype maps. Bioinformatics 2005; 21: 263-265.
[25] Shi YY and He L. SHEsis, a powerful software platform for analyses of linkage disequilibrium, haplotype construction, and genetic associa-tion at polymorphism loci. Cell Res 2005; 15: 97-98.
[26] Sakoda LC, Blackston C, Doherty JA, Ray RM, Lin MG, Stalsberg H, Gao DL, Feng Z, Thomas DB and Chen C. Polymorphisms in steroid hor-mone biosynthesis genes and risk of breast
cancer and fibrocystic breast conditions in
Chinese women. Cancer Epidemiol Biomarkers Prev 2008; 17: 1066-1073.
[27] Zhou L, He N, Feng T, Geng TT, Jin TB and Chen