Abstract— This study describes how data science can be used in decision-making for renewable energy production. You will attain an example for how climatic datasets can be used in decision process of renewable energy investments. Under the light of three decision criteria, “metrics”, which will be used to measure efficiency of alternative solutions, are specified. Datasets from satellite records are used for generating scores of the metrics. TOPSIS, AHP, Engineering Economics, Six Sigma Quality Control methods and applications are used during consideration of datasets. Final decisions are diversified by weights considering various political points of views for optimum decision.
Index Terms— data science, decision making, renewable energy, sustainability, MCDM.
I. INTRODUCTION
NERGY consumption per capita and world population are increasing at the same time. It causes an exponential increase on energy demand. On the other side, environmental sensibility gains value in politics because of destructive influences of conventional resources. These two main reasons have promoted the progress of renewable energy solutions.
Human brain has its own sensors, algorithms and perception methods to perceive the world and to make decisions. Beginning from the digital revolution, we currently have various types of sensors which continuously collect data. These datasets are useful for making decisions.
In this study, NASA datasets are considered. These satellite datasets are collected periodically per coordinate, and they are cumulatively recorded.
By prospering counts, sensibilities and metrics of alternative solutions, decision model will be consolidated in further projects.
The study is organized as follows: Alternative renewable energy solution that are chosen and criteria that are used for measuring efficiency have been presented in the Section II. Methods of MCDM and techniques have been explained in the Section III. A framework of abstract model has been designed in the Section IV. Application of
Manuscript received July 9, 2015; revised July 28, 2015.
This study has been financially supported by Galatasaray University Research Fund.
Denizhan Çay is with Industrial Engineering Department, Galatasaray University, İstanbul, Turkey. (phone :+905385464401 e-mail: [email protected]).
Kübra Karabece is with Industrial Engineering Department, Galatasaray University, İstanbul, Turkey. (phone:+905058191981 e-mail: [email protected]).
Dr. Tuncay Gürbüz is with Industrial Engineering Department, Galatasaray University , İstanbul, Turkey (corresponding author, phone: +902122274480-280; e-mail: [email protected]).
methods with final tables has been shown in the Section V. Final decision tables with different weights have been given and commented on in the Section VI. Finally, the Section VII gives the concluding remarks on the study.
II. ALTERNATIVE RENEWABLE SOLUTIONS AND
MEASURING EFFICIENCY
The project has framed to make decision between three alternatives. In the selection, measurability has been favored by considering NASA Datasets for technical metrics [1].
A. Solar Power
Solar energy, radiant light and heat from the sun have been used since the former using a range of ever-changing technologies. The total solar energy absorbed by the atmosphere, oceans and land masses is approximately 3,850,000 exajoules (EJ) per year [2]. When the material (metal and non-metallic solid, liquid or gas) absorbs the energy of electromagnetic radiation of very short wavelength, such as ultraviolet or visible radiation, electrons are emitted (these electrons are often referred to as photoelectrons). This effect is called the photoelectric effect. On this basis, solar cells or PhotoVoltaics (PV), which consist of one or two layers of semiconductor material, can be made to directly convert solar radiation into electricity [3].
B. Hydro Power
Hydroelectric power (hydropower) is a renewable energy source when the electrical power is derived from the water energy in motion of high altitude to lower altitudes. It is a proven, mature, predictable and competitive technology prices. Hydropower has the best conversion efficiencies among all known energy sources (about 90% efficiency, water on the wire). It requires a relatively large initial investment, but it has a long life with operating and maintenance costs are very low. The existing hydroelectric system to an annual production capacity of 3500 TW • h/a and contributes to 16% of annual global electricity generation [4].
C. Wind Power
Wind power has been seen as an ecological alternative energy source and has attracted the most attention. Many initiatives have been launched to increase the share of wind energy in electricity production [5].
A wind turbine is a device that captures the kinetic energy of the wind. Historically, a wind turbine was frequently used as a mechanical device with a number of blades to drive machinery. Nowadays it is often used to drive a generator for the kinetic energy is converted into
Data Supported Decision-Making for
Renewable Energy Solutions
Denizhan Çay, Kübra Karabece and Tuncay Gürbüz
electricity. Wind turbines can be used for standalone applications, connected to a power grid or in combination with photovoltaic systems, batteries and diesel generators etc. to form hybrid systems [6].
D. Evaluation Model Criteria
During decision process, there are various constraints and objectives which will shape optimum decision.
1. Technical Criteria
For implementation of a renewable energy facility, natural resource which will be converted to electrical power must be sufficient.
Measurement of technical capacity varies for alternative solutions. You can see various indicators for measurement of technical capacity of alternative renewable solutions in the section III.
This criterion will take the highest level of weight in decision process, because, for instance, you have to hold an admissible total amount of wind capacity during the year for choosing wind power as optimum solution.
- Solar Technical Metrics
C1: Annual Monthly Averaged Direct Normal Radiation (kWh/m2/day)
C2: Annual Monthly Averaged Insolation Clearness Index
C3: Annual Monthly Averaged Clear Sky Days (days)
C4: Annual Monthly Averaged Specific Humidity at 2 m above the Surface of the Earth (kg/kg) - Hydro Technical Metrics
C5: Annual Monthly Averaged Specific Humidity at 2 m above the Surface of the Earth (kg/kg)
C6: Annual Monthly Averaged Precipitation (mm/day)
C7: Annual Monthly Averaged Dew/Frost Point Temperature (°C)
- Wind Technical Metrics
C8: Annual Monthly Averaged Wind Speed at 50 m above the Surface of the Earth (m/s)
C9: Minimum and Maximum Difference From Monthly Averaged Wind Speed at 50 m (%)
C10: Monthly Averaged Percent of Time the Wind Speed at 50 m above the Surface of the Earth Is Within 0 - 2 m/s (%)
C11: Monthly Averaged Percent of Time the Wind Speed at 50 m above the Surface of the Earth Is Within 3 - 6 m/s (%)
C12: Monthly Averaged Percent of Time the Wind Speed at 50 m above the Surface of the Earth Is Within 7 - 10 m/s (%)
C13: Monthly Averaged Percent of Time the Wind Speed at 50 m above the Surface of the Earth Is Within 11 - 14 m/s (%)
C14: Monthly Averaged Percent of Time the Wind Speed at 50 m above the Surface of the Earth Is Within 15 - 18 m/s (%)
C15: Monthly Averaged Percent of Time the Wind Speed at 50 m above the Surface of the Earth Is Within 19 - 25 m/s (%)
2. Financial Criteria
Maintenance & operations costs of facilities for 25 years and the first investment costs constitute financial scores.
Financial need for the implementation is an important dimension of decision process. This criterion is an input type criterion. Therefore smaller values are preferred.
In three alternatives, environmental and financial metrics build same title. Environmental criteria are generated with expert opinions, financial criteria are cost with units of $/kW for each energy solutions [7].
- Financial Metrics
F1,i: Investment Cost ($/kW)
F2,i: Maintenance and Operation Cost ($/kW)
with i : 1 to 3, alternative solutions
3. Environmental Criteria
We accept that conventional energy solutions as coal, gas or nuclear have the highest level of environmental and social effects. It does not mean that renewable solutions are innocents.
Environmental criteria are constituted by environmental and social effects of alternative solutions which are measured by environmental and social metrics. These criteria are also input type criteria.
- Environmental Metrics
E1,i: Use of Water
E2,i: Noise
E3,i: Land Use Effect
E4,i: Radiation Effect
E5,i: Effect on Animals and Plant
E6,i: Carbon Vibration
with i : 1 to 3, alternative solutions III. METHODS AND TECHNIQUES
A. SSQC (Six Sigma Quality Control)
Six Sigma is used to improve quality of datasets that are obtained from NASA. Before applying TOPSIS, SSQC removes the cause of defects and controls the quality of process. By applying SSQC, outliers have been eliminated.
B. TOPSIS (Technique for Order Preference by Similarity to Ideal Solution)
TOPSIS is applied in two parts of model. In first part of the model we obtain technical scores for three energy solutions. In this application, criteria are C1 to C4 for solar power, C5 to C7 for hydro power and C8 to C15 for wind power. Alternatives are attitudes for precise longitude. In Table I weights of criteria is shown.
TABLEI
WEIGHTSOF CRITERIA IN TOPSIS
Criteria C1 C2 C3 C4 C5
Weight 0,4 0,2 0,2 0,2 0,2
Criteria C6 C7 C8 C9 C10
Weight 0,6 0,2 0,2 0,1 0,2
Criteria C11 C12 C13 C14 C15
In second part, using the scores obtained from various applications (AHP, TOPSIS, Engineering Economics), TOPSIS is applied one more time in order to determine final scores of alternative solutions for each coordinate. Criteria are technical, environmental and financial scores and alternatives are three energy solutions.
C. Engineering Economics
In financial criteria, firstly cash flow of maintenance and exploitation cost is calculated with inflation rate that is accepted 10%. Secondly, current value of cash flow is calculated with ratio of interest that is accepted 8%. By doing that, estimated total cost of energy solutions is achieved for 25 years which is the economic life of renewable energy centrals.
D. AHP (Analytic Hierarchy Process)
In environmental criteria, AHP is used for getting environmental score of each metrics. According to Satty Scale, metrics are scored and compared with combination of two of three energy solutions.
Under C1 to C8 technical metrics of wind power, C9 to C11 hydro power and C12 to C15 solar power, average data of 22 years for the coordinate are being computing and technical sub-scores are being generating by using TOPSIS.
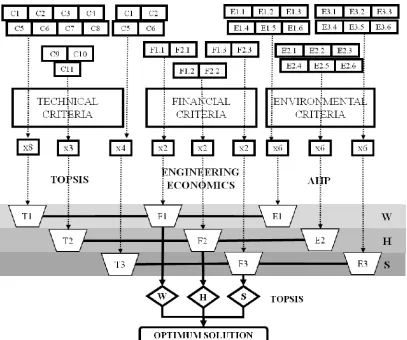
IV. MODELING
In this section, data flow and the decision process will be explained. This process is realized for one single coordinate.
On the other side, financial indicators are generating financial sub-scores of alternative renewable solutions by using engineering economics application.
As the last criterion, environmental sub-scores are being generated by environmental and social metrics using AHP.
At the second part, T1, F1, E1 sub-scores of wind power; T2, F2, E2 sub-scores of financial power; T3, F3, E3 sub-scores of solar power are separately being considering by TOPSIS for generating final scores of each alternative for the coordinate.
After having final scores W, H and S for the coordinate, the model choose the highest as optimum renewable solution for the coordinate given.
Decision making model is explained in Fig.1. V. APPLICATIONS
A. Six Sigma Quality Control for Validity of Datasets
[image:3.612.103.510.362.702.2]In Table II, example of SSQC is shown for the metrics of C1.Values of table are longitude -180 and in the same way application is done for each longitude and metrics.
B. TOPSIS Application for Getting Technical Scores
In Table III and Table IV, TOPSIS example for getting technical scores is shown for solar power in longitude -180. In the same way scores are obtained each longitude for three renewable energy solutions.
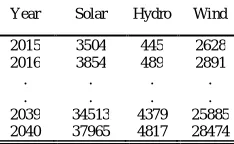
C. Engineering Economics Application for Getting Financial Scores
Table V shows values of the investment cost with units of $/kW. In Table VI –VII, a part of calculation of total cost is shown.
D. AHP Application for Getting Environmental Scores
Table VIII shows final environmental scores of three
renewable energy solutions.
E. TOPSIS Application for Getting Final Scores
In final step of TOPSIS, scores that are gained in previous application (is shown in Table IX) are used to find optimum solution. In Table X, the final column is final scores of coordinate longitude -180 and latitude 89.At this coordinate, the model generate maximum score that is wind power. That means, optimum solution is selected as the wind power. In the similar way, optimum solutions of all coordinates are calculated.
VI. FINAL DECISIONS TABLES
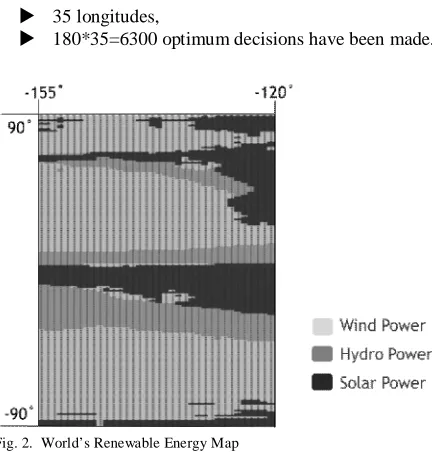
By writing generated optimum solutions on a matrix, world’s renewable energy map that is shown in F ig.2 has been procured.
In this example map;
180 latitudes,
TABLEII
EXAMPLEOF SIX SIGMA QUALITY CONTROL
Latitude C1
89 3,93
88 3,94
. .
. .
-89 7,44
-90 7,13
σ 1,53
Average 4,35
Lower limit 8,94 Upper limit -0,24
TABLEIII
VALUES OFTHE CRITERIA FOR SOLAR POWER
Latitude C1 C2 C3 C4
89 3,93 0,59 3 0,00158
88 3,94 0,59 3 0,001581
. . . . .
. . . . .
-89 7,44 0,73 3,51 0,00015 -90 7,13 0,72 3,51 0,00013
TABLEIV
FINAL SCOREOFTHE CRITERIA FOR SOLAR POWER
Latitude S+ S- (S+)2 (S-)2 C*=S-/ S+ + S
-89 0,045 0,001 0,033 0,421 0,002 88 0,045 0,001 0,033 0,422 0,002
. . . .
. . . .
-89 0,001 0,033 0,002 0,049 0,600 -90 0,001 0,033 0,002 0,048 0,592
TABLEV
VALUES OFTHE INVESTMENT COST
Renewable Energy Solar Hydro Wind
Investment cost ($/kw) 6000 2300 1700
TABLEVI
MAINTENANCEANDOPERATIONCOSTSCENTRALSFOR25YEARS
Year Solar Hydro Wind
2015 3504 445 2628
2016 3854 489 2891
. . . .
. . . .
2039 34513 4379 25885 2040 37965 4817 28474
TABLEVII
CURRENT VALUES OF TOTAL COST
Year Solar Hydro Wind
2015 3504 445 2628
2016 3569 453 2677
. . . .
. . . .
2039 5443 691 4082
2040 5544 703 4158
Total maintenance and
operation costs 115679 14677 86759
Total 121679 16977 88459
TABLEVIII
FINAL VALUES OF ENVIRONMENTAL SCORES
Environmental Effect Wind Hydro Solar
Use of water 0,11 0,78 0,11
Noise 0,64 0,28 0,06
Land use effect 0,20 0,71 0,07
Radiation effect 0,09 0,09 0,82
Effect on animals and plant 0,29 0,65 0,60
Carbon vibration 0,33 0,57 0,10
Total 1,66 3,08 1,76
TABLEIX VALUES OF THREE CRITERIA
R.E Technical Financial Environmental
Solar 0,81 121678 1,76
Hydro 0,45 16976 3,08
Wind 0,37 88459 1,66
TABLEX
FINAL SCORE FORA COORDINATE (LONG:-180LAT:89)
R.E S+
S -(S+
)2 (S
-)2
C*=S -/ S+
+ S
[image:4.612.125.242.660.732.2] 35 longitudes,
180*35=6300 optimum decisions have been made.
With the dominance at the duration and the rate of insolation, solar power has taken place on the regions of the equator and poles.
The hydro power is feasible above and below the equator region because the precipitation rate.
While passing latitudes between climate zones, we see that the wind power becomes feasible thanks to the increase in wind speed rate. Beside technical advantages in climate passageways, wind power has average values on financial and environmental criteria.
Final decisions are diversified by weights considering various political points of views for optimum decision.
Technical criteria are criteria that have the greatest weight values into consideration, because you cannot produce energy from wind power even if you make a lot of investment, if there is no wind in a region. But the proportion of the other two types of criteria, financial and environmental, may vary during the process of making decision with different policy approaches. That is why at the end of the work, we left the doors open to interpretation by citing two additional proportions of these two types of criteria.
Variation of weights is shown below in Table XI with three different scenarios namely S1, S2 and S3.
A. S2
[image:5.612.310.526.43.219.2]By visualizing in practice, we see that, when financial criteria become more important in decision process, hydro power is gaining more space in the map that is shown in Fig. 3.
B. S3
When the weight of environmental criteria is increased, it is noted that hydro power disappears and solar power gains wide place instead. It means that, the progression on more efficient technologies promote solar power if the costs of investment and maintenance of this solution can be reduced. The details can be seen on the following figure.
VII. CONCLUSION
In this paper, we tried to use several optimization and decision methods in the field of renewable energy. The model focuses on the potential of natural resources in different climatic zones instead of transformation technologies.
This project can signal the potential natural resource of a country to focus on efficiency of transformation technologies by Research & Development Labors. For selected optimum alternative, incentive permissions can be realized by stakeholders.
REFERENCES
[1] "Photovoltaic Energy, Electricity From the Sun Technical Report," European Photovoltaic Industry Association, 2010.
[image:5.612.70.286.45.274.2][2] J. Carrasco, L. Franquelo, J. Bialasiewicz, E. Galvan, R. Portillo-Guisado, M. Prats, J. Leon and N. Moreno-Alfonso, in Power-Fig. 4. Heavy Environmental World’s Renewable Energy Map Fig. 3. Heavy Financial World’s Renewable Energy Map
Fig. 2. World’s Renewable Energy Map
TABLEXI
DIFFERENT WEIGHTS OF CRITERIA IN FINAL TOPSIS
Technical Financial Environmental
S1 0,6 0,2 0,2
S2 0,6 0,3 0,1
[image:5.612.310.527.341.516.2] [image:5.612.77.287.572.622.2]electronic systems for the grid integration of renewable energy sources: A survey, IEEE Transactions on Industrial Electronics, 2006, pp. 1002-1016.
[3] "Hydroelectric Power," in Future Energy: Improved, Sustainable and Clean Options for our Planet, 2013, pp. 453 - 470.
[4] J. Mathur and H. Wagner, in Introduction to Wind Energy Systems: Basics, Technology and Operation, Springer-Verlag, 2009.
[5] Q.-C. Zhong and T. Hornic, "Wind Turbines," in Control of Power Inverters in Renewable Energy and Smart Grid Integration, IEEE Press, 2013.
[6] "Termodinamik," 2015. [Online]. Available: http://www.termodinamik.info/?pid=28890.
[7] "NASA Surface meteorology and Solar Energy: Data Subset," [Online]. Available: https://eosweb.larc.nasa.gov/cgi-bin/sse/subset.cgi?email=skip%40larc.nasa.gov&latmin=&lonmin=& latmax=&lonmax=&month=4&tenyear=ws50_19_25&grid=none&s ubmit=Submit. [Accessed 2015].