Gate-Passing Detection Method Based on
WiFi Significant Points
Katsuhiko Kaji and Nobuo Kawaguchi
Abstract—We propose a gate-passing detection method based on WiFi signal strength and the accelerometers of user smart-phones. Since doors divide such physical areas as rooms and hallways, the WiFi environments tend to greatly vary. A gate should exist when the points in the WiFi environments vary on a large scale. We define such points as WiFi significant points and propose a detection method based on a WiFi distance function and estimated moving distance according to an accelerometer. We evaluated our proposed method and found out that most door passings can be detected. We also found that we can estimate the existence of doors that have identical door passings with a high degree of accuracy.
Index Terms—Door detection, Wireless-LAN, Accelerometer
I. INTRODUCTION
Gate passings, which refer to the entrances and exits to a building or a room and going by a corridor, are crucial information for indoor location-based services, especially for monitoring user activities, recognizing user migration pathways, and lifelogs.
Traditional gate-passing detection methods suffer from the following problems. The most general gate-passing detection method is IC card readers or RF tag readers attached to gates. In such situations, users touch the readers with their cards. The vision-based approach detects a gate [1]. Its door is extracted from the images captured by the camera attached to a robot or a user. The restrictions of camera locations burden general users. Another method uses proximity sensors [2], although general mobile terminals don’t have them.
In this paper, we propose a gate-passing detection method. We assume that users have general smartphones. In our method, we use WiFi signal information for gate detection and estimate the moving distance by accelerometers with which most smartphones are equipped. WiFi access points (APs) must be placed in the environment, even though many APs have already been placed in public buildings, universities, and offices.
The following is the outline of our proposed method. Since WiFi signal strength tends to be cut off or reduced by such gates as doors, we assume gates in a location where the WiFi environment greatly varies. To acquire the degree of variation of WiFi environments, we introduce and compare two kinds of moving distances that are based on WiFi and accelerometers. If the WiFi-based distance deviate from the accelerometer-based distance, we assume that the user is passing a gate.
Manuscript received February 18, 2013; revised April 9, 2013. K. Kaji and N. Kawaguchi are with the Graduate School of Engineering, Nagoya University. (e-mail:{kaji,kawaguti}@nuee.nagoya-u.ac.jp)
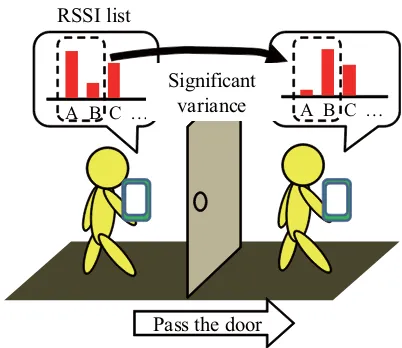
A B C … A B C …
RSSI list
Significant variance
[image:1.595.325.526.160.334.2]Pass the door
Fig. 1. WiFi environment variation by passing a door
A. Proposed method
Many objects divide spaces, such as doors, elevators, and walls. Such objects tend to cut off or weaken WiFi signal strength. The degree of decay depends on the object’s material and the physical relationship between the object and the AP. However, in many cases, WiFi environments separated by objects tend to be very different.
Figure 1 shows an example where a WiFi environment is different because it is separated by a door. If the user passes it, the WiFi environment changes. We assume that if the WiFi environment greatly varies, the user is passing a gate such as a door.
In this paper, we define a location where WiFi envi-ronments are separated by significantly different locations as a WiFi significant point. We assume a situation where users have standard smartphones and walk around indoors. Our method requires two kinds of moving distances. One is accelerometer-based step estimation, and the other is the distance based on the variation of WiFi signal strengths and the signal propagation model. If the latter distance deviate from the former distance, the method judges that the user has passed a WiFi significant point.
One typical signal propagation model is the Seidel model [3], which represents the relationship between the distance to an AP and its received signal strength indication (RSSI). With the model, we can estimate the distance to AP using RSSI.
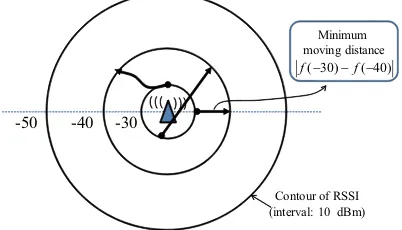
-30 -40 -50
) 40 ( ) 30 (− −f − f
Minimum moving distance
[image:2.595.69.270.57.172.2]Contour of RSSI (interval: 10 dBm)
Fig. 2. Possible variation of user trajectory when RSSI varies from -30 to -40 dBm
are estimated.
One distance is user minimum moving distancedminthat
is estimated by the WiFi information. When RSSIrt1at time
t1changes tort2at timet2, the minimum moving distance is
represented as the following formula using WiFi propagation modelf:
dmin=|f(rt1)−f(rt2)|. (1)
Figure 2 shows several possible trajectory examples where RSSI is changed from -30 to -40 dBm. When the user linearly moves away from the AP, the lengths of the distance of trajectories must be the shortest. The length is calculated as
|f(−30dBm)−f(−40dBm)|. If the user passed the WiFi significant point, estimated minimum distance dmin should be larger than the actual walking distance.
The other distance, which is maximum moving distance dmax between times t1 and t2, is estimated by an
ac-celerometer. Walking steps can be extracted by capturing the periodical local maximum and local minimum values of an accelerometer. Each step’s distance is estimated using the user’s height and the local maximum and local minimum values. Here, if the user is walking linearly, the distance is the sum of each step’s distance. If the user isn’t walking linearly, the distance between the user’s positions att1andt2
must be shorter than the distance of the linear walking. The sum of the walking distance must be the maximum distance. Based on dmin and dmax, we estimate whether the user passed the WiFi significant point during t1 and t2. The algorithm is shown in Fig. 3. If dmax exceeds dmin, the actual distance range can be estimated (Fig. 3, top). On the other hand, if the WiFi environment varies significantly during t1 and t2, dmin should be larger than the actual
walking distance, and dmin is probably larger than dmax
(Fig. 3, bottom). In such situations, we judge that valuedmin
is not reasonable. Consequently, we consider that the user passed the WiFi significant point duringt1 tot2.
B. Extending our proposed method for real environments
We introduce the effect of the fluctuation of RSSI and multiple WiFi information and extend our proposed method for real environments. In the real world, WiFi signals in-fluence multipath fading so that RSSI is not constant. Using the average or median RSSI values that are observed multiple times, the effect of fluctuation can be reduced. We imagine a situation where users aren’t standing, so WiFi RSSI cannot
distance
d
maxd
min0
Actual moving domain can be estimated min
max
d
d
≥
distance
d
maxd
min0
Actual moving domain cannot be estimated
WiFi significant point
min
max
d
d
<
dmin؟Minimum moving distance (based on WiFi)
[image:2.595.311.542.72.227.2]dmax؟Maximum moving distance (based on accelerometer)
Fig. 3. Fundamental basis of WiFi significant point extraction
be observed multiple times. The effect of fluctuation cannot be ignored. At the same time, we must consider the multiple WiFi information transmitted by multiple APs. Recently, since many APs have been placed in various buildings, we can receive multiple AP signals at a number of locations.
1) Effect of fluctuation of RSSI: First, we introduce the effect of the fluctuation of RSSI and reconstruct our above scheme as a stochastic model. In this paper, we approximate the fluctuation as a Gaussian distribution. Several researches adopt Gaussian distribution to approximate RSSI fluctuation [4], [5]. We also regard the level of fluctuation as constant. In ideal environments, the distance can be calculated using func-tionf and RSSIrμ, and the distance is expressed asf(rμ).
The fluctuation is expressed as a Gaussian whose average is rμ and the standard deviation isrσ (Fig. 4 top). At the time,
in the ideal environment, when RSSI is observed, distance rμ−rσ can be calculated asf(rμ)−f(rμ−rσ). Using the value, we approximate the distance fluctuation to AP as a Gaussian distribution where the average iswμ=f(rμ)and
the standard deviation is wσ =f(rμ)−f(rμ−rσ) (Fig. 4
bottom).
Minimum distance dmin, which we introduced above, is
expressed as a subtraction of Gaussian distributions. Conse-quently, minimum distancedmin is expressed as a Gaussian
whose average is dmin μ = wμ1−wμ2, and the standard
deviation isdmin σ= √
wσ1+wσ2.
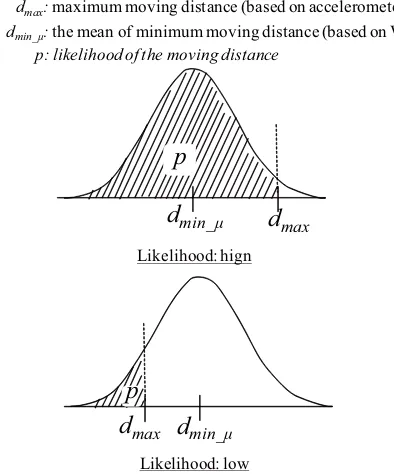
In the previous section, the existence probability of WiFi significant points is expressed as binary. On the other hand, by introducing fluctuation, the likelihood based on two kinds of distances dmax and dmin are expressed as cumulative probability (5 shaded area). The likelihood is calculated as Eq. 2. Here,erf(x)is an error function.
p=1
2(1 +erf(
dref−dμ
2d2σ )) (2) The top of Fig. 5 is an example where cumulative proba-bilitypis high. In short, the observed RSSI should probably be fluctuated. On the other hand, if p is under threshold pthreshold (Fig. 5, bottom), the observed RSSI is unlikely
distance
w
μw
σ RSSIFluctuation of estimated distance
distance
RSSI
r
μf(r
μ)
r
σf(r
μ- r
σ)
[image:3.595.318.536.50.200.2]Fluctuation of RSSI
Fig. 4. Conversion from RSSI fluctuation to distance fluctuation. (top: Gaussian distribution of RSSI, bottom: Gaussian distribution of distance)
d
min_μd
maxp
Likelihood: hign
d
min_μd
maxp
Likelihood: low
dmin_μ: the mean of minimum moving distance (based on WiFi)
dmax: maximum moving distance (based on accelerometer)
[image:3.595.91.248.55.288.2]p: likelihood of the moving distance
Fig. 5. Distance likelihood
Based on the fluctuation, a weak RSSI value should not be used to extract WiFi significant points. If the RSSI is weak, the estimated distance to the AP is significantly different if the RSSI value is fluctuated. For example, using the WiFi propagation model from the evaluation section, the distance where the RSSI is -80 dBm is 83 m, and the distance where it is -81 dBm is 91 m. The variance is only 1 dBm, but the difference of the estimated distances is 8 m. Therefore, we use RSSI values that exceed threshold rthreshold for WiFi
significant point extraction.
2) Multiple APs’ WiFi information: Next, we introduce multiple AP RSSI information. When the user passes a point where the WiFi environment changes significantly, RSSIs
A
B,C
A
2
1
1
time
D
1
A,B,C
A,D
3
2
time Votes number
BSSID
Votes number
[image:3.595.60.257.340.577.2]BSSID
Fig. 6. Voting and aggregation of WiFi significant points. Top: voting, bottom: aggregation
don’t always change simultaneously due to the mobile de-vice’s sensitivity and the device driver. Thus, the time instants that WiFi significant points are ovserved don’t always match. To reduce the problem, we aggregate WiFi significant points that come from each AP’s RSSI as one WiFi sig-nificant point.
Based on the previous section, the existence of WiFi sig-nificant points from each RSSI is judged in each observation interval between t and t+ 1. The WiFi significant points receive votes for their respective intervals. Then the interval that receives the most votes in a window, whose size is w, is deemed to be one WiFi significant point. Fig. 6 shows an example of the voting and the aggregation of WiFi significant points. The window size is 4. In the example, four zones are voted as WiFi significant point at first (Fig. 6 top). Then, according to the voting count and window size, they are aggregated as two zones (Fig. 6 bottom). Finally, these two zones are considered as WiFi significant point.
C. Identical gate-passing detection and passing direction estimation
The aggregated WiFi significant points consist of multiple WiFi significant points from multiple APs’ WiFi information. We believe that identical gate-passing detection can be real-ized using the pattern of the AP’s information. The pattern of i-th WiFi significant pointSiis expressed as a vector using the number of votes and voted BSSIDsb.
Si= [bi,0, bi,1, ..., bi,n] (3) The similarity of two arbitrary WiFi significant pointsSi, Sj is calculated using Tanimoto coefficientT [6]:
T = N(Si∩Sj)
N(Si) +N(Sj)−N(Si∩Sj)
. (4)
The Tanimoto coefficient is a similarity metric to evaluate two sets. If they are completely identical,T is 1. They don’t have a common element, and T is 0. Here, N(x) is the number of elements inx.
When similarityT exceeds similarity thresholdtthreshold,
WiFi significant pointsSi, Sj are estimated to be the same
Furthermore, we estimated the passing direction using the pattern of the variance of the RSSIs. For each common BSSID b in Si and Sj, we checked the variance direction to determine whether RSSI increased or decreased. If the variance direction is the same, Nsame is incremented. If
the variance direction is different, Ndif f is incremented. If
Nsame is larger than Ndif f, the user passed the gate from
the same direction, and if Ndif f are larger than Nsame, the
user passed the gate from a different direction.
D. Correction of WiFi significant points using accelerome-ters
As above, RSSIs don’t always change at the gate-passing moment. Based on our pilot study, the difference of the RSSI change timing and actual gate-passing timing is not zero, and the difference may be about ten seconds.
Next we corrected the WiFi significant point with an accelerometer. Generally, when a person passes a gate, the step interval is long, and each step length is short, even though the continuing time of the state is not so long. Based on the heuristics, we developed simple gate-passing timing estimation using an accelerometer. In our method, when the accelerometer’s local maximum and minimal are lower than threshold gthreshold and the continuing time is lower than
wthreshold, we assume the time zone is a gate passing. Here,
gthresholdmeans threshold of gate-acc andwthresholdmeans
threshold of gate-passing time.
If the time distance between a WiFi significant point and a gate-passing time is under window size w, the time of the WiFi significant point is corrected to the gate-passing time. When multiple WiFi significant points exist within the window, the nearest WiFi significant point is corrected as the gate-passing time.
Note that our door passing estimation is not very robust. Various situations probably exist where the estimation is not correct. For example, when the environment is crowded, people stand or walk slowly for a short time. The method is probably inaccurate when a person slow down to passes a corridor’s corner.
E. Restrictions
Our proposed method is very dependent on the physical relationships between gates and APs. Thus, not all gate passings can be detected by our method. If there are no APs around a gate, gate passings cannot be detected. Even if an AP exists around a gate, there are patterns of physical relationships between the AP and the gate where our method cannot extract gate passings. Fig. 7 shows two of the exam-ples. In such a situation as the top of Fig. 7, the RSSIs at points A and B are almost the same, so the gate passings cannot be extracted by the RSSI variance. In such a situation as the bottom of Fig. 7, the pattern of the RSSI variance of passing rooms C and D is almost the same. Thus, using our proposed identical gate-passing detection, the doors of the two rooms should be detected as the identical door.
Additionally, there are several restrictions to apply our proposed method. First, the gate must physically divide the environment like doors and elevators. Second, the person himself should open a gate to pass. If the door is already open, the RSSI variance cannot be captured.
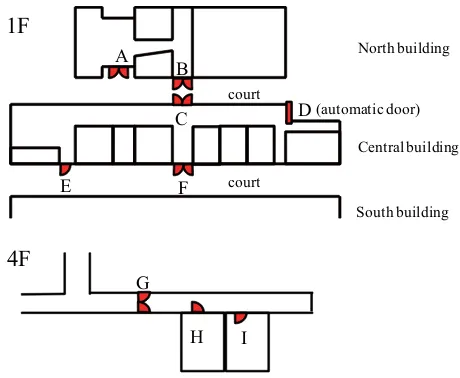
A
B
[image:4.595.326.527.50.199.2]C
D
Fig. 7. Examples of situations where it is impossible to apply proposed method
A B
C D(automatic door)
E F
1F
4F
court
court
G
H I
South building Central building North building
Fig. 8. Door alignment. Top: 1F, bottom: 4F
II. EXPERIMENTS
We experimentally evaluated the accuracy of our method using the gate-passing detection method and the identical gate-passing estimation method.
A. Experimental environment
We conducted our experiment on the 1st and 4th floors of the IB Information Buildings on Nagoya University. The door alignment and types are shown in Figs. 8 and 9. There were nine doors in the environment including one automatic door. Doors A F are the entrance doors of the buildings, and doors G I are inside the buildings.
Table I overviews the observation data. The subject is one of the authors of this paper who used an iPhone3G smartphone. He put it in his waist holder and walked around the experimental environment. His walking speed was not constant; standing and slow walking were included except for door passings. Our proposed method is applicable when users themselves open and close doors, so he opened and closed doors when passing them.
B. Settings
[image:4.595.310.540.242.431.2]A, B, C, E, F D
G H, I
Fig. 9. Door types
TABLE I
OVERVIEW OF EXPERIMENTAL DATA
Sampling rate of WiFi observation 1 Hz Sampling rate of accelerometer 100 Hz
Number of doors 9
Number of door passings A-F: 10 times, BG-I: 20 times Total experimental time 5300 seconds
f(r) =−32−25log10r (5)
Step lengths is calculated by the following formula [8].
s= 0.26·height+ (peakdif f−peakavg)·5.0. (6) Here, peakdif f is the difference between the value of the local maximum and the local minimum in each step and peakavg means the average value ofpeakdif f. The user’s height is height. In this experiment, we set the values as height= 1.80[m],peakavg= 1.11[g].
C. Results
1) Gate-passing detection method: Table III shows the result of gate-passing detection. We define correct answers to be when a detected gate passing is within 10 seconds of the actual door passing. The precision of the gate-passing detection was about 58%, and the recall was about 76%. Consequently, our proposed method detected about half of the door passings, but it doesn’t always detect them.
Figure 10 shows the accuracy of the gate-passing detection for individual doors. The maximum accuracy is 100%, and the minimum accuracy is 40.0%. Based on the results, the accuracy of the gate-passing detection significantly differs by door, even though gate-passing detection is possible when the user passes the door many times.
Automatic doors provide minimum accuracy. When pass-ing automatic doors, the step length around the door isn’t shorter than manual doors. This explains why the accuracy
TABLE II
EXPERIMENTAL PARAMETERS
Fluctuation of RSSIrσ 2.5 dBm Threshold of RSSIrthreshold -60 dBm Threshold of likelihoodpthreshold 0.1 % Threshold of similaritytthreshold 0.4
Window sizew 10 sec
Threshold of gate-accgthreshold 0.15 G Threshold of gate-passing timewthreshold 2.0 sec
TABLE III
ACCURACY OF GATE-PASSING DETECTION
Gate-passing detected points 157 Actual gate passings 120 Successful gate-passing detections 92
Precision 59%
Recall 76%
F-measure 66%
of automatic door passing detection is low. Of course, our method is influenced by the door’s material and the distribution of APs. This is one reason that the accuracy of gate-passing detection widely differs by door.
On the other hand, WiFi significant points were detected except for around the gate. One reason is the existence of WiFi hotspots caused by reflections and multipaths. For example, corridor’s corner tends to be WiFi hotspot.
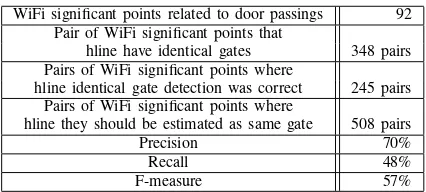
2) Identical gate-passing estimation: Using successfully detected points (92 points), we evaluated the identical gate-passing estimation. Precision, recall, and F-measure are shown in Table IV. Fig. 11 shows the individual door results of the identical gate estimation. The accuracy of door G is obviously higher than the other doors. Door G is the thickest, and one AP is placed near it. Such an ideal environment enhances the accuracy of identical gate-passing estimation.
The number of errors relevant to doors H and I is 43, 19 of which were mistaken for other doors. Doors H and I are located within 3 m of each other, so the pattern of their WiFi environments is similar.
Consequently, the accuracy of identical gate-passing es-timation is not as high as gate-passing detection, even though we found doors on which the identical gate-passing estimation method was successfully performed. Therefore, we believe that our method is useful for restrictive situations. For 245 pairs that were correctly estimated as the same gate, we applied the gate-passing direction estimation method, and the accuracy was 92%. Additionally, for door G whose accuracy of identical gate-passing estimation was high, the accuracy of the gate-passing direction estimation was 100%. Consequently, the gate-passing direction estima-tion method is generally useful.
III. RELATEDWORKS
0 0.2 0.4 0.6 0.8 1
[image:6.595.311.541.50.191.2]A B C D E F G H I
Fig. 10. Gate-passing detection accuracy for individual doors
TABLE IV
ACCURACY OF IDENTICAL GATE-PASSING ESTIMATION
WiFi significant points related to door passings 92 Pair of WiFi significant points that
hline have identical gates 348 pairs Pairs of WiFi significant points where
hline identical gate detection was correct 245 pairs Pairs of WiFi significant points where
hline they should be estimated as same gate 508 pairs
Precision 70%
Recall 48%
F-measure 57%
GPS-based building entrance/exit detection methods have also been proposed [10]. Generally, GPS signal strength tends to be weak Inside buildings. In our method, with training data that were observed beforehand, we generated a detection model. Therefore, a labor cost problem exists for prior observation. On the other hand, our proposed method needs no preparation.
Hotta proposed a robust room-level location estimation method [11]. When generating WiFi fingerprints, the distance to the nearest door is input. Additionally, they introduced a room transition probability, which is generated using the distance to the nearest door; the probability will be high when the location is near a certain door. Our method doesn’t just detect actual door passings; it also enhances the transition probability.
IV. CONCLUSION
We proposed a gate-passing detection method based on WiFi significant points. Our method is based on the assump-tion that WiFi environments, which are divided by gates, tend to be very different. Only WiFi and accelerometer information are used to detect gate passings. We conducted several experiments and found that our proposed method has the ability to detect more than half of the gate pass-ings. Identical gate-passing detection has very low accuracy. However, we found gates whose accuracy of identical gate-passing methods is high.
One application of our proposed method is the cumula-tive error correction of dead-reckoning [12]. By using the identical gate-passing detection method, cumulative error can be corrected based on the location passed before and after location.
REFERENCES
[1] Jauregi, E., Lazkano, E., Sierra, B., “Approaches to Door Identifica-tion for Robot NavigaIdentifica-tion,” inMobile Robots Navigation, Alejandra Barrera (Ed.), ISBN: 978-953-307-076-6, InTech, 2010, pp. 241–262.
0 0.2 0.4 0.6 0.8 1
A B C D E F G H I
Recall Precision F-measure
Fig. 11. Accuracy of identical gate-passing detection for each door
[2] Schindler, G., Metzger, C. Starner, T. , “A Wearable Interface for Topological Mapping and Localization in Indoor Environments,” in
Proceedings of Location- and Context-Awareness Second International Workshop,, 2006, pp. 64–73.
[3] Seidel, S., and Papport T., “914Mhz Path Loss Prediction Model for Indoor Wireless Communications in Multifloored Buildings,” in
Proceedings of IEEE Transactions on Antennas and Propagation, 1992, pp. 207–217.
[4] Ferris, B., Fox, D., Lawrence N., “WiFi-SLAM Using Gaussian Pro-cess Latent Variable Models,” inProceedings of the 20th international joint conference on Artifical intelligence(IJCAI’07), 2007, pp. 2480– 2485.
[5] Goswami, A., Ortiz, L.E., Das, S.R., “WiGEM: a Learning-based Approach for Indoor Localization,” in Proceedings of the Seventh COnference on emerging Networking EXperiments and Technolo-gies(CoNEXT’11), 2011.
[6] Segaran, T.,Programming Collective Intelligence: Building Smart Web 2.0 Applications. O’Reilly Media, 2008.
[7] LaMarca, A., Hightower, J., Smith, I., and Consolvo, S., “Self-Mapping in 802.11 Location Systems,” inProceedings of the Seventh International Conference on Ubiquitous Computing (Ubicomp2005), 2005, pp. 87–104.
[8] Anzai, K., Okajima, S., Tsubokawa, H., “The Estimate of the Indoor Position that Used a Smartphone and the Suggestion of the Walk Navigation Systems,” inMultimedia, Distributed, Coorporative, and Mobile Symposium (DICOMO2011), 2011, pp. 921–927.
[9] Patel, S.N., Reynolds, M.S., Abowd, G.D., “Detecting Human Move-ment by Differential Air Pressure Sensing,” inPervasive Proceedings of the 6th International Conference on Pervasive Computing, 2008, pp. 1–18.
[10] Katsuda, E., Uchiyama, A., Yamaguchi, H., Higashino, T., “Distin-guishing Indoor/Outdoor Using Training Data of GPS Status,” inIPSJ SIG Technical Report 2011-MBL-60(18), 2011, pp. 1–8.
[11] Hotta, S., Hada, Y., Yaginuma, Y., “A Robust Room-level Localization Method Based on Transition Probability for Indoor Environments,” in
Proceedings of International Conference on Indoor Positioning and Indoor Navigation, 2012., 2012.
[image:6.595.63.276.218.314.2]