Original Article
Genetic polymorphisms of INSIG2 were
associated with coronary artery disease in
Uygur Chinese population in Xinjiang, China
Dilare Adi1,2*, Yun Wu3*, Xiang Xie1,2, Gulinaer Baituola1,2, Fen Liu2, Ying-Ying Zheng1,2, Yi-Ning Yang1,2, Xiao-Mei Li1,2, Ding Huang1,2, Xiang Ma1,2, Bang-Dang Chen2, Min-Tao Gai2, Xiao-Cui Chen2, Zhen-Yan Fu1,2, Yi-Tong Ma1,2
1Department of Cardiology, First Affiliated Hospital of Xinjiang Medical University, Urumqi, People’s Republic
of China; 2Xinjiang Key Laboratory of Cardiovascular Disease Research, Urumqi, People’s Republic of China; 3Department of General Medicine, First Affiliated Hospital of Xinjiang Medical University, Urumqi, People’s
Republic of China. *Equal contributors.
Received February 24, 2016; Accepted May 21, 2016; Epub August 1, 2016; Published August 15, 2016
Abstract: Background: Dyslipidemia is a major and independent risk factor for the development of Coronary artery disease (CAD). The protein which is encoded by insulin induced gene2 (INSIG2) plays an important role in the media-tion of the feedback control of cholesterol synthesis, lipogenesis and glucose homeostasis. The aim of the present study was to assess the association between the human INSIG2 gene and CAD in Han Chinese and Uygur Chinese population of Xinjiang, China. Methods: A total of 832 CAD patients (334 Han, 498 Uygur) and 919 controls (346 Han, 573Uygur) were selected for the present Case-control study. Three tagging SNPs (rs1261829, rs21613329 and rs17047757) of INSIG2 gene were genotyped using TaqMan® assays from Applied Biosystems following the manufacturer’s instructions and analyzed in an ABI 7900HT Fast Real-Time PCR System. Results: In the Uygur Chinese population, for total, men and women the rs17047757 was associated with CAD by analyses of a domi-nant model (all, P < 0.001) and the difference remained significant after multiple adjustment in a dominant model (all, P < 0.001). This relationship was also observed in rs2161829 for total and women by analyses of a recessive model (for total: P = 0.002; for women: P = 0.001, respectively) the difference remained significant after multiple adjustment in a recessive model (for both, P = 0.001). However, this relationship was not observed in this three tagging SNPs before and after multiple adjustment in Han Chinese population. Conclusion: Our results indicated that both rs17047757 and rs21613329 in the INSIG2 gene were associated with CAD in Uygur Chinese population in Xinjiang, China.
Keywords: Genetics, INSIG2 gene, single nucleotide polymorphism, coronary artery disease, case-control study
Introduction
Coronary artery disease (CAD) is one of the leading causes of disability and mortality world-wide [1], the etiology and pathogenesis of CAD are that of a multi-factorial disorder that results from both genetic and environmental risk fac-tors. Dyslipidemia is a major and independent risk factor for the development of CAD and accounts for approximatively 50% of CAD cases in the population [2, 3].Accumulated eviden- ces suggest that heritable factors range from 40%~60% for the variation in concentration and components of the plasma lipids [4].
pro-teins [6, 7] and plays an important role in the mediation of the feedback control of cholester-ol synthesis, lipogenesis, glucose homeostasis [5, 8]. Studies conducted by Yabe D et al in vitro showed that when sterols are present in the cell ,INSIG2 blocks further cholesterol synthe-sis [6]; and studies in vivo also have demon-strated that over expression or down regulation of INSIG2 could significantly affect Cholesterol homeostasis and body weight of the animals [9, 10]. Krapivner et al showed that INSIG2 is also expressed in adipocytes and this expres-sion involved in adipocyte metabolism and body weight regulation [11].
Human INSIG2 is a ~21.5 Kb gene was identi-fied by Yabe et al and mapped on the long arm of chromosome 2, localized to band p14.1, and contains 225 amino acids [12]. Since Herbert et al [13] discovered in a genome-wide associa-tion study that genetic variaassocia-tion of rs7566605 in the upstream of the INSIG2 gene associat- ed with BMI, a several studies have explored genetic polymorphisms of INSIG2 gene with related metabolic traits and CAD, but studies of the association between genetic polymor-phisms of the INSIG2 gene and cardiovascular disease in diverse ethnicities remain controver-sial. Several studies have found that genetic polymorphisms of INSIG2 is not only associat-ed with CAD but also relatassociat-ed to the major risk factors of CAD, namely, overweight, obesity, hypercholesterolemia, diabetes while others have suggested that genetic polymorphisms of INSIG2 was not associated with CAD or the risk factors of the CAD. However, the relationship between genetic polymorphisms of the INSIG2 gene and CAD in Han and Uygur Chinese popu-lation of Xinjiang Uygur Autonomous Region northeast of China is remains unknown.
The aim of the present study is to determine the relationship between genetic polymorphism of INSIG2 gene and coronary artery disease in Han Chinese and Uygur Chinese population of China.
Material and methods
Ethical approval
This study was approved by the ethics commit-tee of the First Affiliated Hospital of Xinjiang Medical University (Xinjiang, China) and was conducted according to the standards of the
Declaration of Helsinki. Written informed con-sent was obtained from each participant for collection and analysis of relevant clinical data. Subjects
Anthropometric and biochemical variables measurement
Weight and height were measured in a stan-dard method, and body mass index (BMI) was calculated. After 5 min of rest, blood pressure was measured three times within 10 min and the median value was used in the statistical analysis. Smoking and drinking was self-report-ed using a questionnaire describself-report-ed previously [17]. After 12-hour overnight fasting, 5 mL of venous blood was collected into tubes contain-ing EDTA, sent to Xinjiang coronary artery dis-ease VIP laboratory and analyzed within 4 hours. Genomic DNA was extracted from peri- pheral leukocytes using a standard phenol-chloroform method and stored at -80°C for future analysis. Biochemical markers in serum such as total cholesterol (TC), triglycerides (TG), glucose, high-density lipoprotein cholesterol (HDL-c) and low-density lipoprotein cholesterol (LDL-c) were measured by Clinical Laboratory Department of the First Affiliated Hospital of Xinjiang Medical University with a standard method (AR/AVL Clinical Chemistry System; Dimension, Newark, NJ, USA).
SNP selection and Genotyping of INSIG2 gene
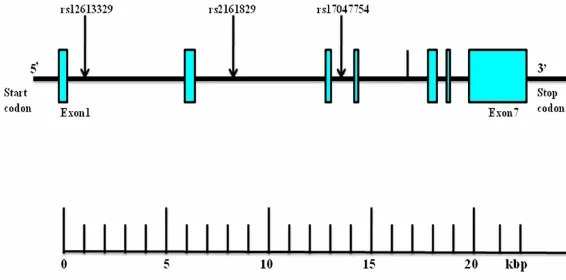
Using Haploview 4.2 software and International HapMap Project website phase I&II data base (http://hapmap.ncbi.nlm.nih.gov/i), we obtain- ed three tagging SNPs (rs12613329, rs216- 1829, rs17047757) for the Han Chinese popu-lation by using minor allele frequency (MAF) ≥ 0.05 , linkage disequilibrium (D’) across this three SNPs was D’ = 1. The numbering of the three SNPs (rs12613329, rs2161829, rs170- 47757) was by order of increasing distance from the INSIG2 gene 5’end (Figure 1).
along with 2 ng DNA, 2.375 μL ultrapure water, 0.079 μL Tris-EDTA (TE) buffer (1×), 0.046 μL TaqMan SNP Genotyping Assay Mix (40×) con -taining a 331.2 nmol/L final concentration of primers and a 73.6 nmol/L final concentration of the probes. The thermal cycling conditions were as follows: 50°C for 2 min; 95°C for 10 min; 50 cycles of 95°C for 15 s; and 60°C for 1 min. Biosystems). Finally the plates were read on the sequence detection system 9700 instru-ment with the end-point analysis mode of the sequence detection system version 1.6.3 soft-ware package (Applied Biosystems).
Statistical analyses
All statistical analyses were performed using SPSS 17.0 software for Windows (SPSS Insti- tute, Chicago, IL, USA). Deviation from the Hardy-Weinberg equilibrium (HWE) of the SNPs was tested by the χ2 analysis. Continuous vari-ables were compared using the general linear model and represented as means±standard deviation (SD). Logistic regression analyses with effect ratios (odds ratio [OR] and 95% CI) were used to assess contribution of major risk factors. Analyses of traits were adjusted for sex and age; fasting triglycerides were log-trans-formed using natural logarithms for analysis. Two-tailed P-values of 0.05 were considered significant.
Result
Clinical and metabolic characteristics of the subjects
[image:3.612.91.374.73.213.2]In Uygur Chinese population, for total, including men and women, body mass index, plasma concentration of glucose, triglyceride, LDL-c, Figure 1. Structure of the human INSIG2 gene. The gene consists of seven
exons (boxes) separated by six introns (lines; intergenic regions). Arrows indi-cate the locations of single-nucleotide polymorphisms (SNPs). kbp, kilobase pairs.
and prevalence of conventional risk factors for CAD including hypertension, diabetes mellitus and hyperlipidemia were significantly higher in subjects with CAD than in controls. No signifi -cant differences were found in age, sex, smok-ing, drinksmok-ing, and plasma concentration of tri-glyceride between CAD subjects and controls; compared with women, plasma concentration of total cholesterol was significantly higher in men subjects with CAD than in controls (Table 1).
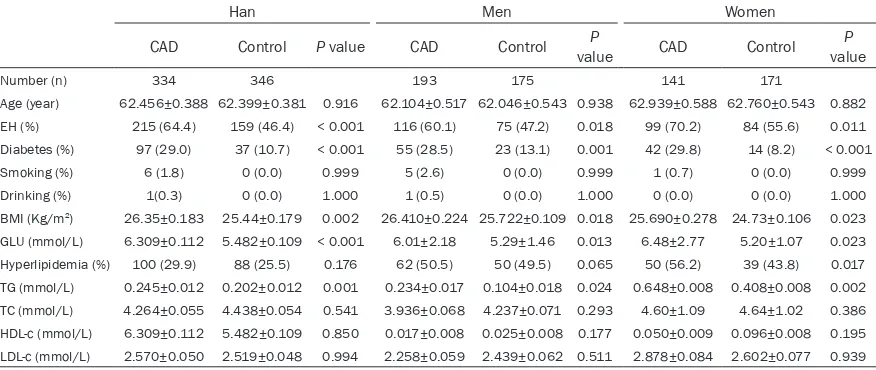
In Han Chinese population, for total, including men and women BMI, plasma concentration of glucose, triglyceride, the prevalence of
hyper-tension and diabetes mellitus were significan-tly higher in subjects with CAD than in controls. No significant differences were found in age, sex, drinking, smoking, plasma concentration of cholesterol, HDL-c and LDL-c between CAD subjects and controls; for women, prevalence of hyperlipidemia was higher in subjects with CAD than in controls (Table 2).
The distribution of genotypes and alleles of the three tagging SNPs
[image:4.612.84.530.84.268.2]The genotype distributions for each of the three tagging SNPs were in good agreement with the predicted Hardy-Weinberg equilibrium values
Table 1. Demographic and clinical characteristics of study participants (Uygur Chinese population)
Uygur Men Women
CAD Control valueP CAD Control valueP CAD Control valueP
Number (n) 498 573 243 279 255 294
Age (year) 54.452±0.450 53.534±0.420 0.142 56.469±0.662 55.538±0.618 0.304 52.435±0.611 51.531±0.569 0.279 EH (%) 279 (56.0) 192 (34.0) < 0.001 141 (58.0) 108 (39.6) 0.011 138 (54.1) 84 (28.9) < 0.001 Diabetes (%) 126 (25.3) 36 (6.3) < 0.001 75 (30.9) 24 (8.6) < 0.001 51 (20.0) 12 (4.1) 0.004 Smoking (%) 72 (14.5) 51 (8.9) 0.073 69 (28.4) 51 (18.3) 0.150 3 (1.2) 0 (0.0) 0.999 Drinking (%) 36 (7.2) 18 (3.1) 0.994 36 (14.8) 15 (5.4) 0.548 0 (0) 3 (1.0) 0.999 BMI (Kg/m2) 27.200±0.178 25.871±0.166 0.043 28.082±0.257 26.646±0.234 0.031 26.464±0.243 25.266±0.226 0.036
GLU (mmol/L) 5.676±0.098 5.109±0.90 0.001 6.230±0.171 5.330±0.155 < 0.001 5.232±0.097 4.865±0.090 0.001 Hyperlipidemia (%) 174 (34.9) 78 (13.6) < 0.001 105 (43.2) 57 (20.4) < 0.001 69 (27.1) 22 (7.5) < 0.001 TG (mmol/L) 0.196±0.011 0.073±0.010 0.020 0.227±0.017 0.057±0.016 0.041 0.153±0.014 0.034±0.013 0.037 TC (mmol/L) 4.823±0. 059 4.194±0. 055 0.767 5.029±0.092 4.421±0.086 0.021 4.629±0.072 4.133±0.067 0.093 HDL-c (mmol/L) 0.055±0.077 0.047±0.007 0.015 0.072±0.009 0.040±0.008 0.276 1.185±0.034 1.252±0.031 0.058 LDL-c (mmol/L) 3.160±0. 046 2.644±0. 043 0.002 3.259±0.092 2.478±0.055 0.032 3.118±0.067 2.781±0.063 0.012
Continuous variables are expressed as mean ±Std. Error. Categorical variables are expressed as percentages. BMI, body mass index; Glu, glucose; TG, triglyceride; TC, total cholesterol; HDL-c, high density lipoprotein; LDL-c, low density lipoprotein; EH, essential hypertension.
Table 2. Demographic and clinical characteristics of study participants (Han Chinese population)
Han Men Women
CAD Control P value CAD Control valueP CAD Control valueP
Number (n) 334 346 193 175 141 171
Age (year) 62.456±0.388 62.399±0.381 0.916 62.104±0.517 62.046±0.543 0.938 62.939±0.588 62.760±0.543 0.882 EH (%) 215 (64.4) 159 (46.4) < 0.001 116 (60.1) 75 (47.2) 0.018 99 (70.2) 84 (55.6) 0.011 Diabetes (%) 97 (29.0) 37 (10.7) < 0.001 55 (28.5) 23 (13.1) 0.001 42 (29.8) 14 (8.2) < 0.001 Smoking (%) 6 (1.8) 0 (0.0) 0.999 5 (2.6) 0 (0.0) 0.999 1 (0.7) 0 (0.0) 0.999 Drinking (%) 1(0.3) 0 (0.0) 1.000 1 (0.5) 0 (0.0) 1.000 0 (0.0) 0 (0.0) 1.000 BMI (Kg/m2) 26.35±0.183 25.44±0.179 0.002 26.410±0.224 25.722±0.109 0.018 25.690±0.278 24.73±0.106 0.023
GLU (mmol/L) 6.309±0.112 5.482±0.109 < 0.001 6.01±2.18 5.29±1.46 0.013 6.48±2.77 5.20±1.07 0.023 Hyperlipidemia (%) 100 (29.9) 88 (25.5) 0.176 62 (50.5) 50 (49.5) 0.065 50 (56.2) 39 (43.8) 0.017 TG (mmol/L) 0.245±0.012 0.202±0.012 0.001 0.234±0.017 0.104±0.018 0.024 0.648±0.008 0.408±0.008 0.002 TC (mmol/L) 4.264±0.055 4.438±0.054 0.541 3.936±0.068 4.237±0.071 0.293 4.60±1.09 4.64±1.02 0.386 HDL-c (mmol/L) 6.309±0.112 5.482±0.109 0.850 0.017±0.008 0.025±0.008 0.177 0.050±0.009 0.096±0.008 0.195 LDL-c (mmol/L) 2.570±0.050 2.519±0.048 0.994 2.258±0.059 2.439±0.062 0.511 2.878±0.084 2.602±0.077 0.939
[image:4.612.88.526.326.511.2]Table 3. Uygur Chinese population: Genotype and allele distributions in patients with CAD and control participants
Uygur Men Women
Variants CAD n (%) Control n (%) P value CAD n (%) Control n (%) valueP n (%)CAD Control n (%) valueP rs12613329(SNP1)
Genotype
C/C 18 (3.6) 30 (5.2) 12 (4.9) 21 (7.5) 6 (2.4) 9 (3.1) C/G 225 (45.2) 239 (41.7) 111 (45.7) 125 (45.2) 114 (44.7) 113 (38.4) G/G 255 (51.2) 304 (53.1) 0.297 120 (49.4) 132 (47.3) 0.475 135 (52.9) 172 (58.5) 0.332 Dominant model
GG 255 (51.2) 304 (53.1) 120 (49.4) 132 (47.3) 135 (52.9) 172 (58.5) CG+CC 243 (48.8) 269 (46.9) 0.581 123 (50.6) 147 (52.7) 0.661 120 (47.1) 122 (41.5) 0.197 Recessive model
CC 18 (3.6) 30 (5.2) 12 (4.9) 21 (7.5) 6 (2.4) 9 (3.1)
CG+GG 480 (96.4) 543 (94.8) 0.237 231 (95.1) 258 (92.5) 0.280 249 (97.6) 285 (96.9) 0.794 Allele
C 261 (26.2) 299 (26.1) 135 (27.8) 167 (30.0) 126 (24.7) 131 (22.3) G 735 (73.8) 847 (73.9) 0.961 351 (72.2) 389 (70.0) 0.452 384 (75.3) 457 (77.7) 0.354 rs2161829 (SNP2)
Genotype
A/A 105 (21.1) 131 (22.9) 45 (18.5) 53 (19.0) 60 (23.5) 78 (26.5) A/G 237 (47.6) 310 (54.4) 135 (55.6) 163 (58.4) 102 (40.0) 147 (50.0) G/G 156 (31.3) 132 (23.0) 0.009 63 (25.9) 63 (22.6) 0.674 93 (36.5) 69 (23.5) 0.003 Dominant model
AA 105 (21.1) 131 (22.9) 45 (18.5) 53 (19.0) 60 (23.5) 78 (26.5) GG+AG 393 (78.9) 442 (77.1) 0.506 198 (81.5) 226 (81.0) 0.911 195 (76.5) 216 (73.5) 0.432 Recessive model
GG 156 (31.3) 132 (23.0) 63 (25.9) 63 (22.6) 93 (36.5) 69 (23.5) AA+AG 342 (68.7) 441 (77.0) 0.002 180 (74.1) 216 (77.4) 0.412 162 (63.5) 225 (76.5) 0.001 Allele
A 447 (44.9) 572 (49.9) 225 (46.3) 269 (48.2) 222 (43.5) 303 (51.5) G 549 (55.1) 574 (50.1) 0.022 261 (53.7) 289 (51.8) 0.576 288 (56.6) 285 (48.5) 0.009 rs17047757 (SNP3)
Genotype
A/A 255 (51.2) 429 (74.9) 129 (53.1) 222 (79.6) 126 (49.4) 207 (70.4) A/G 201 (40.4) 135 (23.6) 84 (34.6) 57 (20.4) 117 (45.9) 78 (26.5)
G/G 42 (8.4) 9 (1.6) < 0.001 30 (12.3) 0 (0.00) < 0.001 12 (4.7) 9 (3.1) < 0.001 Dominant model
AA 255 (51.2) 429 (74.9) 129 (53.1) 222 (79.6) 126 (49.4) 207 (70.4) AG+GG 243 (48.8) 144 (25.1) < 0.001 114 (46.9) 57 (20.4) < 0.001 129 (50.6) 87 (29.6) < 0.001 Recessive model
GG 42 (8.4) 9 (1.6) 30 (12.3) 0 (0.00) 12 (4.7) 9 (3.1)
AG+AA 456 (91.6) 564 (98.4) < 0.001 213 (87.7) 279 (100) 0.003 243 (95.3) 285 (96.6) 0.357 Allele
A 711 (71.4) 993 (86.6) 342 (70.4) 501 (89.8) 369 (72.4) 492 (83.7) G 285 (28.6) 153 (13.4) < 0.001 144 (29.6) 57 (10.2) < 0.001 141 (27.6) 96 (16.3) < 0.001
CAD, Coronary artery disease; n, number of participants; SNP, single-nucleotide polymorphism.
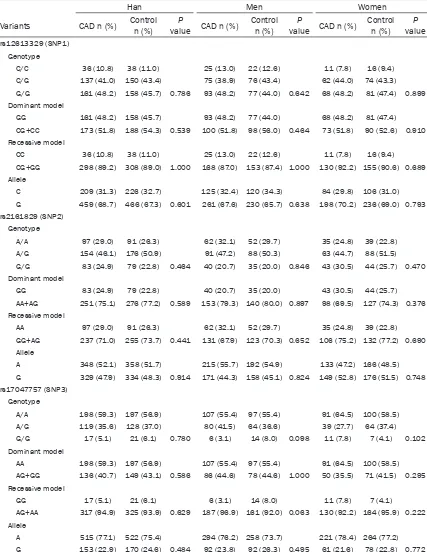
(Data not shown). Tables 3 and 4 shows the dis-tribution of genotypes and alleles of the three tagging SNPs of Chinese Han and Uygur popu-lation for INSIG2 gene.
-ence between CAD and control subjects (all P < 0.05, respectively), the G allele of SNP3 (rs17047757) was significantly higher in CAD
[image:6.612.93.520.97.649.2]patients than in control participants (total: 28.6% vs. 13.4%; men: 29.6% vs. 10.2%; women 27.6% vs. 16.3%). For total and women,
Table 4. Han Chinese population: Genotype and allele distributions in patients with CAD and control participants
Han Men Women
Variants CAD n (%) Control n (%) value CAD n (%)P Control n (%) value CAD n (%)P Control n (%) valueP rs12613329 (SNP1)
Genotype
C/C 36 (10.8) 38 (11.0) 25 (13.0) 22 (12.6) 11 (7.8) 16 (9.4) C/G 137 (41.0) 150 (43.4) 75 (38.9) 76 (43.4) 62 (44.0) 74 (43.3) G/G 161 (48.2) 158 (45.7) 0.786 93 (48.2) 77 (44.0) 0.642 68 (48.2) 81 (47.4) 0.899 Dominant model
GG 161 (48.2) 158 (45.7) 93 (48.2) 77 (44.0) 68 (48.2) 81 (47.4) CG+CC 173 (51.8) 188 (54.3) 0.539 100 (51.8) 98 (56.0) 0.464 73 (51.8) 90 (52.6) 0.910 Recessive model
CC 36 (10.8) 38 (11.0) 25 (13.0) 22 (12.6) 11 (7.8) 16 (9.4) CG+GG 298 (89.2) 308 (89.0) 1.000 168 (87.0) 153 (87.4) 1.000 130 (92.2) 155 (90.6) 0.689 Allele
C 209 (31.3) 226 (32.7) 125 (32.4) 120 (34.3) 84 (29.8) 106 (31.0) G 459 (68.7) 466 (67.3) 0.601 261 (67.6) 230 (65.7) 0.638 198 (70.2) 236 (69.0) 0.793 rs2161829 (SNP2)
Genotype
A/A 97 (29.0) 91 (26.3) 62 (32.1) 52 (29.7) 35 (24.8) 39 (22.8) A/G 154 (46.1) 176 (50.9) 91 (47.2) 88 (50.3) 63 (44.7) 88 (51.5) G/G 83 (24.9) 79 (22.8) 0.464 40 (20.7) 35 (20.0) 0.846 43 (30.5) 44 (25.7) 0.470 Dominant model
GG 83 (24.9) 79 (22.8) 40 (20.7) 35 (20.0) 43 (30.5) 44 (25.7) AA+AG 251 (75.1) 276 (77.2) 0.589 153 (79.3) 140 (80.0) 0.897 98 (69.5) 127 (74.3) 0.376 Recessive model
AA 97 (29.0) 91 (26.3) 62 (32.1) 52 (29.7) 35 (24.8) 39 (22.8) GG+AG 237 (71.0) 255 (73.7) 0.441 131 (67.9) 123 (70.3) 0.652 106 (75.2) 132 (77.2) 0.690 Allele
A 348 (52.1) 358 (51.7) 215 (55.7) 192 (54.9) 133 (47.2) 166 (48.5) G 329 (47.9) 334 (48.3) 0.914 171 (44.3) 158 (45.1) 0.824 149 (52.8) 176 (51.5) 0.748 rs17047757 (SNP3)
Genotype
A/A 198 (59.3) 197 (56.9) 107 (55.4) 97 (55.4) 91 (64.5) 100 (58.5) A/G 119 (35.6) 128 (37.0) 80 (41.5) 64 (36.6) 39 (27.7) 64 (37.4) G/G 17 (5.1) 21 (6.1) 0.780 6 (3.1) 14 (8.0) 0.098 11 (7.8) 7 (4.1) 0.102 Dominant model
AA 198 (59.3) 197 (56.9) 107 (55.4) 97 (55.4) 91 (64.5) 100 (58.5) AG+GG 136 (40.7) 149 (43.1) 0.586 86 (44.6) 78 (44.6) 1.000 50 (35.5) 71 (41.5) 0.295 Recessive model
GG 17 (5.1) 21 (6.1) 6 (3.1) 14 (8.0) 11 (7.8) 7 (4.1)
AG+AA 317 (94.9) 325 (93.9) 0.629 187 (96.9) 161 (92.0) 0.063 130 (92.2) 164 (95.9) 0.222 Allele
A 515 (77.1) 522 (75.4) 294 (76.2) 258 (73.7) 221 (78.4) 264 (77.2) G 153 (22.9) 170 (24.6) 0.484 92 (23.8) 92 (26.3) 0.495 61 (21.6) 78 (22.8) 0.772
the distribution of SNP2 (rs2161829) geno-types, allele frequency and recessive model (GG vs. AA+AG) showed significant difference between CAD and control subjects (all P < 0.05, respectively), the G allele of SNP2 (rs2161829) was significantly higher in CAD patients than in control participants (total: 55.1% vs. 50.1%; women: 56.6% vs. 48.5%). For men, the distri-bution of SNP2 (rs2161829) genotypes, allele frequency, dominant model (AA vs. GG+AG) and recessive model (GG vs. AA+AG) showed no sig-nificant difference between CAD and control subjects (all P > 0.05, respectively) and also the distribution of SNP1 (rs12613329) geno-types, allele frequency, dominant model (GG vs. CC+CG) and recessive model (CC vs. GG+CG) showed no significant difference between CAD and control subjects(all P > 0.05, respectively) (Table 3).
For the Han population, the distribution of the three tagging SNPs genotypes and alle- les showed no significant difference between the CAD patients and control subjects (Table 4).
Multiple logistic regression analysis for CAD patients and control subjects from Uygur Chinese population
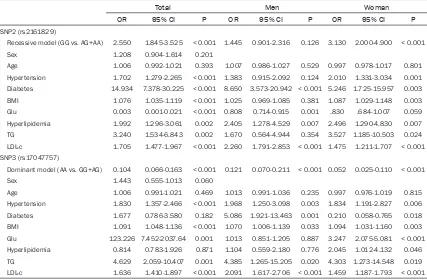
We used BMI, Glucose, plasma concentration of TG and LDL-c, incidence of hypertension, dia-betes, hyperlipidemia, rs17047757 (AA vs. GG+AG), rs2161829 (GG vs. AA+AG), which exhibited differences in the univariate analysis, and Putative confounders (age and sex) as the independent variables, CAD as the dependent variable to perform a multiple logistic regres-sion analysis (Table 5).
[image:7.612.93.520.97.377.2]For total and women, after multiple adjustment SNP2 (rs2161829) remained significantly asso -ciated with CAD in recessive model (for total: OR = 2.550, 95% confidence interval [CI]: 1.845-3.525, P < 0.001; for women: OR = 3.130, 95% confidence interval [CI]: 2.000-4.900, P < 0.001). For total, men and women, after multiple adjustment SNP3 (rs17047757) remained significantly associated with CAD in dominant model (for total: OR = 0.014, 95% confidence interval [CI]: 0.066-0.163, P < 0.001; for men: OR = 0.121, 95% confidence
Table 5. Multiple logistic regression analysis for CAD patients and control subjects of Uygur Chinese population
Total Men Woman
OR 95% CI P OR 95% CI P OR 95% CI P
SNP2 (rs2161829)
Recessive model (GG vs. AG+AA) 2.550 1.845-3.525 < 0.001 1.445 0.901-2.316 0.126 3.130 2.000-4.900 < 0.001
Sex 1.208 0.904-1.614 0.201
Age 1.006 0.992-1.021 0.393 1.007 0.986-1.027 0.529 0.997 0.978-1.017 0.801 Hypertension 1.702 1.279-2.265 < 0.001 1.383 0.915-2.092 0.124 2.010 1.331-3.034 0.001 Diabetes 14.934 7.378-30.225 < 0.001 8.650 3.573-20.942 < 0.001 5.246 1.725-15.957 0.003 BMI 1.076 1.035-1.119 < 0.001 1.025 0.969-1.085 0.381 1.087 1.029-1.148 0.003 Glu 0.003 0.001-0.021 < 0.001 0.808 0.714-0.915 0.001 .830 .684-1.007 0.059 Hyperlipidemia 1.992 1.296-3.061 0.002 2.405 1.278-4.529 0.007 2.496 1.290-4.830 0.007 TG 3.240 1.534-6.843 0.002 1.670 0.564-4.944 0.354 3.527 1.185-10.503 0.024 LDL-c 1.705 1.477-1.967 < 0.001 2.260 1.791-2.853 < 0.001 1.475 1.211-1.707 < 0.001 SNP3 (rs17047757)
Dominant model (AA vs. GG+AG) 0.104 0.066-0.163 < 0.001 0.121 0.070-0.211 < 0.001 0.052 0.025-0.110 < 0.001
Sex 1.443 0.555-1.013 0.060
interval [CI]: 0.070-0.211, P < 0.001; for women: OR = 0.052, 95% confidence interval [CI]: 0.025-0.110, P < 0.001) (Table 5).
Discussion
We found that variation in the INSIG2 gene is associated with CAD in Uygur Chinese popula-tion, but were not associated with CAD in Han Chinese population. We could hypothesized that there may exist ethnic difference between genetic polymorphism of the INSIG2 gene with CAD. To best of our knowledge, this was the first study to investigate the common allelic variants in INSIG2 gene and its association with CAD in Uygur Chinese population.
INSIG proteins are required for feedback regu-lation of cholesterol synthesis. INSIG proteins have two isoforms, designated as INSIG1 and INSIG2. INSIG1 was originally cloned by Peng et al. in regenerating liver [18] and was subse-quently shown to be dramatically elevated in the fat tissue of rats at the onset of diet-induced obesity [19]. In 2003, Yabe et al. reported the discovery of a liver-specific transcript of INSIG2 in rodents, named INSIG-2a, which differs from the ubiquitous transcript, called INSIG-2b, in the non-coding first exons that splice into a common second exon through the use of differ-ent promoters [6]. These two proteins were essential for feedback inhibition of cholesterol synthesis by virtue of their sterol dependent interaction with two other ER membrane pro-teins: sterol regulatory element-binding protein (SREBP) cleavage-activating protein (SCAP) and hydroxymethylglutaryl coenzyme A (HMG-CoA). (1) SCAP is an escort protein required for the proteolytic processing and activation of sterol regulatory element binding proteins (SREBPs) which are the transcription factors that activate genes encoding enzymes required for synthe-sis of cholesterol, unsaturated fatty acids, tri-glycerides, and phospholipids in liver and other organs [5, 8]; (2) HMG-CoA reductase (HMGR), the enzyme that catalyzes the rate-determining step of the cholesterol biosynthetic pathway The HMG- CoA reductase is a rate-controlling enzyme in cholesterol biosynthesis [20, 21]. These two proteins share a polytopic intra-membrane sequence called the sterol-sensing domain (SSD), through which the sterols cause SCAP and HMG-CoA reductase to bind INSIG proteins [22-26]. When cells are depleted of
sterols, SREBPs are transported by Scap from ER to Golgi, where they are processed pro- teolytically to yield active nuclear fragments (nSREBPs), Sterol-induced binding of SCAP to INSIG proteins leads to ER retention of SCAP, as a result, delivery of SCAP/SREBP complex to the Golgi will be prevented, causing transcrip-tional rates of SREBP target genes to decline and leading to a reduction in cholesterol syn-thesis and uptake [25, 26]. Binding of HMG-CoA reductase to INSIG proteins leads to the ubiquitination and degradation of the reduc-tase [12, 27]; finally by virtue of these dual activities, INSIG proteins cause coordinated links in both transcription of relevant genes and sterol pathway activity.
In the present study, however, we found that polymorphisms of INSIG2 gene were associat-ed with risk of CAD in a Uygur population in China. There was significant difference in geno -type distribution of SNP2 (rs2161829) and SNP3 (rs17047757) between CAD patients and control subjects, the GG genotype of both rs17047757 and rs2161829 were significantly higher in CAD patients than in control partici-pants, but these associations did not found in Chinese Han population in our study, this result was in line with the study of Liu et al [41]. The possible reason for these differences may be due to the interaction between ethnic differ-ences and environmental factors; Uygur popu-lation were mainly Caucasian and East Asian [42], according to the Statistics, the total Uygur population was 8.4 million in 2000, among whom 99.4% live in the Xinjiang Uygur Auto- nomous Region which is located in the center of Asia. There are some diet difference between Han Chinese and Uygur Chinese populations, the dietary patterns of Uygur Chinese popula-tion primarily characterized by high intakes of pasta, salt, beef, mutton, dairy products and milk products, drink coffees or tea and low intakes of vegetable, fruit and rice than Han Chinese population. Despite diet difference, ethnic difference may contribute to the differ-ent results between Han Chinese and Uygur Chinese populations. If we take the genetic diversity across different populations into con-sideration, the extent of linkage disequilibrium among the genetic variants are likely to vary, and this could also be another explanation of our study results. Thus further studies are nec-essary to deepen our understanding of differ-ent gene polymorphism among differdiffer-ent ethnic groups. Interestingly, in the univariate analysis, there have significant difference for hyperlipid -emia between Uygur Chinese case-control sub-jects, but this difference was not retained after multiple logistic regression analysis, maybe it is because of interaction between the risk factors which we included our multiple testing.
Study limitations
Current two independent case-control studies, however, harbors some limitations. First, the source of CAD patients was limited to The First Affiliate Hospital of Xinjiang Medical University, and these subjects may possess some risk fac-tors of cardiovascular disease. Second, our
CAD patients comes from the First Affiliate Hospital of Xinjiang Medical University and our control subjects comes from the CRS; when patients admitted in our hospital or when we conducted the CRS study we have not collect the dietary information, and we know that dietary information could be quite insightful, this was our another study limitations . Finally, the Uygur are an admixed population, originate from intermarriage between Caucasians and East Asian, mainly living in the Xinjiang Uygur Autonomous Region of China, lack of individual genetic back ground information was also our study limitations.
Conclusions
In conclusion, polymorphisms of INSIG2 gene were associated with CAD in Uygur Chinese population in China. Additional studies will need to be undertaken in order to clarify the underlying molecular mechanism which associ-ates polymorphism of INSIG2 gene with CAD among different ethnicity.
Acknowledgements
This work was supported by the grants from National Natural Science Foundation Joint Research Program of China (No. U1403221) and the grants from the National Natural Science Foundation of China (No. 81260041).
Disclosure of conflict of interest
None.
Address correspondence to: Yi-Tong Ma and Zhen-Yan Fu, Department of Cardiology, First Affiliated Hospital of Xinjiang Medical University, Urumqi 830054, People’s Republic of China. E-mail: myt_ xj@sina.com (YTM); fuzhenyan316@126.com (ZYF)
References
[1] Lopez AD, Mathers CD, Ezzati M, Jamison DT, Murray CJ. Global and regional burden of dis-ease and risk factors, 2001: Systematic analy-sis of population health data. Lancet 2006; 367: 1474-1457.
[2] Arsenault BJ, Boekholdt SM and Kastelein JJ. Lipid parameters for measuring risk of cardio-vascular disease. Nat Rev Cardiol 2011; 8: 197-206.
S, Sattar N, Packard CJ, Collins R, Thompson SG, Danesh J. Major lipids, apolipoproteins, and risk of vascular disease. JAMA 2009; 302: 1993-2000.
[4] Weiss LA, Pan L, Abney M, Ober C. The sex spe-cific genetic architecture of quantitative traits in humans. Nat Genet 2006; 38: 218-222. [5] Brown MS, Goldstein JL. The SREBP pathway:
Regulation of cholesterol metabolism by prote-olysis of a membrane-bound transcription fac-tor. Cell 1997; 89: 331-340.
[6] Yabe D, Brown MS, Goldstein JL. Insig-2, a sec-ond endoplasmic reticulum protein that binds SCAP and blocks export of sterol regulatory el-ement binding proteins. Proc Natl Acad Sci U S A 2002; 99: 12753-12758.
[7] Radhakrishnan A, Ikeda Y, Kwon HJ, Brown MS, Goldstein JL. Sterol-regulated transport of SREBPs from endoplasmic reticulum to Golgi: oxysterols block transport by binding to Insig. Proc Natl Acad Sci U S A 2007; 104: 6511-6518.
[8] Horton JD, Goldstein JL, Brown MS. SREBPs: activators of the complete program of choles-terol and fatty acid synthesis in the liver. J Clin Invest 2002; 109: 1125-1131.
[9] Takaishi K, Duplomb L, Wang MY, Li J, Unger RH. Hepatic insig-1 or-2 overexpression reduc-es lipogenreduc-esis in obreduc-ese Zucker diabetic fatty rats and in fasted/refednormal rats. Proc Natl Acad Sci U S A 2004; 101: 7106-7111. [10] Engelking LJ, Liang G, Hammer RE, Takaishi K,
Kuriyama H, Evers BM, Li WP, Horton JD, Goldstein JL, Brown MS. Schoenheimer effect explained-feedback regulation of cholesterol synthesis in mice mediated by Insig proteins. J Clin Invest 2005; 115: 2489-2498.
[11] Krapivner S, Popov S, Chernogubova E, Hellénius ML, Fisher RM, Hamsten A, van’t Hooft FM. Insulin-induced gene 2 involvement in human adipocyte metabolism and body weight regulation. J Clin Endocrinol Metab 2008; 93: 1995-2001.
[12] Jo Y, Debose-Boyd RA. Control of cholesterol synthesis through regulated ER-associated degradation of HMG CoA reductase. Crit Rev Biochem Mol Biol 2010; 45: 185-198.
[13] Herbert A, Gerry NP, McQueen MB, Heid IM, Pfeufer A, Illig T, Wichmann HE, Meitinger T, Hunter D, Hu FB, Colditz G, Hinney A, Hebebrand J, Koberwitz K, Zhu X, Cooper R, Ardlie K, Lyon H, Hirschhorn JN, Laird NM, Lenburg ME, Lange C, Christman MF. A com-mon genetic variant is associated with adult and childhood obesity. Science 2006; 312: 279-283.
[14] Xie X, Ma YT, Yang YN, Fu ZY, Li XM, Huang D, Ma X, Chen BD, Liu F. Polymorphisms in the SAA1/2 gene are associated with carotid
inti-ma media thickness in healthy Han Chinese subjects: the Cardiovascular Risk Survey. PLoS One 2010; 5: e13997.
[15] Xie X, Ma YT, Yang YN, Fu ZY, Li XM, Zheng YY, Huang D, Ma X, Chen BD, Liu F. Polymorphisms in the SAA1 gene are associated with ankle-to-brachial index in Han Chinese healthy sub-jects. Blood Press 2011; 20: 232-238. [16] Joint Committee for Developing Chinese
guide-lines on Prevention and Treatment of Dyslipi- demia in Adults. Chinese Guidelines on pre-vention and treatment of dyslipidemia in adults. Zhonghua Bing Xin Xue Guan Za Zhi 2007; 35: 390-419.
[17] Xie X, Ma YT, Fu ZY, Yang YN, Xiang Ma, Chen BD, Wang YH, Fen Liu. Haplotype Analysis of the CYP8A1 gene associated with myocardial infarction. Clin Appl Thromb Hemost 2009; 15: 574-580.
[18] Peng Y, Schwarz EJ, Lazar MA, Genin A, Spinner NB, Taub R. Cloning, human chromosomal as-signment, and adipose and hepatic expression of the CL-6/INSIG1 gene. Genomics 1997; 43: 278-284.
[19] Li J, Yu X, Pan W, Unger RH. Gene expression profile of rat adipose tissue at the onset of high-fat-diet obesity. Am J Physiol Metab 2002; 282: E1334-1341.
[20] Gil G, Faust JR, Chin DJ, Goldstein JL, Brown MS. Membrane-bound domain of HMG CoA re-ductase is required for sterol-enhanced degra-dation of the enzyme. Cell 1985; 41: 249-258. [21] Skalnik DG, Narita H, Kent C, Simoni RD. The
membrane domain of 3-hydroxy-3-methylglu-taryl-coenzyme A reductase confers endoplas-mic reticulum localization and sterol-regulated degradation onto β-galactosidase. J Biol Chem 1988; 263: 6836-6841.
[22] Hua X, Nohturfft A, Goldstein JL, Brown MS. Sterol resistance in CHO cells traced to point mutation in SREBP cleavage activating protein (SCAP). Cell 1996; 87: 415-426.
[23] Yang T, Goldstein JL, Brown MS. Over expres-sion of membrane domain of SCAP prevents sterols from inhibiting SCAP/ SREBP exit from endoplasmic reticulum. J Biol Chem 2000; 275: 29881-29886.
[24] Sever N, Yang T, Brown MS, Goldstein JL, DeBose-Boyd RA. Accelerated degradation of HMG CoA reductase mediated by binding of Insig-1 to its sterol-sensing domain. Mol Cell 2003; 11: 25-33.
[26] Ye J, DeBose-Boyd RA. Regulation of choles-terol and fatty acid synthesis. Cold Spring Harb Perspect. Biol 2011; 3.
[27] Sever N, Song BL, Yabe D, Goldstein JL, Brown MS, DeBose-Boyd RA. Insig-dependent ubiqui-tination and degradation of mammalian 3-hy-droxy-3-methylglutaryl-CoA reductase stimu-lated by sterols and geranylgeraniol. J Biol Chem 2003; 278: 52479-52490.
[28] Talbert ME, Langefeld CD, Ziegler JT, Haffner SM, Norris JM, Bowden DW. INSIG2 SNPs as-sociated with obesity and glucose homeosta-sis traits in Hispanics: the IRAS Family Study. Obesity (Silver Spring) 2009; 17: 1554-1562. [29] Oki K, Yamane K, Kamei N, Asao T, Awaya T,
Kohno N. The single nucleotide polymorphism upstream of insulin-induced gene 2 (INSIG2) is associated with the prevalence of hypercholes-terolaemia, but not with obesity, in Japanese American women. Br J Nutr 2009; 101: 322-327.
[30] Fornage M, Papanicolaou G, Lewis CE, Boerwinkle E, Siscovick DS. Common INSIG2 polymorphisms are associated with age-relat-ed changes in body size and high-density li- poprotein cholesterol from young adulthood to middle age. Metabolism 2010; 59: 1084-1091.
[31] Do R, Bailey SD, Pare G, Montpetit A, Desbiens K, Hudson TJ, Yusuf S, Bouchard C, Gaudet D, Pérusse L, Anand S, Vohl MC, Pastinen T, Engert JC. Fine mapping of the insulin induced gene 2 identifies a variant associated with LDL cholesterol and total apolipoprotein B levels. Circ Cardiovasc Genet 2010; 3: 454-461. [32] Wang HJ, Zhang H, Zhang SW, Pan YP, Ma J.
Association of the common genetic variant up-stream of INSIG2 gene with obesity related phenotypes in Chinese children and adoles-cents. Biomed Environ Sci 2008; 21: 528-536. [33] Baylin A, Deka R, Tuitele J, Viali S, Weeks DE,
McGarvey ST. INSIG2 variants, dietary pat-terns, and metabolic risk in Samoa. Eur J Clin Nutr 2013; 67: 101-107.
[34] Wiedmann S, Neureuther K, Stark K, Reinhard W, Kallmünzer B, Baessler A, Fischer M, Linsel-Nitschke P, Erdmann J, Schunkert H, Hengstenberg C. Lack of association between a common polymorphism near the INSIG2 gene and BMI, myocardial infarction, and car-diovascular risk factors. Obesity (Silver Spring) 2009; 17: 1390-1395.
[35] Cha S, Koo I, Choi SM, Park BL, Kim KS, Kim JR, Shin HD, Kim JY. Association analyses of the INSIG2 polymorphism in the obesity and cholesterol levels of Korean populations. BMC Med Genet 2009; 10:96.
[36] Hubacek JA, Kuthanova L, Bohuslavova R, Adámková V, Lánská V, Meitinger T, Pfeufer A. INSIG2 promoter variant, obesity markers and lipid parameters No association in a large Slavonic Caucasian population sample. Folia Biol (Praha) 2010; 56: 131-134.
[37] Andreasen CH, Mogensen MS, Borch-Johnsen K, Sandbaek A, Lauritzen T, Sørensen TI, Hansen L, Almind K, Jørgensen T, Pedersen O, Hansen T. Non-replication of genome-wide based associations between common variants in INSIG2 and PFKP and obesity in studies of 18,014 Danes. PLoS One 2008; 3: e2872. [38] Campa D, Hüsing A, McKay JD, Sinilnikova
O, Vogel U, Tjønneland A, Overvad K, Stegger J, Clavel-Chapelon F, Chabbert-Buffet N, Fagherazzi G, Trichopoulou A, Zylis D, Oustoglou E, Rohrmann S, Teucher B, Fisher E, Boeing H, Masala G, Krogh V, Sacerdote C, Panico S, Tumino R, Onland-Moret NC, van Gils CH, Bueno-de-Mesquita HB, Lund E, Chirlaque MD, Sala N, Quirós JR, Ardanaz E, Amiano P, Molina-Montes E, Hallmans G, Lenner P, Travis RC, Key TJ, Wareham N, Khaw KT, Rinaldi S, Slimani N, Chajes V, Siddiq A, Riboli E, Kaaks R, Canzian F. The INSIG2 rs7566605 polymor-phism is not associated with body mass index and breast cancer risk. BMC Cancer 2010; 10: 563.
[39] Apalasamy YD, Moy FM, Rampal S, Bulgiba A, Mohamed Z. Genetic associations of the INSIG2 rs7566605 polymorphism with obesi-ty-related metabolic traits in Malaysian Malays. Genetic Mol Res 2014; 13: 4904-4910. [40] Liu X, Li Y, Wang L, Zhao Q, Lu X, Huang J, Fan
Z, Gu D. The INSIG1 gene, not the INSIG2 gene, associated with coronary heart disease: tagSNPs and haplotype-based association study: The Beijing Atherosclerosis Study. Th- romb Haemost 2008; 100: 886-892.
[41] Skelding KA, Gerhard GS, Vlachos H, Selzer F, Kelsey SF, Chu X, Erdman R, Williams DO, Kip KE. Association of an INSIG2 obesity allele with cardiovascular phenotypes is gender and age dependent. BMC Cardiovascular Disorders 2010; 10: 46.