Int J Clin Exp Pathol (2009) 2, 519-527
www.ijcep.com
/IJCEP903002
Original Article
MicroRNA Expression Profiling Outperforms mRNA
Expression Profiling in Formalin-fixed Paraffin-embedded
Tissues
Aihua Liu*, Michael T. Tetzlaff*, Pat VanBelle, David Elder, Michael Feldman, John W. Tobias, Antonia R. Sepulveda and Xiaowei Xu
Department of Pathology and Laboratory Medicine, 6 Founders Pavilion, The Hospital for the University of Pennsylvania, 3400 Spruce Street, Philadelphia, PA 19040
Received 03 March 2009; Accepted and Available online 20 March 2009
Abstract: microRNAs (miRNAs) are ~22nt RNAs that regulate target gene expression. Altered expression of miRNAs has been demonstrated in many different human cancers. Many studies using microarray technologies to characterize miRNA expression profiles have relied on fresh tissue to determine the miRNA signatures. In this study, we prepared total RNA from paired samples of formalin-fixed paraffin-embedded (FFPE) and fresh frozen malignant melanoma, and used that in microarray experiments to compare miRNA expression profiles between FFPE and fresh tissue with corresponding mRNA expression profiles from the same tissue sources. We demonstrate that miRNA expression profile from FFPE tissues closely resembles that from fresh tissues, and the correlation is significantly better than that for mRNA profiles from FFPE and fresh tissues. These results underscore the suitability of FFPE tissues as appropriate resources for molecular expression analyses and support the notion that miRNAs are more vigorous analytes for this purpose than mRNAs.
Key Words: miRNA, melanoma, formalin-fixed paraffin-embedded (FFPE), microarray
Introduction
MicroRNAs (miRNAs) are non-coding RNAs of approximately 20-22 nucleotides in length in their active form. They function in a diverse set o f b i o l o g i c a l p r o c e s s e s , i n c l u d i n g differentiation, proliferation and apoptosis. They are transcribed as longer precursor RNAs of ~60-110 nucleotides in length and form a stem loop structure (pri-miRNAs and pre-miRNAs). Their maturation occurs through a series of nuclear and cytoplasmic cleavage events mediated by the Drosha and Dicer endonucleases, which result in the formation of a ~22 nucleotide RNA:RNA duplex. One strand of this duplex is incorporated into the RNA Induced Silencing Complex (RISC). RISC is a multi-protein complex that first facilitates the annealing between the active single stranded miRNA to its target mRNA, and then mediates the down-regulation of target mRNA gene
__________________
* These authors contributed equally to this work.
expression. The latter occurs either through target mRNA cleavage or translational repression [1-3].
Dysregulation of miRNA expression has been linked to cancer. Alterations in the expression profiles of many miRNAs have been described in numerous human tumors [2, 4]. Larger scale miRNA analyses underscore the robustness of miRNA expression signatures as informative molecular surrogates, facilitating the distinction of benign tissues from their malignant counterparts, as well as the utility of miRNA expression signatures in clustering histologically ambiguous tumors according to their cell of origin [5-7].
tissue. However, given the enormous amount of physiologic information stored in archived formalin-fixed paraffin-embedded tissue (FFPE) and the abundance of clinical data retrievable in association with it, it will prove invaluable if miRNA expression levels could be routinely and systematically analyzed in FFPE tissues, particularly for retrospective studies and for the characterization of rare or small tumors. Indeed, numerous studies have documented that it is feasible and informative to characterize miRNA from frozen tissue, and an increasing number of studies have demonstrated this with FFPE using qRT-PCR [13-16], as well as microarrays [6, 12, 16-20]. Consistent among these studies is a strong correlation of miRNA expression levels between paired FFPE and frozen tissues that is largely independent of time of fixation as well as storage time in paraffin (up to approximately 10 years without significant compromise of miRNA expression detection) [15-17]. Although relatively few studies have directly compared miRNA and mRNA expression levels from paired FFPE and frozen samples, these similarly demonstrate a consistent greater correlation of miRNA expression levels compared to mRNA expression levels between paired FFPE and fresh tissues [13, 16].
In this study, we confirm the reproducibility of extracting adequate amounts of intact mRNA and miRNA from paired frozen and FFPE tissue samples of malignant melanoma to characterize the relative miRNA and mRNA expression profiles in these matched tissue samples. However, we demonstrate that miRNA is a far more vigorous analyte than mRNA for the interrogation of FFPE tissue. These results underscore the robustness of miRNA expression profiling and more importantly, support the applicability of FFPE tissues as important resources to characterize important molecular pathways and targets in human malignancy.
Materials and Methods
Sample Selection and RNA Extraction
All tissues were collected according to the guidelines and policies of the Hospital of the University of Pennsylvania Institutional Board. Fresh frozen melanoma tissues were divided and half kept frozen and half fixed in formalin and processed for paraffin embedded. Over
90% of the tissue is composed of tumor cells. For frozen tissue, three (3) 10 µm sections per biological sample were obtained for the extraction of total RNA using mirVana (Ambion #1560) isolation kit for both mRNA and miRNA profiling, according to the manufacturer’s instructions. Four (4) 20 µm sections per sample were obtained from the selected block for the extraction of total RNA using the RecoverAllTM Total Nucleic Acid Isolation
system (Ambion, Cat# 1975) according to the manufacturer's instructions. The total RNA yield was determined using a NanoDrop ND-1000 spectrophotometer (NanoDrop Tech, Wilmington, DE). RNA integrity was assessed by Agilent 2100 Bioanalyzer electrophoresis compared to standard reference RNA as previously described for total RNA prepared from FFPE tissue [12, 19, 21].
mRNA Amplification, Labeling and Hybridization
The NuGEN WT-ovation FFPE system (Cat# 3400) was utilized for all amplifications, according to the manufacturer’s instructions. Amplifications were performed starting with 100 ng of total RNA for both fresh frozen samples and FFPE. The amplified cDNA product was quantitated using a NanoDrop ND-1000. 5 µg of amplified cDNA was labeled with the NuGEN FL-Ovation cDNA Biotin Module V2 (Cat# 4200) following the manufacturer’s instructions. Fragmented and biotin-labeled target was hybridized to Affymetrix HG-U133A Plus2.0 GeneChip arrays. Hybridization, washing, staining and scanning were performed according to manufacturer’s instructions.
miRNA Microarrays
Human Affymetrix (U133+V2.0) chips and hybridized according to the manufacturer’s instructions.
Data Analysis and Statistical Analysis
Ratio Analysis: GenePix results files (GPR) were imported into Partek Genomics Suite (v6.4, Partek, Inc., St. Louis, MO). Normalization of miRNA array data was performed as follows. The on-chip replicate signal intensities (quadruplicate spots of a particular miRNA sequence) were first averaged for each identifier (miRNA sequence). Next, for each identifier, we subtracted the background median signal from the averaged signal intensity. Any value less than 1 was assigned a value of 1 for ease of future manipulations (see below). LoESS normalization was applied to correct for intensity dependent dye effects, yielding log2
ratios for each probe. For each dye swapped pair of frozen and FFPE tissues, the average log2 ratio of FFPE:frozen signal was calculated,
imported into an Excel spread sheet (normalized and averaged ratio of FFPE tissue signal/frozen tissue signal).
Affymetrix mRNA expression data was generated using a single color array platform. 34,321 discrete probesets were selected following a raw intensity filter across all arrays. In order to facilitate a comparison with the miRNA expression data which was generated from a two-color array platform, this expression data was also converted into a ratio. For each patient sample, the signal ratio (FFPE tissue/frozen tissue) was calculated for each of the 34,321 individual spots, imported into an Excel spread sheet and log2
transformed (normalized and averaged ratio of FFPE tissue signal/frozen tissue signal).
These data were then plotted. The standard deviation from a mean of zero (0) was calculated for both miRNA signals and mRNA signals.
Intensity Analysis: Raw Affymetrix data files were processed as above with the exception of the ratio calculation. This yielded log2
transformed intensities for 34,321 probesets for each of the 6 samples. For the miRNA data, intensities were extracted as above, yielding 2 intensities (one for each dye) for each of the 6 biological samples. For each sample the dye-specific intensities were averaged, yielding a
single average intensity for each sample. Any value less than one was assigned a value of 1 and the data were log2 transformed. Pairwise
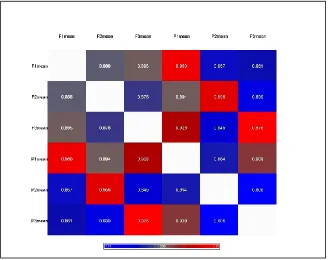
Pearson correlations were calculated for the miRNA data. These are reported in a table with the color of each cell corresponding to the r-value.
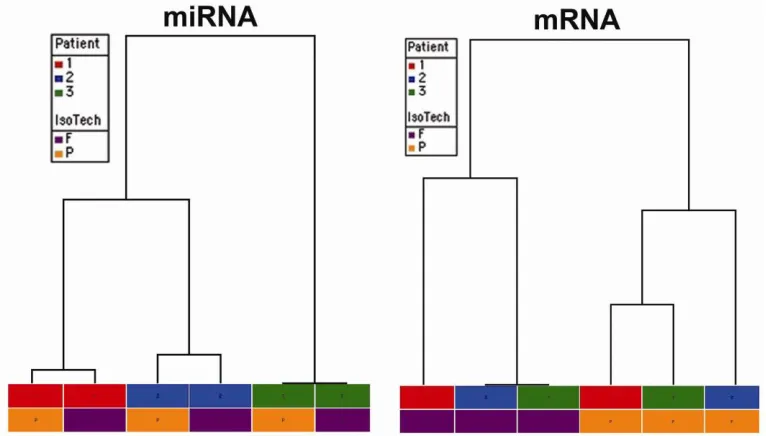
Both miRNA and Affymetrix intensities were clustered hierarchically using Euclidean distance and average linkage. The dendograms displaying the relative similarity relationship among the samples from each dataset are presented in Figure 4.
Results
Quality and Quantity of Total RNA
Total RNA was prepared from matched frozen and FFPE samples of malignant melanoma. All sample sources (matched frozen and FFPE) yielded adequate amounts of total RNA for labeling and microarray hybridization. Inspection of RNA by Agilent Bioanalyzer electrophoresis demonstrated a discrete miRNA peak from the frozen tissue and a similar, albeit slightly obscured peak from the FFPE tissue (Figure 1). These observations are consistent with previous studies, which described a similar profile and attributed this obscuring peak to degraded mRNA, tRNA and rRNA [20].
miRNA Expression Profiles from FFPE Tissue closely Recapitulate Those from Fresh Frozen Tissue
We first examined the similarity between miRNA expression profiles between paired fresh-frozen and FFPE samples from the same patient using intensity data from the microarrays (see Methods). As illustrated in Figure 2, the miRNA expression profiles from FFPE tissue correlate most highly with those generated from the matched fresh frozen tissue from the same original tissue source (r value ranges from 0.956 to 0.976).
Stronger Correlation of miRNA than mRNA Levels between Fresh Frozen and FFPE Tissues
Figure 1 Representative total RNA integrity analysis using Agilent 2100 bioanalyzer. Upper panel: fresh frozen human melanoma tissue. Lower panel: matched FFPE tissue
[image:4.612.143.471.419.679.2]Figure 3 Comparison of the relative variance of signals generated from FFPE compared to matched frozen tissue. Plots demonstrate log2-ratio of FFPE:frozen signals of the complete set of analyzed miRNAs (blue) and the
complete set of mRNAs (red) from three separate malignant melanoma samples.
[image:5.612.116.499.416.634.2]miRNA expression data - generated from a two-color array platform - and the mRNA expression data - generated from a single color Affymetrix array platform, we chose to represent all data as a log2-ratio of
FFPE:frozen signal for each spot. In this way, we could compare the relative distribution of these log2-transformed ratios as a reflection of
the relative variance of signals generated from FFPE compared to matched frozen tissue for the complete set of miRNAs versus the complete set of mRNAs. Minimal variance between the FFPE and frozen sample would be predicted to generate a signal ratio of one (1) and a log2-(ratio) of zero (0). In contrast,
discrepancies between these values would produce a signal ratio unequal to one and therefore, a log2-(ratio) unequal to zero (0). As
shown in Figure 3, the log2-ratios for mRNA
signals exhibit significantly greater dispersion about 0 than the log2-ratios for miRNA signals.
Consistent with this, the standard deviation from the mean of zero (0) for the log2-miRNA
ratios was 0.357, compared to a standard deviation of 1.001 for the log2-mRNA ratios
from the same samples.
Hierarchical Clustering Demonstrates a Closer Relationship between Paired Samples for miRNA Expression Profiles than for mRNA Expression Profiles
Using the intensity data, miRNA and Affymetrix signal intensities were subjected to hierarchical clustering (see Methods). The dendograms displaying the relative similarity relationship among the samples from each dataset are presented in Figure 4. This clustering analysis demonstrates that miRNA expression signatures cluster most closely according to the origin of the sample: the miRNA expression profiles are most similar between paired fresh-frozen and FFPE (i.e. from an individual patient). In contrast, mRNA expression signatures cluster according to the method by which the tissue was prepared (fresh-frozen versus FFPE, see Figure 4) and are independent of the individual patient from which a given tissue source was procured.
Discussion
In this study, we extracted mRNA and miRNA from paired frozen and FFPE tissue samples of malignant melanoma for expression profiling experiments. To our knowledge, this is the first study directly comparing both miRNA as well
as mRNA relative expression levels in paired fresh and FFPE samples of primary malignant melanoma. Using microarrays and total RNA derived from benign melanocytic nevi in paired fresh and FFPE tissue samples, Glud et al demonstrated a similarly strong correlation for miRNA signals (overall Spearman correlation coefficient of 0.80) [22]. We demonstrate that although there is degradation observed in the total RNA prepared from FFPE tissue compared to concomitantly prepared matched fresh-frozen tissue, miRNA expression profiles from FFPE malignant melanoma samples faithfully recapitulate those from matched fresh frozen tissue; this correlation is significantly better comparing miRNA versus mRNA employing distinct statistical approaches. Indeed, the smaller standard deviation for the log2-miRNA ratios of
fresh:FFPE (0.357) compared to that for log2
-mRNA ratios (1.001) confirms a greater degree of correlation for miRNA - compared to mRNA - expression profiles in paired fresh-frozen and FFPE tissue samples. These results are consistent with previous studies demonstrating that miRNA is a more vigorous analyte than mRNA for the interrogation of FFPE tissue.
The standard of source tissue for most miRNA expression profiling studies has traditionally been fresh-frozen tissue. However, there is an increasing body of evidence demonstrating that FFPE is an equally reliable resource for this purpose [5, 6, 12-21]. A subset of these studies employed RT-PCR to directly compare miRNA expression levels between paired FFPE and frozen tissues to mRNA expression levels from the same tissue pairs [13, 16]. Using RT-PCR, Xi et al demonstrated significantly greater degrees of correlation for miRNA (r2
=0.86-0.89) than for mRNA (r2=0.28-0.56) from
(Figure 3). Most importantly, when the intensity data is subjected to hierarchical clustering analysis, miRNA expression profiles from fresh frozen and FFPE tissue sources cluster most closely according to the patient from which they were prepared. In contrast, mRNA expression profiles are most similar among the fresh frozen samples and FFPE, respectively independent of the source from which they were derived. These results argue that miRNA expression profiles derived from FFPE samples faithfully recapitulate the distinctive biology of each individual patient. In contrast, mRNA expression profiles cluster together according to the method by which the tissue was processed (fresh frozen versus FFPE) rather than according to the patient’s identity. These data argue that the processing steps in FFPE potentially dampen biologically informative differences between individual patient samples. Instead, processing would appear to impart a more generalized, less unique “fixation mRNA signature”.
Many explanations have been proposed to explain these observations. Systematic analyses describing the chemical modifications RNA undergoes as a result of formalin fixation show that the principle change includes the addition of a hydroxymethyl group (termed “methylol”) to the nucleic acid backbones. This methylol group in turn facilitates the formation of a methylene bridge between two amino groups within the nucleic acid chain. Of note, adenosine is the preferred site for these additions. In addition, formaldehyde facilitates depurination of nucleic acids as well as hydrolysis of phosphodiester bonds which leads to shorter nucleic acid chains [23, 24]. Additional factors that could further exacerbate the impact of these modifications include the variability of FFPE specimens derived from routine clinical practice: a variable time before the tissue is subjected to fixation, a variable amount of time in fixation and a variable time embedded in paraffin wax. Indeed, delays of up to 2-3 hours prior to processing compromise mRNA abundance by ~50-60%, and mRNA abundance is significantly reduced by ~85-99% depending upon amplicon size after formalin fixation of 1 day and longer [25]. Furthermore, capillary electrophoresis of RNA from FFPE breast tissue demonstrated that the RNA survives processing and extraction as ~300 bp fragments [26]. Together these factors impede
the ability to extract intact, biologically informative RNA from FFPE tissues. The chemical modifications would further interfere with necessary processing steps (reverse transcription into cDNA, for example). These studies explain in part why smaller nucleic acid targets, like miRNAs, are emerging as ideal substrates for the molecular characterization of FFPE tissue: their small size and close association with large protein aggregates more likely shields them to some degree from these chemical modification and degradation pathways. Furthermore, whereas conventional miRNA microarray labeling procedures employ a direct end-labeling procedure of the miRNAs [11], mRNA labeling protocols rely on reverse transcription. The latter would introduce further bias to the extent that these latter protocols depend upon oligo-dT labeling on a highly modified poly-A mRNA tail, since adenosine is the preferred site for metholyl addition.
There are already many well documented examples of altered miRNA expression patterns in malignant melanoma. miRNA-221 and miRNA-222 are up-regulated in melanoma cell lines and exhibit increasing expression levels along the continuum of dysplastic nevi and melanoma samples in situ. Furthermore, overexpression of miRNA-221 and miRNA-222 in melanoma cells correlates with a more rapid cell cycle progression (G1-S transition), increased invasion and migration in cell culture and enhanced tumorigenicity when these cells are injected into nude mice. At least in part, these miRNAs contribute to these phenotypes via the down-regulation of p27Kip1
and c-KIT mRNAs in the melanoma cells [27]. Similarly, the miRNA let-7a is highly expressed in melanocytes, but exhibits reduced expression in malignant melanoma. One critical target of let-7a in melanoma appears to be β3-integrin, whose expression increases
systematic characterization of altered miRNA expression levels in the biology of pigmented lesions.
This and other studies have demonstrated that miRNAs are more vigorous analytes than mRNAs in the interrogation of FFPE tissues. Taken together with studies revealing the increased utility of miRNA expression profiles in the molecular characterization of tumors and ascribing the nature of tumors of unknown origin [2, 5-7], it is clear that miRNAs encode exceedingly important information in the archived tissues in which they are stored. Given the difficulty of procuring fresh primary melanoma specimens, FFPE is often the only resource for the study of primary melanomas. Therefore, miRNAs will likely emerge as critical resources in the further characterization of these lesions. As shown here, the ability to use FFPE primary melanoma specimens for this purpose will prove of significant value.
Acknowledgements
Support for this study was provided by a grant from the Specialized Program of Research Excellence on Skin Cancer (CA-093372).
Please address all correspondences to Xiaowei Xu, MD, PhD, Department of Pathology and Laboratory Medicine, University of Pennsylvania School of Medicine, 3400 Spruce Street. Philadelphia, PA 19104. Tel: 215-662-6503, Fax: 215-649-5910; Email:
References
[1] Bartel DP. MicroRNAs: genomics, biogenesis, mechanism, and function. Cell 2004;116:281-297.
[2] Calin GA and Croce CM. MicroRNA signatures in human cancers. Nat Rev Cancer 2006;6: 857-866.
[3] Liu X, Fortin K and Mourelatos Z. MicroRNAs: biogenesis and molecular functions. Brain Pathol 2008;18:113-121.
[4] Lee EJ, Gusev Y, Jiang J, Nuovo GJ, Lerner MR, Frankel WL, Morgan DL, Postier RG, Brackett DJ and Schmittgen TD. Expression profiling identifies microRNA signature in pancreatic cancer. Int J Cancer 2007;120:1046-1054. [5] Lu J, Getz G, Miska EA, Alvarez-Saavedra E,
Lamb J, Peck D, Sweet-Cordero A, Ebert BL, Mak RH, Ferrando AA, Downing JR, Jacks T, Horvitz HR and Golub TR. MicroRNA expression profiles classify human cancers. Nature 2005; 435: 834-838.
[6] Rosenfeld N, Aharonov R, Meiri E, Rosenwald S, Spector Y, Zepeniuk M, Benjamin H, Shabes N, Tabak S, Levy A, Lebanony D, Goren Y, Silberschein E, Targan N, Ben-Ari A, Gilad S, Sion-Vardy N, Tobar A, Feinmesser M, Kharenko O, Nativ O, Nass D, Perelman M, Yosepovich A, Shalmon B, Polak-Charcon S, Fridman E, Avniel A, Bentwich I, Bentwich Z, Cohen D, Chajut A and Barshack I. MicroRNAs accurately identify cancer tissue origin. Nat Biotechnol 2008;26:462-469.
[7] Volinia S, Calin GA, Liu CG, Ambs S, Cimmino A, Petrocca F, Visone R, Iorio M, Roldo C, Ferracin M, Prueitt RL, Yanaihara N, Lanza G, Scarpa A, Vecchione A, Negrini M, Harris CC and Croce CM. A microRNA expression signature of human solid tumors defines cancer gene targets. Proc Natl Acad Sci USA 2006;103: 2257-2261.
[8] Lagos-Quintana M, Rauhut R, Lendeckel W and Tuschl T. Identification of novel genes coding for small expressed RNAs. Science 2001;294: 853-858.
[9] Chen C, Ridzon DA, Broomer AJ, Zhou Z, Lee DH, Nguyen JT, Barbisin M, Xu NL, Mahuvakar VR, Andersen MR, Lao KQ, Livak KJ and Guegler KJ. Real-time quantification of microRNAs by stem-loop RT-PCR. Nucleic Acids Res 2005;33:e179.
[10] Calin GA, Liu CG, Sevignani C, Ferracin M, Felli N, Dumitru CD, Shimizu M, Cimmino A, Zupo S, Dono M, Dell'Aquila ML, Alder H, Rassenti L, Kipps TJ, Bullrich F, Negrini M and Croce CM. MicroRNA profiling reveals distinct signatures in B cell chronic lymphocytic leukemias. Proc Natl Acad Sci USA 2004;101:11755-11760. [11] Castoldi M, Schmidt S, Benes V, Noerholm M,
Kulozik AE, Hentze MW and Muckenthaler MU. A sensitive array for microRNA expression profiling (miChip) based on locked nucleic acids (LNA). RNA 2006;12:913-920.
[12] Nelson PT, Baldwin DA, Scearce LM, Oberholtzer JC, Tobias JW and Mourelatos Z. Microarray-based, high-throughput gene expression profiling of microRNAs. Nat Methods 2004;1:155-161.
[13] Doleshal M, Magotra AA, Choudhury B, Cannon BD, Labourier E and Szafranska AE. Evaluation and validation of total RNA extraction methods for microRNA expression analyses in formalin-fixed, paraffin-embedded tissues. J Mol Diagn
2008;10:203-211.
[14] Li J, Smyth P, Flavin R, Cahill S, Denning K, Aherne S, Guenther SM, O'Leary JJ and Sheils O. Comparison of miRNA expression patterns using total RNA extracted from matched samples of formalin-fixed paraffin-embedded (FFPE) cells and snap frozen cells. BMC Biotechnol 2007;7:36.
Pathol 2009;62:84-88.
[16] Xi Y, Nakajima G, Gavin E, Morris CG, Kudo K, Hayashi K and Ju J. Systematic analysis of microRNA expression of RNA extracted from fresh frozen and formalin-fixed paraffin-embedded samples. RNA 2007;13:1668-1674.
[17] Lawrie CH, Soneji S, Marafioti T, Cooper CD, Palazzo S, Paterson JC, Cattan H, Enver T, Mager R, Boultwood J, Wainscoat JS and Hatton CS. Microrna expression distinguishes between germinal center B cell-like and activated B cell-like subtypes of diffuse large B cell lymphoma. Int J Cancer 2007;121:1156-1161.
[18] Szafranska AE, Davison TS, Shingara J, Doleshal M, Riggenbach JA, Morrison CD, Jewell S and Labourier E. Accurate molecular characterization of formalin-fixed, paraffin-embedded tissues by microRNA expression profiling. J Mol Diagn 2008;10:415-423. [19] Tetzlaff MT, Liu A, Xu X, Master SR, Baldwin DA,
Tobias JW, Livolsi VA and Baloch ZW. Differential expression of miRNAs in papillary thyroid carcinoma compared to multinodular goiter using formalin fixed paraffin embedded tissues. Endocr Pathol 2007;18:163-173. [20] Zhang X, Chen J, Radcliffe T, Lebrun DP, Tron
VA and Feilotter H. An array-based analysis of microRNA expression comparing matched frozen and formalin-fixed paraffin-embedded human tissue samples. J Mol Diagn 2008;10: 513-519.
[21] Nelson PT, Baldwin DA, Kloosterman WP, Kauppinen S, Plasterk RH and Mourelatos Z. RAKE and LNA-ISH reveal microRNA expression and localization in archival human brain. RNA
2006;12:187-191.
[22] Glud M, Klausen M, Gniadecki R, Rossing M, Hastrup N, Nielsen FC and Drzewiecki KT. MicroRNA Expression in Melanocytic Nevi: The Usefulness of Formalin-Fixed, Paraffin-Embedded Material for miRNA Microarray Profiling. J Invest Dermatol 2008 [Epub ahead of print]
[23] Masuda N, Ohnishi T, Kawamoto S, Monden M and Okubo K. Analysis of chemical modification of RNA from formalin-fixed samples and optimization of molecular biology applications for such samples. Nucleic Acids Res 1999;27: 4436-4443.
[24] Srinivasan M, Sedmak D and Jewell S. Effect of fixatives and tissue processing on the content and integrity of nucleic acids. Am J Pathol
2002;161:1961-1971.
[25] Abrahamsen HN, Steiniche T, Nexo E, Hamilton-Dutoit SJ and Sorensen BS. Towards quantitative mRNA analysis in paraffin-embedded tissues using real-time reverse transcriptase-polymerase chain reaction: a methodological study on lymph nodes from melanoma patients. J Mol Diagn 2003;5:34-41.
[26] Cronin M, Pho M, Dutta D, Stephans JC, Shak S, Kiefer MC, Esteban JM and Baker JB. Measurement of gene expression in archival paraffin-embedded tissues: development and performance of a 92-gene reverse transcriptase-polymerase chain reaction assay.
Am J Pathol 2004;164:35-42.
[27] Felicetti F, Errico MC, Bottero L, Segnalini P, Stoppacciaro A, Biffoni M, Felli N, Mattia G, Petrini M, Colombo MP, Peschle C and Care A. The promyelocytic leukemia zinc finger-microRNA-221/-222 pathway controls melanoma progression through multiple oncogenic mechanisms. Cancer Res 2008;68: 2745-2754.
[28] Muller DW and Bosserhoff AK. Integrin beta 3 expression is regulated by let-7a miRNA in malignant melanoma. Oncogene 2008;27: 6698-6706.