The Journal of Experimental Biology
ABSTRACT
Antarctic marine species have evolved in one of the coldest and most temperature-stable marine environments on Earth. They have long been classified as being stenothermal, or having a poor capacity to resist warming. Here we show that their ability to acclimate their physiology to elevated temperatures is poor compared with species from temperate latitudes, and similar to those from the tropics. Those species that have been demonstrated to acclimate take a very long time to do so, with Antarctic fish requiring up to 21–36 days to acclimate, which is 2–4 times as long as temperate species, and invertebrates requiring between 2 and 5 months to complete whole-animal acclimation. Investigations of upper thermal tolerance (CTmax) in Antarctic marine species have shown that as the rate of warming is reduced in experiments, CTmaxdeclines markedly, ranging from 8 to 17.5°C across 13 species at a rate of warming of 1°C day−1, and from 1 to 6°C at a rate of 1°C month−1. This effect of the rate of warming on CTmax also appears to be present at all latitudes. A macrophysiological analysis of long-term CTmaxacross latitudes for marine benthic groups showed that both Antarctic and tropical species were less resistant to elevated temperatures in experiments and thus had lower warming allowances (measured as the difference between long-term CTmax and experienced environmental temperature), or warming resistance, than temperate species. This makes them more at risk from warming than species from intermediate latitudes. This suggests that the variability of environmental temperature may be a major factor in dictating an organism’s responses to environmental change.
KEY WORDS: Climate change, Warming, CTmax, Invertebrate, Fish,
Polar
Introduction
The Antarctic marine environment is both one of the most stable and one of the most variable on Earth. Temperatures at the highest latitude sites, such as McMurdo Sound in the Ross Sea, range annually by less than 1.5°C above a minimum of −1.9°C, the freezing point of seawater (Hunt et al., 2003). Even the most variable sites, in the maritime Antarctic, have a range across the year of only 3–4°C, and this is between 5 and 10 times lower than the most variable marine sites at lower latitudes (Clarke and Gaston, 2006). In contrast to this, seasonality of light and, as a consequence, sea-ice cover and phytoplankton bloom intensity are amongst the greatest on Earth, with phytoplankton biomass often varying by over 4 orders of magnitude seasonally to summer peaks in excess of 25 mg chlorophyll m−3in near-shore sites (Clarke et al., 2008).
Conditions similar to this have existed in sites around Antarctica for at least 15 and possibly 25 million years (Clarke and Johnston, 1996). Research over the past four decades has shown that these REVIEW
1British Antarctic Survey, High Cross, Madingley Road, Cambridge CB3 0ET, UK.
2European Institute of Marine Studies, Marine Environmental Sciences Laboratory
LEMAR UMR6539, Rue Dumont D’Urville, 29280 Plouzané, France.
*Author for correspondence (l.peck@bas.ac.uk)
conditions have resulted in a fauna that is stenothermal and has a poor capacity to resist elevated temperatures (Somero and DeVries, 1967; Peck, 2002). Such characteristics are of particular concern, given the climate change effects and rates of warming seen in the polar regions (Turner et al., 2009). In Antarctica, the region around the Antarctic Peninsula is one of the fastest warming on Earth, with air temperatures having risen by 3°C and sea surface temperatures to the west of the peninsula having risen by 1°C over the last 50 years (Meredith and King, 2005).
Organisms can respond to environmental insult in a wide range of ways, from biochemical buffering, through physiological mechanisms and genetic adaptation to behavioural and ecological modification. The importance of the entrained mechanism depends on both the extent and time scale of the applied stress (Peck, 2011). The most relevant of these in terms of responses to climate change scale events has been argued to be phenotypic plasticity, primarily from the acclimation of physiological processes to altered conditions, and genetic adaptation that can be achieved by both mutation and/or the transfer of genes within and between populations (Somero, 2010). The balance of the importance of phenotypic plasticity and adaptation is markedly affected by life history characteristics such as generation time that affect the time required for genetic modification to become effective (Peck, 2011). Thus, in groups characterised by very rapid generation times such as viruses, microbes and microinvertebrates, the need for phenotypic plasticity to resist warming is small as genetic modification is rapid. However, in species with long generation times, including many marine ectotherms in polar regions, phenotypic plasticity or efficient homeostatic mechanisms are essential. Thus, groups with generation times measured in decades will require on average hundreds of years for adaptation to be effective and survival will be dictated by the possession of sufficient phenotypic plasticity, predominantly acclimation, to resist for the necessary time (Peck, 2011). This review addresses the current state of knowledge on the acclimation ability and temperature tolerance of the Antarctic marine fauna, concentrating on fish and macroinvertebrates. It begins with a review of acclimation in marine ectotherms, which is followed by sections on acclimation in Antarctic fish and invertebrates. The last half of the review deals with upper lethal temperature limits (CTmax),
how they are assessed and the best methods for identifying long-term CTmax. The final section deals with how long-term CTmax
varies across latitudes and shows that polar and tropical marine species both have lower warming allowances over experienced environmental temperatures than taxa from temperate latitudes where annual temperature variation is higher.
Acclimation in marine ectotherms
Acclimation is the change from one stable physiological state to another stable physiological state in experiments when conditions are altered (Prosser, 1973; Schmidt-Nielsen, 1990). It is sometimes confused with acclimatisation, which is the modulation of physiological processes between long-term stable states in response to changes in environmental variables in the field (Wilson and
Acclimation and thermal tolerance in Antarctic marine ectotherms
The Journal of Experimental Biology
Franklin, 2002). Acclimation has been known and evaluated intemperate species for over half a century (e.g. Brett, 1956). Over this time it has been investigated in the marine environment using a very wide range of approaches including long-term survival (e.g. Peck et al., 2009a), behavioural or muscle performance metrics (e.g. Morley et al., 2011), the stabilisation of metabolic rate (Bullock, 1955; Peck et al., 2002; Robinson and Davison, 2008), the ability to perform normal functions such as the complete processing of a meal (Peck et al., 2008), by the use of a wide range of biochemical markers including heat-shock proteins (e.g. Dahlhoff, 2004; Morley et al., 2009; Dimitriadis et al., 2012), by the use of cellular or metabolomic indicators (Chrousos, 1998; Lowe and Davison, 2005; Hudson et al., 2008) and increasingly by the modulation of gene expression (Nymark et al., 2009; Ravaux et al., 2012; Heinrich et al., 2012).
Whereas cellular and tissue components can acclimate at different rates, complete acclimation at the whole-animal level to altered temperature usually involves a change in acute thermal tolerance (upper and lower critical and lethal temperatures, CTmin, CTmax,
UTL and LTL). This has been recognised for over 70 years (Fry et al., 1942; Pörtner et al., 2007; Peck et al., 2010) and is a commonly used metric to evaluate whole-animal acclimation. Acclimation studies focusing on cellular or physiological functions provide valuable information on thermal compensation of these functions and form a very good basis for much comparative physiology aimed at understanding thermal biology. They also allow acute responses to be separated from the acclimated state and the time scale of changes in rate functions to be evaluated (e.g. Schulte et al., 2011). In this area the use of thermal performance curves has become widespread and has provided insight into rates of compensation of functions to altered temperature (e.g. Dell et al., 2011; Huey and Kingsolver, 2011).
Acclimation in Antarctic fish
Acclimation has been demonstrated in a number of studies on Antarctic fish, and several have examined acclimation using a variety of different performance indicators. One of the first studies of the effects of altered temperature on a physiological function showed that burst swimming performance was not altered by 4 weeks exposure to either −1 or 4°C in Pagothenia borchgrevinki (Wilson et al., 2001). Seebacher and colleagues (Seebacher et al., 2005) then showed there was significant plasticity in cardiovascular
response and metabolic control that allowed P. borchgrevinkito maintain locomotory performance after 4–5 weeks of acclimation at 4°C. Further work on this species showed that acclimation to 4°C produced a cardiac output at rest that was stable when tested at temperatures between −1 and 8°C (Franklin et al., 2007). The maximum factorial of cardiac output stayed at −1°C, but was lower after acclimation.
Robinson and Davison (Robinson and Davison, 2008) showed that oxygen consumption (ṀO2) acclimated to 4°C in P.
borchgrevinkiafter 1 month such that resting ṀO2was the same as
that at −1°C and recovery from exhaustive exercise was the same in warm- or cold-acclimated fish. More recently, metabolic rate stabilisation, mitochondrial function and acid–base regulation have all been used to measure acclimation state in the fish Notothenia rosii, where partial acclimation of metabolic rate was observed after 29–36 days at 7°C (Strobel et al., 2012).
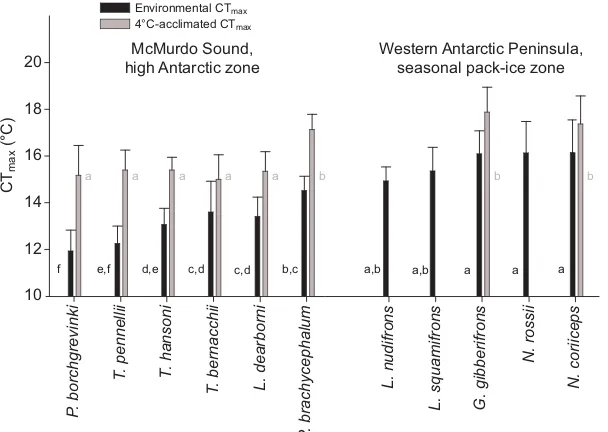
At the whole-animal level, Bilyk and DeVries (Bilyk and DeVries, 2011) used the change in CTmaxto demonstrate that a range
of fish from both the high Antarctic at McMurdo Sound and the maritime Antarctic on the Antarctic Peninsula were capable of acclimating to 4°C (Fig. 1). CTmaxwas higher in the species from
the Antarctic Peninsula than in those from McMurdo Sound before and after acclimation, but acclimation to 4°C had a larger effect on CTmaxin fish from the high Antarctic site than in species from the
Antarctic Peninsula (Bilyk and DeVries, 2011) (Fig. 1). These results may initially seem surprising as the temperature regime differences are small. At McMurdo Sound the range is −1.9 to −0.5°C whereas the specimens in the study on the Antarctic Peninsula were from near Anvers Island where the temperature range is −1.9 to around +1°C (Clarke et al., 2008). However, environmental temperatures at the time when measurements were made were similar at the two sites (roughly −1.0 to −1.9°C) as the investigation on the Peninsula was carried out in winter (July/August). Thus, a difference of around 1.5°C in summer temperature accounted for the differences seen in CTmaxand acclimation effect.
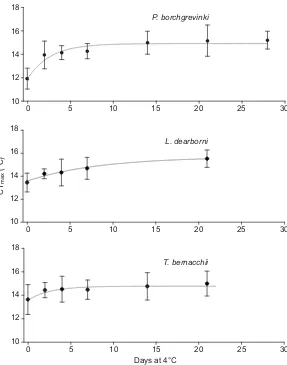
Further to this, Bilyk and DeVries (Bilyk and DeVries, 2011) showed that the time needed for complete acclimation of CTmaxwas
between 5 and 20 days (Fig. 2). This is much longer than that required for temperate species. Several early studies in the 1940s to 1980s showed that acclimation of CTmaxin temperate and tropical
fish usually takes 2–5 days (reviewed in Schmidt-Nielsen, 1990).
Environmental CTmax 4°C-acclimated CTmax
c,d c,d
McMurdo Sound, high Antarctic zone
Western Antarctic Peninsula, seasonal pack-ice zone
P
. borchgrevinki
T
. pennellii T. hansoni
T
. bernacchii L. dearborni
P
. brachycephalum
L. nudifrons
L. squamifrons G. gibberifrons
N. rossii
N. coriiceps
CT
max
(°C)
10 12 14 16 18 20
f e,f d,e b,c a,b a,b a a a
[image:2.612.46.350.521.737.2]a a a a a b b b
Fig. 1. CTmaxof fish from McMurdo Sound in the high
Antarctic and the Antarctic Peninsula.Species were:
Pagothenia borchgrevinki, Trematomus pennellii, Trematomus hansoni, Trematomus bernacchii, Lycodichthys dearborni,
Pachycara brachycephalum, Lepidonotothen nudifrons,
Lepidonotothen squamifrons, Gobionotothen gibberifrons,
Notothenia rossiiand Notothenia coriiceps. Black bars indicate
environmental CTmax(from recently collected specimens) and
grey bars are for animals acclimated to 4°C. Data are shown
as means ± s.d. (s.d. is not shown for N. rossiias only two
specimens were available). Student–Newman–Keuls tests were used to identify significant differences, which are indicated by different lowercase letters. McMurdo Sound and
Antarctic Peninsula CTmaxvalues were tested independently
The Journal of Experimental Biology
More recently Healy and Schulte (Healy and Schulte, 2012) showedthe killifish Fundulus heteroclitusrequires 3–6 days for acclimation of CTmaxto a temperature change of 10°C, and this was the same for
populations from both northern and southern ends of the distribution range. Acclimation to altered temperature thus appears to take 2–4 times longer in Antarctic fish compared with acclimation in species from temperate latitudes.
Acclimation in Antarctic invertebrates
Studies of acclimation in Antarctic marine invertebrates have shown possibly even more surprising results. Peck and colleagues (Peck et al., 2010) held six species for 2 months at 3.1°C, which is 2.0°C above average summer maximum temperatures, and only one species, the gastropod Marseniopsis mollis, showed any change in CTmax
compared with controls at 0°C (Fig. 3). Furthermore, the brittle star Ophionotus victoriaehas been shown to be incapable of acclimating to 2°C, as it could not survive more than a few weeks at this temperature (Peck et al., 2009b). Morley and colleagues (Morley et al., 2011) showed the limpet Nacella concinnafrom the Antarctic Peninsula acclimated its CTmaxto higher values after being held at
2.9°C for 9 months, when there was no evidence of whole-animal acclimation after 2 months. To test this further, we held N. concinna for 5 months at 0 and 3°C (Fig. 4). These trials were conducted in the Antarctic winter and CTmax was evaluated at the start of the
experiment when the field temperature the animals had experienced was −1.0°C. After 5 months both the 0°C controls and 3°C maintained animals had a higher CTmaxthan animals evaluated at the start of the
experiment, and the 3°C group had a higher CTmax than the 0°C
controls (Fig. 4). Thus, whole-animal acclimation in N. concinna appears to require more than 2 and less than 5 months to complete.
Experiments have also been conducted on acclimation in the Antarctic urchin Sterechinus neumayeri, at Rothera Station, Adelaide Island, Antarctic Peninsula, where CTmaxdeclined slightly
compared with controls after specimens were held for 3 months at 2°C, indicating no whole-animal acclimation (Fig. 5A); however, in a second experiment, CTmax was higher in specimens held for
6 months at 3°C than in controls at 0°C (Fig. 5B). The first of these trials on urchins was conducted in summer, whereas the second was in winter. Interestingly, the acclimated CTmaxat 3°C in the winter
experiment (Fig. 5B) was very similar to all three CTmaxvalues
(start, 3 months 0°C control and 2°C experimental) from the summer trial (Fig. 5A). This possibly suggests that the value found in summer and the 3°C-acclimated group in winter is the limit for acclimating CTmaxin this species at this site. The site where this
study was made is in a region where sea temperatures have increased by 1°C over the last 50 years (Meredith and King, 2005). Consequently, these acclimation data may be significant in terms of the capacity to respond to further environmental warming. However, the overall picture for Antarctic marine invertebrates is one where it appears that they have a very poor capacity to acclimate CTmax,
and in the species where acclimation has been demonstrated they require inordinately long times, from 2 to 5 months to do so, much longer than is required in Antarctic fish. However, it should be noted that successful acclimation has only been observed in a very limited number of Antarctic marine invertebrates. This, together with the data for the brittle star Ophionotus victoriaeshowing it does not P. borchgrevinki
L. dearborni
T. bernacchii
CT
max
(°C)
10 12 14 16 18
10 12 14 16 18
10 12 14 16 18
0 5 10 15 20 25 30
0 5 10 15 20 25 30
0 5 10 15 20 25 30
[image:3.612.49.336.57.422.2]Days at 4°C
Fig. 2. Change in CTmaxduring acclimation of three species
of fish from McMurdo Sound while held at 4°C.Points indicate
mean ± s.d. CTmax. The light grey line on each plot shows the
expected CTmaxfrom the non-linear regression analysis.
The Journal of Experimental Biology
survive long term at 2°C (Peck et al., 2009b), which is less than 2°Cabove the average annual temperature at that site, suggests that some species will not be able to acclimate to even small rises in sea water temperature.
CTmaxand estimations of long-term thermal tolerance
Acclimation experiments generally require animals to be held long term in experimental facilities. This can be problematical for non-model species, where often little, if anything, is known about their husbandry, and living in confined environments may produce tank effects. Hence, alternative methods need to be explored to evaluate the resilience of these species to long-term temperature increases. Several studies have investigated the relationship between species or population thermal tolerance (CTmax) and geographic range, and
most have found the two to be correlated (e.g. Kimura, 2004; Angilletta, 2009; Jones et al., 2009). This is probably because physiological tolerance, when assessed using metrics such as activity, decline with temperature above and below an optimum in a similar fashion to CTmax(e.g. Ansell et al., 1981; Peck et al.,
2004), and there is a hierarchy of temperature tolerance with physiological scale where whole-animal CTmaxis lower than limits
for tissues and then cellular level processes, and the different levels appear to be linked in a cascade (Pörtner et al., 2007). Thus, for populations living at sites where temperatures are either above or below optimum, the capacity to perform the required normal functions and activities declines.
The first investigation of CTmaxin Antarctic marine ectotherms
showed that fish had a poor capacity to resist warming and could not survive long term at temperatures higher than around 5–6°C (Somero and DeVries, 1967). Since this pioneering work, Antarctic
fish and marine ectotherms have been recognised as being stenothermal, and significantly less tolerant of warming than lower latitude species (Clarke, 1991; Peck, 2002; Pörtner et al., 2007; Somero, 2010). More recent studies, however, seemed to show more equivocal results. Urban and Silva (Urban and Silva, 1998) found temperature tolerance limits (CTmax) for N. concinnaand the clam
Laternula ellipticaabove 15°C, and Abele and colleagues (Abele et al., 2001) measured the effects of oxidative stress in the bivalve
Yoldia eightsi at temperatures up to 11°C, whereas Peck and
colleagues (Peck et al., 2004) showed that both N. concinnaand L. ellipticawere incapable of completing essential activities (righting in limpets and burying in clams) at temperatures above 5°C. Furthermore Peck (Peck, 1989) showed that the brachiopod
Liothyrella uvaseemed capable of surviving extended periods at
3.0°C, but not 4.5°C, whereas the limpet N. concinnasurvived slow warming over 150 days to 7.5°C but not a subsequent rise to 9.0°C. Much of the confusion in this field was resolved when Peck and colleagues (Peck et al., 2009a) showed that CTmaxvaried with the
rate of experimental warming in 14 species of Antarctic marine invertebrates from six phyla, and this appears to be a general phenomenon. CTmaxdeclined at slower rates of warming (Fig. 6).
Across all species studied, CTmaxranged from 8 to 17.5°C at a
warming rate of 1°C day−1. However, this declined to 3.5–12°C at a
rate of 1°C week−1and to 1.0–6.0°C at 1°C month−1. Earlier studies
that had found unexpectedly high CTmaxvalues for stenothermal
Antarctic ectotherms had employed the faster rates of warming. Performing non-linear exponential regression analyses [CTmax=a–bexp(–cR), where Ris the rate of change and a, band c
are constants (Richard et al., 2012)] on these data allowed extrapolation of long-term thermal limits in excess of a year to be predicted at 3.3°C, which is around 3°C above average summer maxima at this site. Hence, these analyses enabled predictions to be made of the plasticity required in species’ ability to acclimate to higher temperatures and in a much wider range of species than was possible with long-term experimental acclimation experiments. Acclimated
Control
T
emperature limit (°C)
5 10 15 20 25
Y. eightsiH. steineni L. uva
S. neumayeri
[image:4.612.51.291.57.253.2]P. gibber M. mollis
Fig. 3. CTmaxfor six species of Antarctic marine invertebrates. Species
were: Yoldia eightsi, Heterocucumis steineni, Liothyrella uva, Sterechinus
neumayeri, Paraceradocus gibberand Marseniopsis mollis. Each point represents the temperature at which an individual became unresponsive to
external stimuli. For each species, data are shown for two groups where N
was between 13 and 27. The control group had been held in ambient temperatures (–1.2 to +1.3°C) for 60 days, whereas the experimental (acclimated) group had been held at 3°C for 60 days. Differences between the 3°C-acclimated group and the control group were not significant for
Y. eightsi(t=1.44, 39 d.f., P=0.16), H. steineni(t=0.48, 38 d.f., P=0.64), L. uva
(t=–0.11, 29 d.f., P=0.92), S. neumayeri(t=–0.01, 46 d.f., P=0.99) and
P. gibber(t=–0.24, 21 d.f., P=0.81). They were, however, significant for
M. mollis(t=10.9, 40 d.f., P<0.001). Figure from Peck et al. (Peck et al., 2010).
Experimental treatment
1 2 3
8 10 12 14 16 18 20 22
T
emperature (°C)
[image:4.612.323.556.59.233.2]Start (–1°C) 5 months (0°C) 5 months (3°C)
Fig. 4. CTmaxvalues for the limpet Nacella concinna. Each point represents the temperature at which an individual became unresponsive to
external stimuli following warming at 1°C day−1. Data are for animals recently
collected from an ambient temperature of −1.0°C (filled circles), and for
specimens held for 5 months at 0°C (open circles) or at 3°C (filled triangles). All three groups passed homogeneity of variance (Levene’s test=0.65,
P=0.53) and normality (Bartlett’s test=0.93, P=0.63) tests but were
significantly different (ANOVA, F21,2=61.9, P<0.001); the 0°C control values
were higher than the start values, as were the 3°C group values, and the 3°C group values were higher than the 0°C control values (in all cases Tukey,
The Journal of Experimental Biology
Warming allowances and estimations of thermal resilience The capacity to acclimate to altered conditions (physiological plasticity) is currently of great interest (e.g. Angilletta, 2009; Somero, 2010). However, acclimation capacity varies with several factors such as physiological condition and season (e.g. Wilson and Elkain, 1991; Cuculescu et al., 1998; Rajagopal et al., 2005; Healy and Schulte, 2012). Furthermore, experiments evaluating the capacity to acclimate rarely measure the highest temperature that organisms are capable of achieving through acclimation. Because of these factors, experiments demonstrating acclimation to a given temperature may be poor estimates of the highest temperatures for long-term survival in a population or species, and the method of identifying long-term CTmaxfrom experiments at different rates of
warming is likely to be better in this respect.
Richard and colleagues (Richard et al., 2012) used the same approach as Peck and colleagues (Peck et al., 2009a) to evaluate CTmaxat different rates of warming in marine invertebrates across
four temperate and one Antarctic locality. They used a non-linear model: CTmax=a–b× exp(–cR) (where CTmaxis the temperature at
which 50% mortality occurred, Ris the rate of temperature change expressed in day per °C and a, band care constants). This allowed the estimation of a long-term CTmaxthat incorporated the data from
faster rates of warming in the calculation. This is a better estimate of long-term survival than point estimates of acclimation capacity as it allows factors such as physiological condition or seasonal influences to be averaged out and reduces their bias on the estimate. It also provides an estimate of maximum long-term CTmaxthat is
rarely obtained from acclimation studies.
Richard and colleagues compared their estimates of long-term CTmaxwith experienced maximum habitat temperature to calculate
the ‘warming allowance’. This is calculated as the difference between maximum experienced temperature and maximum long-term CTmaxand is the buffer that the species or population has in its
physiological capacity over current environmental temperatures. It is similar to the warming tolerance of Deutsch and colleagues (Deutsch et al., 2008), but uses an estimate of long-term CTmax
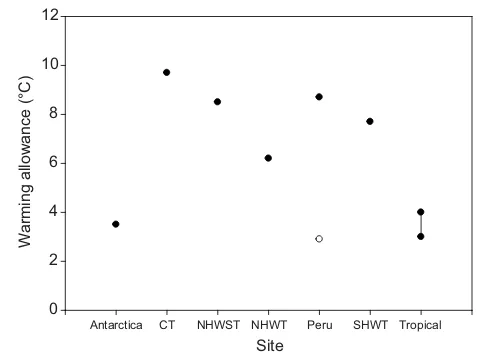
calculated using data collected for many rates of warming. This warming allowance varied from just over 3°C for Antarctic species to over 9°C for a cool temperate environment. Interestingly, it was 8.7°C for a warm temperate site on the coast of Peru, but fell to 2.9°C during an El Nino event where average sea temperatures dramatically increased in an unpredictable fashion and significant mortalities in several species occurred.
Nguyen and colleagues (Nguyen et al., 2011) evaluated CTmax
across a range of different warming rates in tropical marine and intertidal species. For the 13 fully marine species studied, the average long-term CTmax was around 35°C, and for the most
sensitive species, the sea urchin Temnopleurus toreumaticus, this was between 29.4 and 32.4°C. The maximum habitat temperature experienced by these species during the 3 months of their study was 31°C. The maximum weekly sea temperature recorded for Singapore between 1981 and 2010 was slightly above 31°C (Guest et al., 2012), and although temperature variation at this site is small, the absolute maximum experienced over this time was likely to have been between 31 and 32°C. The warming allowance for marine species around Singapore is thus 3–4°C and for the most sensitive species 0–1.4°C. When warming allowance values are compared for marine sites from the tropics to the poles, an interesting pattern is
8 10 12 14 16 18 20 22
Start 3 months (0°C) 3 months (2°C)
A
Experimental group 8
10 12 14 16 18 20 22
T
[image:5.612.50.292.57.390.2]emperature (°C)
B
Start 6 months (0°C) 6 months (3°C)Fig. 5. CTmaxvalues for the urchin S. neumayeri. Each point represents the temperature at which an individual became unresponsive to external
stimuli following warming at 1°C day−1. (A) Data for animals at the start of the
trial and groups held at either 0 or 2°C for 3 months; (B) specimens at the start of the trial or held for 6 months at 0 or 3°C. In A there were no significant differences between the start group and the group held at 0°C for 3 months,
but the group held at 2°C for 3 months had a lower CTmaxthan either of the
other two groups (ANOVA F67,2=7.11, P=0.002; Tukey: start vs 0°C control,
P>0.05; start vs 2°C group P<0.05; 0°C control vs 2°C group P<0.05). In B,
data failed normal distribution and homogeneity tests (Levene’s test=25.0,
P<0.001; Bartlett’s test=9.61, P=0.008). However, a non-parametric
Kruskal–Wallis test shows 0°C controls were not significantly different from
the start group (H=20.27, 2 d.f., P<0.001), but the 3°C group values were
significantly higher than those of the 0°C controls (Mann–Whitney, W=56.0,
P=0.0002).
Rate of change
Upper temperature limit (°C)
0 2 4 6 8 10 12 14 16 18 20
1°C day–1 1°C week–1 1°C month–1
Fig. 6. CTmaxvalues (upper temperature limit) for 14 species of Antarctic
[image:5.612.320.558.59.235.2]The Journal of Experimental Biology
obtained where both the tropics and polar sites have low values ofaround 3–4°C and the temperate sites between have higher values between 6.2 and 9.7°C (Fig. 7). Interestingly the site in Peru is strongly affected by the El Nino oscillation, and the warming allowance here is usually 8.7°C, but during the El Nino this falls to 2.9°C, a value similar to those reported for Antarctica and Singapore (Fig. 7). This low value for Peru during the El Nino coincides with a period when there are significant mortalities in marine species in this region. It is similar to the values for Antarctic and tropical species (Fig. 7) and although it occurs for different reasons it reinforces the concept that a warming allowance of around 3°C indicates species are living close to their physiological limits.
The approach taken in the studies of Peck et al. (Peck et al., 2009a), Richard et al. (Richard et al., 2012) and Nguyen et al. (Nguyen et al., 2011) is to assess multiple species at a given site and to produce measures of CTmaxat an assemblage or community level.
Previously, it has been argued that to assess resistance to environmental warming requires tightly phylogenetically controlled studies using within-genus comparisons (e.g. Somero, 2010; Somero, 2012). However, comparisons across latitudes from the tropics to high polar sites are difficult in this respect because of the lack of genera that span this range, and the macrophysiology assemblage level approach has significant merit in this respect.
The current paradigm is that tropical species are more at risk from warming than those from higher latitudes. This was demonstrated for congeneric porcelain crabs (genus Petrolisthes) along the Pacific coast of the USA (Stillman and Somero, 2000; Stillman, 2003). Furthermore, in intertidal habitats, species inhabiting warmer, generally higher intertidal sites appear to have less resistance to warming (see Helmuth, 2009), and comparisons of subtidal and intertidal congenerics have shown that the intertidal species are less resistant than subtidal ones (e.g. Dong and Somero, 2009). In terrestrial studies, species from lower, warmer latitudes also appear less resistant to warming than those from higher, cooler latitudes
(Deutsch et al., 2008; Tewksbury et al., 2008). In contrast, the data from Fig. 7 presented here indicate that both tropical and Antarctic marine species are less resistant than those from intermediate latitudes. This would support the thesis that species from less variable temperature environments have less phenotypic plasticity to respond to warming, the environmental variability hypothesis where high environmental variation selects for flexibility in life history characteristics (e.g. Stearns, 1992). An environmental variability analysis would also fit the responses seen in terrestrial species, as higher latitude terrestrial environments tend to be more temperature variable than those from lower latitudes, a point also noted by Tewksbury and colleagues (Tewksbury et al., 2008), and also raised in the context of marine species by Somero (Somero, 2010). It does seem contrary to results for subtidal versus intertidal and some purely intertidal studies and this may be because the species studied there have a marine evolutionary history. In this respect it would be important to investigate terrestrial species that have invaded the intertidal zone, such as the intertidal spiders of the family Desidae.
In the studies reviewed here, individuals had little opportunity to employ behavioural regulation during trials. Thus, what is measured is the accumulation of thermal stress as a function of time by temperature. Individuals in wild conditions may have the opportunity to move away from thermally stressful situations, although this is a less likely option in areas like the Southern Ocean where temperatures vary little over large distances. Furthermore, migration is likely to move them to sub-optimal conditions in terms of other factors such as predation or competition (Angilletta, 2009), which would reduce survival in the long term. The capacity for adaptation by modification of the genome at the population level has also not been addressed, and this is likely to be more important for species with short generation times, especially those with multiple generations per year (Peck, 2011). Antarctic species with long generation times and slow growth and development times (see Peck, 2002; Peck et al., 2006) are likely to be restricted in this respect. However, the analyses of phenotypic plasticity to resist warming reviewed here would suggest that Antarctic marine species are impaired compared with lower latitude assemblages, and that the areas most vulnerable to warming in marine benthic groups are tropical and Antarctic.
Acknowledgements
We thank Craig Franklin and an anonymous referee who made comments that significantly improved the manuscript. We also thank the support team at Rothera Research Station, especially those involved in diving, for assistance with collection and maintenance of specimens used in experiments reported here.
Competing interests
The authors declare no competing financial interests.
Author contributions
All authors contributed to the conception, design, execution and interpretation of the findings. L.S.P., S.A.M. and M.S.C. contributed to data in Figs 4 and 6; S.A.M. contributed to data in Fig. 5; L.S.P. and J.R. contributed to data in Fig. 7.
Funding
L.S.P., S.A.M. and M.S.C. were funded by core support from the Natural Environment Research Council (NERC) to the British Antarctic Survey. J.R. and L.S.P. were funded by NERC grant NE/G018.
References
Abele, D., Tesch, C., Wencke, P. and Portner, H. O.(2001). How does oxidative stress relate to thermal tolerance in the Antarctic bivalve Yoldia eightsi? Antarct. Sci.
13, 111-118.
Angilletta, M. J.(2009). Thermal Adaptation. New York, NY: Oxford University Press.
Ansell, A. D., Barnett, P. R. O., Bodoy, A. and Massé, H.(1981). Upper temperature tolerances of some European molluscs. Mar. Biol.65, 177-183.
Bilyk, K. T. and DeVries, A. L.(2011). Heat tolerance and its plasticity in Antarctic fishes. Comp. Biochem. Physiol.158A, 382-390.
Site
Antarctica CT NHWST NHWT Peru SHWT Tropical
W
arming allowance (°C)
[image:6.612.50.292.58.236.2]0 2 4 6 8 10 12
Fig. 7. Warming allowance for aggregates of species at seven sites.
Warming allowance is the difference between long-term CTmaxand currently
experienced maximum environmental temperature (°C). The sites range from Antarctica to Singapore (Tropical) with those in between following previous use (Richard et al., 2012): CT, cold temperate environment (West coast of Scotland); NHWST, northern hemisphere warm shallow temperate (depths
less than 5 m); NHWT, northern hemisphere warm temperate (depths deeper
than 5 m; South of France and west coast of the USA); Peru; and SHWT,
southern hemisphere warm temperate (all depths deeper than 5 m). The line
The Journal of Experimental Biology
Brett, J. R.(1956). Some principles in the thermal requirements of fishes. Q. Rev. Biol.
31, 75-87.
Bullock, T. H.(1955). Compensation for temperature in the metabolism and activity of poikilotherms. Biol. Rev. Camb. Philos. Soc.30, 311-342.
Chrousos, G. P. (1998). Stressors, stress, and neuroendocrine integration of the adaptive response. The 1997 Hans Selye Memorial Lecture. Ann. New York Acad. Sci.851, 311-335.
Clarke, A.(1991). What is cold adaptation and how should we measure it? Am. Zool.
31, 81-92.
Clarke, A. and Gaston, K. J.(2006). Climate, energy and diversity. Proc. R. Soc. B
273, 2257-2266.
Clarke, A. and Johnston, I. A.(1996). Evolution and adaptive radiation of antarctic fishes. Trends Ecol. Evol.11, 212-218.
Clarke, A., Meredith, M. P., Wallace, M. I., Brandon, M. A. and Thomas, D. N.
(2008). Seasonal and interannual variability in temperature, chlorophyll and macronutrients in northern marguerite bay, Antarctica. Deep Sea Res. Part II Top. Stud. Oceanogr.55, 1988-2006.
Cuculescu, M., Hyde, D. and Bowler, K.(1998). Thermal tolerance of two species of marine crab, Cancer pagurusand Carcinus maenas. J. Therm. Biol.23, 107-110.
Dahlhoff, E. P.(2004). Biochemical indicators of stress and metabolism: applications for marine ecological studies. Annu. Rev. Physiol.66, 183-207.
Dell, A. I., Pawar, S. and Savage, V. M. (2011). Systematic variation in the temperature dependence of physiological and ecological traits. Proc. Natl. Acad. Sci. USA108, 10591-10596.
Deutsch, C. A., Tewksbury, J. J., Huey, R. B., Sheldon, K. S., Ghalambor, C. K., Haak, D. C. and Martin, P. R.(2008). Impacts of climate warming on terrestrial ectotherms across latitude. Proc. Natl. Acad. Sci. USA105, 6668-6672.
Dimitriadis, V. K., Gougoula, C., Anestis, A., Pörtner, H. O. and Michaelidis, B.
(2012). Monitoring the biochemical and cellular responses of marine bivalves during thermal stress by using biomarkers. Mar. Environ. Res.73, 70-77.
Dong, Y. and Somero, G. N. (2009). Temperature adaptation of cytosolic malate dehydrogenases of limpets (genus Lottia): differences in stability and function due to minor changes in sequence correlate with biogeographic and vertical distributions. J. Exp. Biol.212, 169-177.
Franklin, C. E., Davison, W. and Seebacher, F.(2007). Antarctic fish can compensate for rising temperatures: thermal acclimation of cardiac performance in Pagothenia borchgrevinki. J. Exp. Biol.210, 3068-3074.
Fry, F. E. J., Brett, J. R. and Clawson, G. H.(1942). Lethal limits of temperature for young speckled trout (Salvelinus fontinalis). University of Toronto Studies, Biological Series, number 54. Publ. Ontario Fish. Res. Lab.72, 1-79.
Guest, J. R., Baird, A. H., Maynard, J. A., Muttaqin, E., Edwards, A. J., Campbell, S. J., Yewdall, K., Affendi, Y. A. and Chou, L. M.(2012). Contrasting patterns of coral bleaching susceptibility in 2010 suggest an adaptive response to thermal stress. PLoS ONE7, e33353.
Healy, T. M. and Schulte, P. M.(2012). Factors affecting plasticity in whole-organism thermal tolerance in common killifish (Fundulus heteroclitus). J. Comp. Physiol. B
182, 49-62.
Heinrich, S., Valentin, K., Frickenhaus, S., John, U. and Wiencke, C. (2012). Transcriptomic analysis of acclimation to temperature and light stress in Saccharina latissima(Phaeophyceae). PLoS ONE7, e44342.
Helmuth, B. S.(2009). From cells to coastlines: how can we use physiology to forecast the impacts of climate change? J. Exp. Biol.212, 753-760.
Hudson, H. A., Brauer, P. R., Scofield, M. A. and Petzel, D. H.(2008). Effects of warm acclimation on serum osmolality, cortisol and hematocrit levels in the Antarctic fish, Trematomus bernacchii. Polar Biol.31, 991-997.
Huey, R. B. and Kingsolver, J. G. (2011). Variation in universal temperature dependence of biological rates. Proc. Natl. Acad. Sci. USA108, 10377-10378.
Hunt, B. M., Hoefling, K. and Cheng, C.-H. C.(2003). Annual warming episodes in seawater temperatures in McMurdo Sound in relationship to endogenous ice in notothenioid fishes. Antarct. Sci.15, 333-338.
Jones, S. J., Mieszkowska, N. and Wethey, D. S.(2009). Linking thermal tolerances and biogeography: Mytilus edulis(L.) at its southern limit on the east coast of the United States. Biol. Bull.217, 73-85.
Kimura, M. T.(2004). Cold and heat tolerance of drosophilid flies with reference to their latitudinal distributions. Oecologia140, 442-449.
Lowe, C. J. and Davison, W.(2005). Plasma osmolarity, glucose concentration and erythrocyte responses of two Antarctic nototheniid fishes to acute and chronic thermal change. J. Fish Biol.67, 752-766.
Meredith, M. P. and King, J. C.(2005). Rapid climate change in the ocean west of the Antarctic Peninsula during the second half of the 20th century. Geophys. Res. Lett.
32, L19604.
Morley, S. A., Hirse, T., Pörtner, H. O. and Peck, L. S.(2009). Geographical variation in thermal tolerance within Southern Ocean marine ectotherms. Comp. Biochem. Physiol.153A, 154-161.
Morley, S. A., Lemmon, V., Obermüller, B. E., Spicer, J. I., Clark, M. S. and Peck, L. S.(2011). Duration tenacity: a method for assessing acclimatory capacity of the Antarctic limpet, Nacella concinna. J. Exp. Mar. Biol. Ecol.399, 39-42.
Nguyen, K. D. T., Morley, S. A., Lai, C.-H., Clark, M. S., Tan, K. S., Bates, A. E. and Peck, L. S.(2011). Upper temperature limits of tropical marine ectotherms: global warming implications. PLoS ONE6, e29340.
Nymark, M., Valle, K. C., Brembu, T., Hancke, K., Winge, P., Andresen, K., Johnsen, G. and Bones, A. M. (2009). An integrated analysis of molecular acclimation to high light in the marine diatom Phaeodactylum tricornutum. PLoS ONE4, e7743.
Peck, L. S. (1989). Temperature and basal metabolism in two Antarctic marine herbivores. J. Exp. Mar. Biol. Ecol.127, 1-12.
Peck, L. S.(2002). Ecophysiology of Antarctic marine ectotherms: limits to life. Polar Biol.25, 31-40.
Peck, L. S. (2011). Organisms and responses to environmental change. Mar. Genomics4, 237-243.
Peck, L. S., Pörtner, H. O. and Hardewig, I.(2002). Metabolic demand, oxygen supply, and critical temperatures in the Antarctic bivalve Laternula elliptica. Physiol. Biochem. Zool.75, 123-133.
Peck, L. S., Webb, K. E. and Bailey, D.(2004). Extreme sensitivity of biological function to temperature in Antarctic marine species. Funct. Ecol.18, 625-630.
Peck, L. S., Convey, P. and Barnes, D. K. A.(2006). Environmental constraints on life histories in Antarctic ecosystems: tempos, timings and predictability. Biol. Rev. Camb. Philos. Soc.81, 75-109.
Peck, L. S., Webb, K. E., Clark, M. S., Miller, A. and Hill, T.(2008). Temperature limits to activity, feeding and metabolism in the Antarctic starfish Odontaster validus.
Mar. Ecol. Prog. Ser.358, 181-189.
Peck, L. S., Clark, M. S., Morley, S. A., Massey, A. and Rossetti, H.(2009a). Animal temperature limits and ecological relevance: effects of size, activity and rates of change. Funct. Ecol.23, 248-256.
Peck, L. S., Massey, A., Thorne, M. and Clark, M. S.(2009b). Lack of acclimation in Ophionotus victoriae: brittle stars are not fish. Polar Biol.32, 399-402.
Peck, L. S., Morley, S. A. and Clark, M. S.(2010). Poor acclimation capacities in Antarctic marine ectotherms. Mar. Biol.157, 2051-2059.
Pörtner, H. O., Peck, L. S. and Somero, G. A.(2007). Thermal limits and adaptation in marine Antarctic ectotherms: an integrative view. Philos. Trans. R. Soc. B362, 2233-2258.
Prosser, C. L.(1973). Comparative Animal Physiology, 3rd edn, pp. 966. Philadelphia, PA: Saunders.
Rajagopal, S., van der Velde, G., van der Gaag, M. and Jenner, H. A.(2005). Factors influencing the upper temperature tolerances of three mussel species in a brackish water canal: size, season and laboratory protocols. Biofouling21, 87-97.
Ravaux, J., Léger, N., Rabet, N., Morini, M., Zbinden, M., Thatje, S. and Shillito, B.
(2012). Adaptation to thermally variable environments: capacity for acclimation of thermal limit and heat shock response in the shrimp Palaemonetes varians. J. Comp. Physiol. B182, 899-907.
Richard, J., Morley, S. A., Thorne, M. A. and Peck, L. S.(2012). Estimating long-term survival temperatures at the assemblage level in the marine environment: towards macrophysiology. PLoS ONE7, e34655.
Robinson, E. and Davison, W.(2008). The Antarctic notothenioid fish Pagothenia borchgrevinkiis thermally flexible: acclimation changes oxygen consumption. Polar Biol.31, 317-326.
Schmidt-Nielsen, K.(1990). Animal Physiology: Adaptation and Environment, 4th edn, pp. 602. Cambridge: Cambridge University Press.
Schulte, P. M., Healy, T. M. and Fangue, N. A.(2011). Thermal performance curves, phenotypic plasticity, and the time scales of temperature exposure. Integr. Comp. Biol.51, 691-702.
Seebacher, F., Davison, W., Lowe, C. J. and Franklin, C. E.(2005). A falsification of the thermal specialization paradigm: compensation for elevated temperatures in Antarctic fishes. Biol. Lett.1, 151-154.
Somero, G. N. (2010). The physiology of climate change: how potentials for acclimatization and genetic adaptation will determine ‘winners’ and ‘losers’. J. Exp. Biol.213, 912-920.
Somero, G. N. (2012). The physiology of global change: linking patterns to mechanisms. Ann. Rev. Mar. Sci.4, 39-61.
Somero, G. N. and DeVries, A. L.(1967). Temperature tolerance of some Antarctic fishes. Science156, 257-258.
Stearns, S. C.(1992). The Evolution of Life Histories.Oxford: Oxford University Press.
Stillman, J. H.(2003). Acclimation capacity underlies susceptibility to climate change.
Science301, 65.
Stillman, J. H. and Somero, G. N.(2000). A comparative analysis of the upper thermal tolerance limits of eastern Pacific porcelain crabs, genus Petrolisthes: influences of latitude, vertical zonation, acclimation, and phylogeny. Physiol. Biochem. Zool.73, 200-208.
Strobel, A., Bennecke, S., Leo, E., Mintenbeck, K., Pörtner, H. O. and Mark, F. C.
(2012). Metabolic shifts in the Antarctic fish Notothenia rossiiin response to rising temperature and PCO2. Front. Zool.9, 28.
Tewksbury, J. J., Huey, R. B. and Deutsch, C. A.(2008). Ecology. Putting the heat on tropical animals. Science320, 1296-1297.
Turner, J., Bindschadler, R., Convey, P., di Prisco, G., Fahrbach, E., Gutt, J., Hodgson, D., Mayewski, P. and Summerhayes, C. (2009). Antarctic Climate Change and the Environment, pp. 526. Cambridge: Scientific Committee on Antarctic Research.
Urban, H. J. and Silva, P.(1998). Upper temperature tolerance of two Antarctic mollusks (Laternula ellipticaand Nacella concinna) from Potter Cove, King George Island, Antarctic Peninsula, Reports on Polar Research. Alfred Wegener Institut for Polar and Marine Research, Bremerhaven299, 230-236.
Wilson, J. G. and Elkain, B.(1991). Tolerances to high temperature of infaunal bivalves and the effect of geographical distribution, position on the shore and season. J. Mar. Biol. Assoc. UK71, 169-177.
Wilson, R. S. and Franklin, C. E. (2002). Testing the beneficial acclimation hypothesis. Trends Ecol. Evol.17, 66-70.
Wilson, R. S., Franklin, C. E., Davison, W. and Kraft, P.(2001). Stenotherms at sub-zero temperatures: thermal dependence of swimming performance in Antarctic fish.