ORIGINAL RESEARCH
Diffusion-weighted Imaging of Metastatic Brain
Tumors: Comparison with Histologic Type and
Tumor Cellularity
Y. Hayashida T. Hirai S. Morishita M. Kitajima R. Murakami Y. Korogi K. Makino H. Nakamura I. Ikushima M. Yamura M. Kochi J.-i. Kuratsu Y. Yamashita
BACKGROUND AND PURPOSE: On diffusion-weighted imaging (DWI), metastatic tumors of the brain may exhibit different signal intensities (SI) depending on their histology and cellularity. The purpose of our study was to verify the hypotheses (1) that SI on DWI predict the histology of metastases and (2) that apparent diffusion coefficient (ADC) values reflect tumor cellularity.
MATERIALS AND METHODS: We assessed conventional MR images, DWI, and ADC maps of 26 metastatic brain lesions from 26 patients, 13 of whom underwent surgery after the MR examination. Two radiologists performed qualitative assessment by consensus of the SI on DWI in areas corre-sponding to their enhancing portions. We measured the contrast-to-noise ratio (CNR) on T2-weighted images and normalized ADC (nADC) values, and compared them with tumor cellularity.
RESULTS: The mean SI on DWI and the CNR on T2-weighted images were significantly lower in well differentiated than in poorly differentiated adenocarcinomas and lesions other than adenocarcinoma. The mean nADC value was significantly higher in well differentiated than poorly differentiated adeno-carcinomas and lesions other than adenocarcinoma. All 3 small-cell adeno-carcinomas and 1 large-cell neuroendocrine carcinoma exhibited high SI on DWI. The nADC value showed a significant inverse correlation with tumor cellularity. There was no significant correlation between the CNR and tumor cellularity.
CONCLUSION:The SI on DWI may predict the histology of metastases; well differentiated adenocar-cinomas tended to be hypointense, and small- and large-cell neuroendocrine caradenocar-cinomas showed hyperintensity. Their ADC values reflect tumor cellularity.
T
he estimated annual incidence of central nervous system (CNS) metastasis is approximately 8.3 per 100,000 per year, similar to the reported incidence of new primary brain neoplasms.1Although metastatic tumors of the brain can usu-ally be diagnosed with the patient’s clinical information and imaging studies, some metastatic brain lesions cannot be dif-ferentiated from high-grade glioma, lymphoma, abscess, tu-mefactive multiple sclerosis, and subacute infarction on con-ventional MR imaging.2On conventional MR imaging, the histology of metastatic tumors of the brain may affect their signal intensity (SI).3,4In addition, their components (ie, solid tumor, degeneration, hemorrhage, and cyst) manifest various SIs on MR imaging. On diffusion-weighted imaging (DWI), different SIs for these tumors have been reported.5-10These tumors can mimic brain abscesses or early brain infarction on DWI.6,10For an inter-pretation of the SI of brain metastasis on DWI, an understand-ing of its background is required.
Although SI on DWI of the solid portion of brain metasta-ses may be associated with their histology and tumor cellular-ity, these relationships remain to be investigated systemati-cally. The hypotheses in our study were (1) that SI on DWI predicts the histology of metastases and (2) that apparent
dif-fusion coefficient (ADC) values reflect tumor cellularity. The purpose of our study was to verify these hypotheses using the MR imaging data of our institution and neurosurgically con-firmed histologic results.
Materials and Methods
Subjects
Among 21,600 consecutive patients who underwent MR imaging ex-amination in our institution between January 1999 and January 2005, 2280 patients were imaged to rule out brain metastasis. Of these, 285 patients with MR imaging findings of suspected brain metastasis were identified in the MR imaging data base. DWI was not routinely per-formed for all patients with clinically suspected brain metastasis. We performed DWI in patients who had a large T2 prolonged lesion or solitary mass in the brain. Thus, 58 of 285 patients underwent con-ventional MR imaging and DWI. We excluded 32 patients with the following conditions: MR imaging evidence of intratumoral hemor-rhage (n⫽14), previous treatment of chemotherapy, radiation ther-apy, or biopsy for brain lesions before data acquisition (n⫽8), his-tologically identified primary brain tumors (n⫽ 3), no definite histologic diagnosis of extra-CNS malignant lesions (n⫽3), no avail-ability for review of digital data from conventional MR imaging and DWI (n⫽2), and microscopic hemorrhage in cases with available histologic specimens of the brain lesions (n⫽2). Our institutional review board approved this study, and written informed consent was obtained for MR examination.
MR Imaging
All MR imaging scans were obtained with a 1.5T superconducting system (Magnetom Vision; Siemens, Erlangen, Germany). Conven-tional MR imaging and DWI were acquired during the same
proce-Received October 10, 2005; accepted after revision November 16.
From the Departments of Diagnostic Radiology (Y.H., T.H., S.M., M.Ki., R.M., I.I., M.Y., Y.Y.) and Neurosurgery (K.M., H.N., M.Ko., J.-i.K.), Graduate School of Medical Sciences, Kumamoto University, Kumamoto, Japan; and Department of Radiology (Y.K.), University of Occupational and Environmental Health, School of Medicine, Kitakyushu, Japan.
Presented in part at the 43rd Annual Meeting of the American Society of Neuroradiology; May 21–27, 2005; Toronto, Ontario, Canada.
Address correspondence to Toshinori Hirai, Department of Diagnostic Radiology, Graduate School of Medical Sciences, School of Medicine, Kumamoto University, 1-1-one Honjo, Kumamoto 860-8556 Japan; e-mail: t-hirai@kaiju.medic.kumamoto-u.ac.jp
BRAIN
ORIGINAL
dure. Conventional MR imaging study consisted of a sagittal T1-weighted localizing sequence (repetition time [TR]/echo time [TE]/ excitations, 15/6/1), and axial T1-weighted (670/14/1), fast spin-echo T2-weighted (TR/TEeff/excitation, 3500/96/2; echo-train length, 7), and fluid-attenuated inversion recovery (FLAIR) (TR/TEeff/inversion
time, 6000/120/2000; echo-train length, 17) sequences, and triplanar contrast-enhanced T1-weighted sequences. The T1-weighted, T2-weighted, and FLAIR sequences were acquired at a section thickness of 5 mm with a 1-mm intersection gap, a 256⫻256 –512 matrix, and a 22-cm field of view (FOV).
DWI was performed in the transverse plane using a spin-echo, echo-planar imaging sequence with the following parameters: TR/ TE/inversion time, 12000/100/2200; diffusion gradient encoding in 3 orthogonal directions; b⫽1000 s/mm2; FOV, 220 mm; matrix size,
128⫻128 pixels; section thickness, 5 mm; section gap, 1 mm; and number of signals acquired, 1. DWI scans were performed before contrast-enhanced T1-weighted imaging.
The ADC values were calculated as follows: ADC⫽ ⫺[ln(S/S0)]/b,
whereSis the SI of the region of interest (ROI) obtained through 3 orthogonally oriented DWIs or diffusion trace images,S0is the SI of the ROI acquired through reference T2-weighted images, andbis the gradientbfactor with a value of 1000 smm2. ADC maps were
calcu-lated on a pixel-by-pixel basis.
Image Evaluation
Qualitative assessment of the SI on DWI in areas corresponding to the enhanced portion of the lesions on contrast-enhanced T1-weighted images was performed by the consensus of 2 experienced neuroradi-ologists who were blinded to the clinical and pathologic information. In cases with multiple lesions, the largest lesion was selected for eval-uation. The SI of the lesions was described with the use of a 5-point scale:⫺2, hypointense relative to the normal-appearing white matter;
⫺1, isointense relative to the normal-appearing white matter; 0, isointense relative to the normal-appearing cortical gray matter;⫹1, slightly hyperintense relative to the normal-appearing cortical gray matter; and⫹2, hyperintense relative to the normal-appearing corti-cal gray matter.
On T2-weighted images and ADC maps of areas corresponding to the enhancing portion of the lesions on contrast-enhanced T1-weighted images, 5 uniform ROIs consisting of more than 20 pixels were manually drawn by an experienced radiologist to obtain the SI on T2-weighted images and the ADC values. The ROIs were carefully placed on the solid portion to avoid volume averaging with cystic or degenerative regions that might influence the quantitative data. The mean of the 5 ROI measurements was recorded as a representative value for each case. The same method was applied to a corresponding site in the contralateral white matter judged as normal on both con-trast-enhanced T1- and T2-weighted images. On T2-weighted im-ages, image noise measurement was performed by recording the SD of the SI within a ROI outside the head (ie, in air). The contrast-to-noise ratio (CNR) for T2-weighted images was calculated as follows: CNR⫽(SIt⫺SIc)/SDnoise, where SIt is the SI of the tumor, SIc is the SI of the contralateral white matter, and SDnoise is the SD of the SI of air. The normalized ADC (nADC) ratio was calculated as the ratio of the mean ADC of the tumor divided by the mean ADC of the corre-sponding contralateral area.
Tumor cellularity (nuclear attenuation), analyzed with NIH Im-age software (version 1.0.0.1) on a Windows computer, was defined as the total area of nuclei of tumor cells divided by the area of the histo-logic section (original magnification, 200⫻). One radiologist (S.M.)
measured nuclear attenuation of the representative area 3 times in each specimen. A mean value of the measurements for each lesion was used as the representative value for each case.
Statistical Analysis
We performed statistical analyses of the qualitative and quantitative evaluation for all brain lesions and histologically confirmed brain lesions. For qualitative analysis, we performed Mann-WhitneyUtests to assess the differences in the SI on DWI between well differentiated and poorly differentiated adenocarcinomas, between well differenti-ated adenocarcinomas and tumors with different histologic results, and between poorly differentiated adenocarcinomas and tumors with different histologic results.
In our quantitative analysis of the CNR and the nADC value, we performed unpairedttests to assess differences between the well dif-ferentiated and poorly difdif-ferentiated adenocarcinomas, between well differentiated adenocarcinomas and tumors with different histologic results, and between poorly differentiated adenocarcinomas and tu-mors with a different histologic results. We used the Pearson correla-tion tests to evaluate the correlacorrela-tion between tumor cellularity and the nADC value, and between tumor cellularity and the CNR on T2-weighted images. APvalue of less than 0.05 was considered to indicate a statistically significant difference.
Results
A total of 26 patients, 15 men and 11 women ranging in age from 26 to 81 years (mean, 57.9 years), were included. Of these, 13 patients underwent surgical resection of the brain tumors after MR imaging study. The 13 patients were 8 men and 5 women ranging in age from 26 to 73 years (mean, 57 years). The summary of these lesions is shown on Tables 1 and 2. Because serous adenocarcinomas are considered to be well differentiated adenocarcinomas, we classified 2 serous adeno-carcinomas from the ovary and uterus as well differentiated adenocarcinomas. All adenocarcinomas except these 2 derived from the lung. The interval between DWI study and surgery ranged from 0 to 7 (mean⫾SD, 3.3⫾2.4) days in the 13 operated patients.
[image:2.585.300.533.56.204.2]Figure 1 shows the comparison of the SI on DWI for all 26 metastatic tumors categorized according to their histology. Of the 6 well differentiated adenocarcinomas, 3 were grade⫺1, 2 were grade⫺2, and 1 was grade 0; 4 of 6 poorly differentiated adenocarcinomas were grade⫹1, and the other 2 were grade 0 (Figs 2 and 3). The mean SI on DWI was significantly lower in
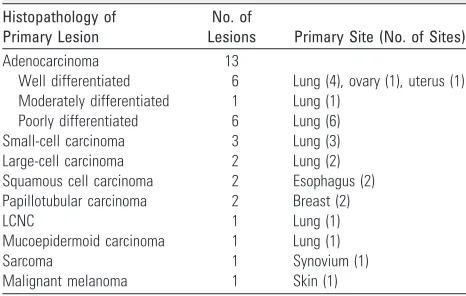
Table 1: Summary of 26 primary malignant lesions
Histopathology of Primary Lesion
No. of
Lesions Primary Site (No. of Sites)
Adenocarcinoma 13
Well differentiated 6 Lung (4), ovary (1), uterus (1) Moderately differentiated 1 Lung (1)
Poorly differentiated 6 Lung (6) Small-cell carcinoma 3 Lung (3) Large-cell carcinoma 2 Lung (2) Squamous cell carcinoma 2 Esophagus (2) Papillotubular carcinoma 2 Breast (2)
LCNC 1 Lung (1)
Mucoepidermoid carcinoma 1 Lung (1)
Sarcoma 1 Synovium (1)
Malignant melanoma 1 Skin (1)
well differentiated than in poorly differentiated adenocarcino-mas (P⫽.0065) and lesions other than adenocarcinoma (P⫽
.0017) (Figs 2 and 3). There was no statistically significant difference for the mean SI between poorly differentiated ade-nocarcinomas and lesions other than adenocarcinoma (P⫽
.46). All 3 small cell carcinomas and a large cell neuroendo-crine carcinoma were ranked as grade⫹2 (Figs 4 and 5), a malignant melanoma as grade⫺1, and other tumors as grade 0 or⫹1.
Figure 6 shows the distribution of the CNR on T2-weighted images and the nADC values of the 26 metastatic tumors grouped according to their histologic results. The mean CNR of well differentiated adenocarcinomas (12.5⫾11.3) was sig-nificantly lower than of poorly differentiated adenocarcino-mas (39.3⫾20.3,P⫽.015) and of tumors of the other histo-logic type (35.9⫾16.4,P⫽.006). There was no statistically significant difference for the mean CNR between poorly dif-ferentiated adenocarcinomas and lesions other than adeno-carcinoma (P⫽.61). The mean nADC values of well differen-tiated adenocarcinomas (1.81⫾0.36) was significantly higher than that of poorly differentiated adenocarcinomas (1.40⫾ 0.27,P⫽.04) and that of tumors of other histologic types (1.19⫾ 0.36, P⫽.003) (Fig 6). There was no statistically significant difference for the mean nADC between poorly dif-ferentiated adenocarcinomas and lesions other than adeno-carcinoma (P⫽.36). Of 3 small cell carcinomas, 2 exhibited the lowest nADC among all 26 tumors. A large cell neuroen-docrine carcinoma exhibited a low nADC and a high CNR, and a malignant melanoma had a low CNR and low nADC value.
Figure 7 shows the comparison of the SI on DWI for 13 histologically confirmed brain tumors categorized according to their histology. All 4 well differentiated adenocarcinomas were grade⫺2 or⫺1, and both poorly differentiated
[image:3.585.53.285.51.199.2]adeno-carcinomas were grade⫹1 (Figs 2 and 3). The mean SI on DWI was significantly lower in well differentiated adenocarci-noma than lesions other than adenocarciadenocarci-noma (P⫽.0082).
Figure 8 shows the distribution of the CNR on T2-weighted images and the nADC values of 13 histologically confirmed brain lesions grouped according to their histologic results. The mean CNR of well differentiated adenocarcinomas (15 ⫾ 10.9) was lower than that of poorly differentiated adenocarci-nomas (39⫾9.9). The mean CNR of the well differentiated adenocarcinoma was significantly lower than lesions other than adenocarcinoma (42.1⫾9.3,P⫽.0017). The nADC of 4 well differentiated adenocarcinomas ranged from 1.48 to 2.26 (1.92⫾0.33) and that of 2 poorly differentiated adenocarci-nomas ranged from 1.45 to 1.5 (1.48⫾0.35). The mean nADC of the well differentiated adenocarcinoma was significantly higher than lesions other than adenocarcinoma (1.28⫾0.44,
P⫽.03).
As shown in Fig 9, the nADC value was inversely correlated with tumor cellularity (r⫽ ⫺0.70,P⫽.0059). On the other hand, there was no correlation between tumor cellularity and SI on the T2-weighted images (r⫽0.41,P⫽.17).
Discussion
On DWI, well differentiated adenocarcinomas tended to show hypointensity relative to gray matter. In addition, they mani-fested significantly lower SI than poorly differentiated adeno-carcinomas and tumors of other histologic types. The SI on DWI is influenced by T2, the ADC,bvalue, spin attenuation, and TE.11All 6 well differentiated adenocarcinomas had a low CNR on T2-weighted images and high nADC values; theb
value and TE were constant in our study. T2 shortening occurs in the presence of hemorrhage; however, the lesions were free of apparent hemorrhage on MR imaging, and the surgical specimens yielded no evidence of hemorrhage. Therefore, we postulate that the hypointensity of the well differentiated ad-enocarcinomas was associated with an inherently low T2 and high water diffusibility in the tissues, both of which resulted in decreased SI on DWI.
The reason for the hypointensity of metastatic brain ade-nocarcinomas on T2-weighted images remains to be elucidat-ed.3,4Carrier et al,4who studied the blood products calcium, mucin, and iron in 14 patients with metastatic adenocarcino-mas, concluded that their appearance on MR imaging most likely reflected the inherent T2 effect of the tissue. However, they did not group the tumors according to their degree of differentiation in their evaluation of the T2-weighted images. We found that well differentiated adenocarcinomas mani-fested a significantly lower CNR on T2-weighted images than did poorly differentiated adenocarcinomas, suggesting that the degree of differentiation may be relevant in their SI on T2-weighted images. The well differentiated adenocarcinomas in our series derived from the lung, ovary, and uterus. Other investigators3,4reported that metastatic brain lesions originat-ing from the colon, lung, or breast manifested T2 hypointen-sity. These results suggest that the histology of the metastatic adenocarcinomas rather than the organ harboring the pri-mary tumor may play a role in its SI.
Although others5,10 reported that small cell carcinomas showed hyperintensity on DWI and low ADC values, the rea-son for their high signal intensity remains unknown. In our Fig 1.Comparison of the signal intensity of 26 metastatic brain tumors on
diffusion-weighted images. All 6 well differentiated adenocarcinomas (Well diff. AC) were classified as grade⫺2,⫺1, or 0. All 3 small-cell carcinomas (Small cell ca.) and 1 large-cell neuroendocrine carcinoma (LCNC) were graded as⫹2. A malignant melanoma was grade
⫺1; all other tumors were grade 0 or⫹1.Poorly diff. AC, indicates poorly differentiated adenocarcinomas;Large cell ca., large cell carcinoma;SCC, squamous cell carcinoma; Papillotubular ca., papillotubular carcinoma;Mucoepidermoid ca., mucoepidermoid carci-noma;Mod. diff. AC, moderately differentiated adenocarcinoma. The signal intensity was graded on a point scale:⫺2⫽hypointense relative to the normal-appearing white matter;
series, all 3 small-cell carcinomas and 1 large-cell neuroendo-crine carcinoma, considered to be highly aggressive poorly differentiated lung neuroendocrine tumors,12were hyperin-tense on DWI. They exhibited high cellularity and low ADC values, and they tended to have a higher CNR on T2-weighted images. We postulate that their hyperintensity on DWI is the result of synergistic effect of restricted diffusion and T2 shine-through.
Other lesions that had low nADC values of approximately 1.0 were poorly differentiated adenocarcinoma, papillotubu-lar carcinoma, sarcoma, and malignant melanoma. Unlike the small-cell carcinomas, they did not manifest hyperintensity of grade⫹2 on DWI; a partial explanation for this finding may
be their relatively low SI on T2-weighted images. On the other hand, 1 of 2 papillotubular carcinomas with a low ADC value and a high CNR on T2-weighted images was not hyperintense of grade⫹2 on DWI, indicating that larger studies are re-quired to elucidate the mechanisms that underlie the SI on DWI.
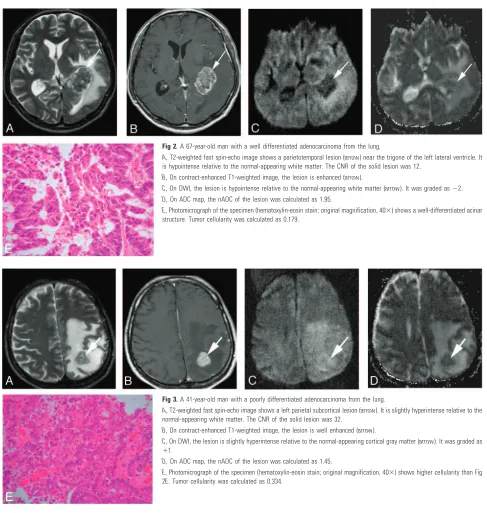
The nADC value of the tumors was significantly correlated with tumor cellularity; our small-cell carcinomas and large-cell neuroendocrine carcinoma exhibited high tumor large- cellular-ity. Gliomas and meningiomas manifested a good correlation between the ADC value and tumor cellularity.8,13-15We pos-tulated that the cellularity of metastatic brain tumors might contribute to their ADC values. Our finding that there was no Fig 2.A 67-year-old man with a well differentiated adenocarcinoma from the lung.
A, T2-weighted fast spin-echo image shows a parietotemporal lesion (arrow) near the trigone of the left lateral ventricle. It is hypointense relative to the normal-appearing white matter. The CNR of the solid lesion was 12.
B, On contract-enhanced T1-weighted image, the lesion is enhanced (arrow).
C, On DWI, the lesion is hypointense relative to the normal-appearing white matter (arrow). It was graded as⫺2.
D, On ADC map, the nADC of the lesion was calculated as 1.95.
E, Photomicrograph of the specimen (hematoxylin-eosin stain; original magnification, 40⫻) shows a well-differentiated acinar structure. Tumor cellularity was calculated as 0.179.
Fig 3.A 41-year-old man with a poorly differentiated adenocarcinoma from the lung.
A, T2-weighted fast spin-echo image shows a left parietal subcortical lesion (arrow). It is slightly hyperintense relative to the normal-appearing white matter. The CNR of the solid lesion was 32.
B, On contract-enhanced T1-weighted image, the lesion is well enhanced (arrow).
C, On DWI, the lesion is slightly hyperintense relative to the normal-appearing cortical gray matter (arrow). It was graded as
⫹1.
D, On ADC map, the nADC of the lesion was calculated as 1.45.
[image:4.585.51.538.34.547.2]significant correlation between their SI on T2-weighted im-ages and tumor cellularity suggests that various factors affect the SI on T2-weighted images, including paramagnetic (eg, iron, calcification, hemorrhagic components, melanin), non-paramagnetic (eg, protein concentration, fibrocollagenous stroma, flow-related signal intensity change), and other fac-tors (eg, scant cytoplasm, attenuated cellularity).16 Thus, it appears unlikely that the cellularity of metastatic brain tumors can be estimated based on their SI on T2-weighted images.
There are some limitations to our study. First, half of the metastatic tumors were without histologic confirmation for the brain tumors. The qualitative and quantitative results for all 26 lesions were similar to those for the histologically con-firmed 13 brain lesions. Therefore, we believe that our results
reflect a tendency of the signal intensity on DWI for brain metastases.
Second, we could not rule out the presence of tiny, unde-tected intratumoral hemorrhagic components that may have affected the results of our study, though there was no evidence of hemorrhage on conventional MR imaging and DWI. In addition, 13 surgical specimens were available for histologic assessment, and none exhibited evidence of hemorrhage.
Third, partial volume effects could have affected our quan-titative ROI measurements. However, although intratumoral cystic and degenerative changes have the potential to affect quantitative values, it is unlikely that such areas were present within the measured ROI because the DWI and T2-weighted images had a high spatial resolution (voxel sizes, 1.72⫻1.72 Fig 4.A 69-year-old man with small-cell carcinoma from the lung.
A, On T2-weighted fast spin-echo image, the solid portion of a right parietal mass lesion (arrow) is hyperintense relative to the normal-appearing white matter. The CNR of the enhancing lesion was 45.
B, On contract-enhanced T1-weighted image, the peripheral region of the lesion is enhanced (arrow).
C, On DWI, the lesion is hyperintense relative to the normal-appearing cortical gray matter (arrow). The lesion was graded as⫹2.
D, On ADC map, the solid lesion is slightly hyperintense. Its nADC was calculated as 0.57.
E, Photomicrograph of the specimen (hematoxylin-eosin stain; original magnification, 40⫻) shows high cellularity. The tumor cellularity was calculated as 0.72.
Fig 5.A 63-year-old man with large cell neuroendocrine carcinoma from the lung.
A, On T2-weighted fast spin-echo image, the solid portion of left occipital lesion (arrow) is hyperintense relative to the normal-appearing white matter. The CNR of the enhancing lesion was 56.
B, On contrast-enhanced T1-weighted image, the posterior part of the lesion is enhanced (arrow). There are multiple enhancing areas (arrowheads) in the left frontal lobe indicative of subacute infarction.
C, On DWI, the solid lesion is hyperintense relative to the normal-appearing cortical gray matter (arrow). The lesion was ranked as grade⫹2.
D, On ADC map, the solid lesion is hypointense; its nADC was calculated as 1.04.
[image:5.585.53.536.34.573.2]and 0.86⫻0.43 mm, respectively), and cysts and degenerative changes would have been recognized by the evaluators.
Finally, the original site of the examined surgical specimens may not have coincided with the site of the ROI measurement. For our quantitative analysis of tumor cellularity, we chose a representative area in the solid portion of the specimens. To obtain the ROI measurements on MR imaging, we calculated the mean value of 5 uniform ROIs in the solid portion of each tumor. Therefore, we believe that these data were derived from the representative areas in the solid portion of the metastatic brain tumors.
Conclusion
The SI on DWI may predict the histology of brain metastases. On DWI, the enhancing areas of metastatic brain tumors of different histologic types demonstrated different SI. Well differentiated ad-enocarcinomas tended to be hypointense; their SI was signifi-cantly lower than that of tumors with a different histology. Our 3
small-cell carcinomas and 1 large-cell neuroendocrine carcinoma manifested hyperintensity on DWI. Their ADC values reflected the cellularity of metastatic brain tumors.
References
1. Smirniotopoulos JG.The new WHO classification of the brain tumors. Neu-roimaging Clin N Am1999;9:595– 613
[image:6.585.65.275.43.178.2]Fig 9. Relationship between nADC and tumor cellularity. The nADC value inversely correlated well with tumor cellularity (r⫽ ⫺0.70,P⫽.0059).
Table 2: Summary of 13 operated brain lesions
Histopathology of Brain Lesion
No. of Lesions
Primary site (No. of Sites)
Adenocarcinoma 6
Well differentiated 4 Lung (3), ovary (1) Poorly differentiated 2 Lung (2) Squamous cell carcinoma 2 Esophagus (2) Small-cell carcinoma 1 Lung (1) Large-cell carcinoma 1 Lung (1) Papillotubular carcinoma 1 Breast (1)
LCNC 1 Lung (1)
Mucoepidermoid carcinoma 1 Lung (1)
Note:—LCNC indicates large-cell neuroendocrine carcinoma. Fig 6.Comparison of the nADC value and CNR on T2-weighted images of 26 metastatic
brain tumors of different histologic types. Most well differentiated adenocarcinomas (Well diff. AC) are distributed at high nADC and low CNR. Of the 3 small-cell carcinomas (Small cell ca.), 2 exhibit nADC values below 1.0. The large-cell neuroendocrine carcinoma (LCNC) manifests low nADC value and high CNR. Poorly differentiated adenocarcinoma (Poorly diff. AC), papillotubular carcinoma (Papillotubular ca.), sarcoma, and malignant melanoma (Melanoma) also exhibit low nADC values.Large cell ca.indicates large cell carcinoma; SCC, squamous cell carcinoma;Mucoepidermoid ca.: mucoepidermoid carcinoma;Mod. diff. AC, moderately differentiated adenocarcinoma.
Fig 7.Comparison of the signal intensity of 13 histologically confirmed brain lesions on diffusion-weighted images. All 4 well differentiated adenocarcinomas (Well diff. AC) were graded as⫺2 or⫺1, and 2 poorly differentiated adenocarcinomas (Poorly diff. AC) as⫹1. One small-cell carcinoma (Small cell ca.) and 1 large-cell neuroendocrine carcinoma (LCNC) were both graded as⫹2. The other lesions were graded as 0 or⫹1. The signal intensity was graded on 5-point scale as described in Fig 1.Large cell ca., large cell carcinoma;SCC, squamous cell carcinoma;Papillotubular ca., papillotubular indicates carcinoma; Mucoepi-dermoid ca., mucoepidermoid carcinoma.
[image:6.585.301.535.43.195.2] [image:6.585.53.286.278.429.2] [image:6.585.302.534.284.449.2] [image:6.585.301.534.510.628.2]2. Ricci PE.Imaging of adult brain tumors.Neuroimaging Clin N Am1999;9:651– 69 3. Egelhoff JC, Ross JS, Modic MT, et al.MR imaging of metastatic GI
adenocar-cinoma in brain.AJNR Am J Neuroradiol1992;13:1221–24
4. Carrier DA, Mawad ME, Kirkpatrick JB, et al.Metastatic adenocarcinoma to
the brain: MR with pathologic correlation.AJNR Am J Neuroradiol1994;15:
155–59
5. Okamoto K, Ito J, Ishikawa K, et al.Diffusion-weighted echo-planar MR
im-aging in differential diagnosis of brain tumors and tumor-like conditions.Eur
Radiol2000;10:1342–50
6. Holtas S, Geijer B, Stromblad LG, et al.A ring-enhancing metastasis with cen-tral high signal on diffusion-weighted imaging and low apparent diffusion
coefficients.Neuroradiology2000;42:824 –27
7. Stadnik TW, Chaskis C, Michotte A, et al.Diffusion-weighted MR imaging of intracerebral masses: comparison with conventional MR imaging and
histo-logic findings.AJNR Am J Neuroradiol.2001;22:969 –76
8. Kono K, Inoue Y, Nakayama K, et al.The role of diffusion-weighted imaging in
patients with brain tumors.AJNR Am J Neuroradiol2001;22:1081– 88
9. Hartmann M, Jansen O, Heiland S, et al.Restricted diffusion within ring
en-hancement is not pathognomonic for brain abscess.AJNR Am J Neuroradiol
2001;22:1738 – 42
10. Geijer B, Holtas S.Diffusion-weighted imaging of brain metastases: their
po-tential to be misinterpreted as focal ischaemic lesions.Neuroradiology2002;
44:568 –73
11. Hiwatashi A, Kinoshita T, Moritani T, et al.Hypointensity on diffusion-weighted MRI of the brain related to T2 shortening and susceptibility effects.
AJR Am J Roentgenol2003;181:1705– 09
12. Franklin WA.Pathology of lung cancer.J Thorac Imaging2000;15:3–12 13. Sugahara T, Korogi Y, Kochi M, et al.Usefulness of diffusion-weighted MRI
with echo-planar technique in the evaluation of cellularity in gliomas.J Magn
Reson Imaging1999;9:53– 60
14. Guo AC, Cummings TJ, Dash RC, et al. Lymphomas and high-grade astrocytomas: Comparison of water diffusibility and histologic
characteris-tics.Radiology2002;224:177– 83
15. Gauvain KM, McKinstry RC, Mukherjee P, et al.Evaluating pediatric brain
tumor cellularity with diffusion-tensor imaging.AJR Am J Roentgenol2001;
177:449 –54