E
ff
ects of Scandium and Zirconium Addition on Recrystallization Behavior
of Al
Mg
Si Alloy
+1Ken-ichi Ikeda
1,+2, Takuya Takashita
2,+3, Ryutaro Akiyoshi
3,+4, Satoshi Hata
4,
Hideharu Nakashima
4, Kazuhiro Yamada
5and Kenji Kaneko
51Division of Materials Science and Engineering, Faculty of Engineering, Hokkaido University, Sapporo 060-8628, Japan
2Graduate Student, Department of Molecular and Material Sciences, Interdisciplinary Graduate School of Engineering Sciences,
Kyushu University, Kasuga 816-8580, Japan
3Department of Molecular and Material Sciences, Interdisciplinary Graduate School of Engineering Sciences,
Kyushu University, Kasuga 816-8580, Japan
4Department of Advanced Materials Science and Engineering, Faculty of Engineering Sciences,
Kyushu University, Kasuga 816-8580, Japan
5Department of Materials Science and Engineering, Faculty of Engineering, Kyushu University, Fukuoka 819-0395, Japan
The effects of thermally stabilized particles on the recrystallization behavior of an AlMgSi alloy were investigated to obtain the fundamental knowledge for controlling the microstructure, texture, and mechanical properties of this alloy. In this study, the AlMgSiScZr alloy was cast, homogenized, and hot-rolled. Three types of spherical Al3(Sc, Zr) particles with L12structure, rod-like incoherent, spherical
semi-coherent, and spherical incoherent particles, were observed in a hot-rolled sample of the AlMgSiScZr alloy using transmission electron microscopy (TEM), scanning transmission electron microscopy (STEM), and energy-dispersive X-ray spectroscopy (EDS). In addition, three-dimensional electron tomography (3D-ET) and STEM-EDS revealed that all particles have a core-shell structure with a Sc-enriched core and a Zr-enriched shell. It is considered that these particles are formed during casting, homogenized treatment, and hot rolling. The crystal orientation distribution of the sample after cold rolling indicated that the presence of Al3(Sc, Zr) particles may interfere with the recrystallization (grain
growth) until 600°C. Comparison with the driving force of primary recrystallization and grain growth, and the pinning force of Al3(Sc, Zr)
particles, showed that these particles mainly contribute to the suppression of grain growth. The results of an in-situ heating SEM/EBSD analysis of the cold-rolled AlMgSiScZr alloy supported this suggestion. [doi:10.2320/matertrans.L-M2018802]
(Received November 29, 2017; Accepted January 4, 2018; Published March 25, 2018)
Keywords: AlMgSi alloy, recrystallization, precipitation, grain growth, pinning force
1. Introduction
Application of aluminum alloys in automotive structural materials have been increased in recent years for reducing vehicle body weight. Balancing between the formability and the strength is very important for automotive sheet materials. AlMgSi alloys can be strengthened further by a press forming process in an annealed material, and by subsequent paint baking for forming ¢AA phase. Consequently, it can be described that AlMgSi alloys are the most suitable aluminum alloys for automotive sheet materials.1)However, the strength of such alloys is still inferior to that of steel plates in the 340-MPa or the 440-MPa classes.2)Therefore, if an AlMgSi alloy with the right balance between good ductility and high strength could be developed without impairing its press formability, that would lead to further expansion of its demand.
In general, the material strengthening methods include solid solution, precipitation, and grain refinement strengthening. In particular, in the case of precipitation strengthening, high strength can be achieved by the formation of thermally stable precipitates which suppress the grain coarsening resulting that of fine grains. AlZnMg alloys are known
as the precipitation-strengthened alloys with poor ductility, unsuitable for the press-forming processes. Therefore, it is necessary to design a material based on the AlMgSi alloys, with precipitation of thermally stable particles.
In this study, we selected scandium (Sc) and zirconium (Zr), which form intermetallic compounds with aluminum. Sc and Zr added aluminum alloys have been attracted a large attention and studied intensively because they exhibit excellent mechanical properties. According to the AlScZr ternary phase diagram at 500°C and 600°C, it has been reported that there is a large region where Al3Sc, Al3Zr and
¡-Al matrix are in an equilibrium.3) In this region, Al 3Sc and Al3Zr form a composite phase known as Al3(Sc, Zr),3) known to be more stable in terms of its energy, thermal, and electronic structure than that of Al3Sc. In addition, Al3(Sc, Zr) has a slow coarsening rate at high temperatures and it is known to be a very stable phase.4)The morphology of Al3(Sc, Zr) precipitates in an AlScZr alloy is spherical, and it forms a core-shell structure with high Sc concentration at its core part and high Zr concentration at its shell part.5)It has been reported that the reason behind this is the difference in diffusion rate; Sc in aluminum has a much faster diffusion rate than that of Zr; thus, precipitation occurs in such a way that Al3Zr coats the Al3Sc after its precipitation. Furthermore, in a study of AlSc alloys, it has been shown that a supersaturated solid solution containing Sc is thermally unstable, and its decomposition rate is remarkably fast.4) Therefore, Al3Sc precipitates uniformly in the matrix within a short period of time, and subsequently, Al3(Sc, Zr) also precipitates uniformly, as well. The crystal structure of +1This Paper was Originally Published in Japanese in J. JILM66(2016)
609616.
+2Corresponding author, E-mail: ikeda.ken-ichi@eng.hokudai.ac.jp
+3Graduate Student, Kyushu University. Present address: JFE Steel
Corporation, Chiba 260-0835, Japan
+4Graduate Student, Kyushu University. Present address: Kobe Steel, Ltd.,
Moka 321-4367, Japan
Al3(Sc, Zr) has L12 structure, and its lattice misfit with the aluminum matrix is as low as about +1.3%. The interface energy between Al3(Sc, Zr) and the matrix is low, which results coherent precipitates. Moreover, when crystallization occurs during the solidification, it is thought that it acts as a nucleation site for effective recrystallized grains.
Al3(Sc, Zr) precipitates uniformly in the matrix, highly coherent with the matrix, and has high thermal stability. These three characteristics leads us to expect that the strength can be improved greatly by the precipitation strengthening and the grain refinement strengthening. Because the grain refinement strengthening has less ductility deterioration than other strengthening methods. It is thought that the Al3(Sc, Zr) precipitates will lead to increase the strength maintaining the ductility.
Detailed studies59) on the aging behavior from a supersaturated solid solution have been carried out with AlScZr ternary alloys. On one hand, the results show the excellent characteristics of Al3(Sc, Zr), i.e. high temperature for a long period is required to decompose it into a supersaturated solid solution, because it has high thermal stability. For example, in the study by Iwamura et al.,5) they have applied solution treatment at 650°C for 200 h, to decompose Al3(Sc, Zr). However, such heat treatment is impractical in the real production process. Therefore, we used the alloy which contains second phase particles from the beginning and focused on the acquirement of fundamental knowledge of recrystallization behavior.
In this study, we fabricated a Sc and Zr-added AlMg Si alloy and investigated the grain growth behavior of recrystallized grain during the heat treatment process. We investigated the feasibility of the Sc and Zr-added AlMgSi alloy as a potential material for practical applications.
2. Experimental Procedure
In this study, Sc and Zr were added to AlMgSi alloy with its final composition as Al0.5Mg0.5Si0.3Sc0.2Zr (the numerical values represent mass%), hereinafter referred to as “Alloy A.” Additionally, an Al0.5Mg0.5Si alloy, hereinafter referred to as“Alloy B,”was used for comparison. Both alloys were subjected to homogenized treatment (550°C for 4 h) and hot rolling (with the rolling start temperature at 400°C, rolling reduction of 78%, and 10 mm thickness). Microstructural studies were carried out on the hot-rolled samples by transmission electron microscope (TEM) and scanning transmission electron microscope (STEM) to observe the distribution and composition of the second phase particles, and compositional analyses by STEM-energy dispersive X-ray spectroscopy (EDS). In addition, three-dimensional electron tomography (3D-ET) method was also carried out to understand the morphology of the second phase particles. For the 3D-ET observation, HATA-8075 manufactured by Mel-Build Co. was used as a sample holder, and tilt-series STEM images were acquired at a tilt range of «75° with 1° to 2° step; then, three-dimensional reconstructions were performed by the sequential iterative reconstruction technique (SIRT).
To evaluate the recrystallization behavior during the thermo-mechanical treatment, the hot-rolled samples were
cold-rolled with a rolling reduction of 90%. The cold-rolled samples were annealed at three different temperatures, 400°C, 500°C, and 600°C for 1 h after cold rolling, and their cross-section in the rolling direction (RD plane) were analyzed using the scanning electron microscope/electron back scattered diffraction (SEM/EBSD) method. TEM/STEM observation and structural evaluation by the 3D-ET method were also performed to study the distribution of particles. Furthermore, anin-situheating SEM/EBSD analysis using a heating stage for SEM was carried out in 50°C increments from 300°C to 450°C to study the structural change during the heat treatments. The holding time at each temperature was 1.5 h, and the analyzed surface was the rolled surface (ND plane). The observation sample preparation method for the SEM/EBSD method was the same method as that we reported for AlMgSi alloy.10)The influence of the addition of Sc and Zr is investigated from the microstructural information of Alloy A, in particular the presences of the second-phase particles, and recrystallization behavior from the cold-rolled-annealed samples. Figure 1 shows theflow of the sample production process and experiment.
3. Results and Discussion
3.1 Microstructural analysis of hot-rolled samples The observation from the cross section in the vertical direction of ND and RD (TD plane) of the hot-rolled sample of Alloy A and Alloy B revealed that the grain width of Alloy A was 6 to 18 µm and that of Alloy B was 65 to 300 µm. These results showed that the grains were refined at the hot rolling by co-adding of Sc and Zr. It is believed that Al3(Sc, Zr) crystallized during the solidification in the casting of Alloy A, and the grains becamefiner. Figure 2 shows the high-angle annular dark-field (HAADF)-STEM image of the hot-rolled samples of both alloys. The region shown with a bright contrast in the HAADF-STEM image indicates that an element with a large atomic number exists, revealing that the Alloy A contains second phase particles in various morphology, such as spherical and rod shapes. As a result of determining the aspect ratio of the second phase particles from the HAADF-STEM image in Fig. 2(a), it was found that the aspect ratio of the spherical particles was 1.5 or less and of rod-like particles was 1.5 or more, they were mixed
TEM, STEM, EDS, 3D-ET Alloy A Al-0.5Mg-0.5Si-0.3Sc-0.2Zr (mass%) Alloy B Al-0.5Mg-0.5Si (mass%)
Homogenized treatment(550 Υ- 4 h)
Hot rolling (400 Υ, 78%, thickness, t= 10 mm)
Cold rolling (90%, thickness, t= 1 mm)
In-situheating observation
(300 Υ- 450 Υ)
SEM/EBSD Annealing
(400 Υ, 500 Υand 600 Υ- 1 h)
TEM, STEM, EDS, 3D-ET, SEM/EBSD
[image:2.595.312.540.72.229.2]together, and the longitudinal axis of the rod-like particles was oriented in the rolling direction. The main components of the spherical particle were found as Al, Sc, and Zr, and those of the rod-like particle as Al and Si or Al, Sc, and Zr from EDS point analysis of particles. Because this alloy is classified as an excess Si alloy in AlMgSi alloys, it is expected that Si would crystallize or precipitate individually. Therefore, it is feasible that the two types of particles with different compositions could be present in the rod-like particles. Figure 3 shows the STEM-EDS elemental distribution maps of spherical particles and those of rod-like particles, where Al, Sc, and Zr were present in the Alloy A. Elemental distribution maps of Sc and Zr confirms that the core-shell structure of Al3(Sc, Zr) precipitates is formed as has been reported.5)Figure 4(a) shows the TEM bright-field image in the region where spherical and rod-like particles were observed within the same grain. Further, Fig. 4(b) displays an electron diffraction pattern of the electron incident beam direction ©114ª, which shows an ordered lattice reflection caused by the L12structure. The white circle shows the TEM dark field image formed by the diffraction beam of the ordered lattice reflection shown in Fig. 4(b). As most of the spherical particles which present in the bright field image are shown in the darkfield image, it is suggested that Al3(Sc, Zr) precipitated with a specific orientation relationship with the matrix. Furthermore, the bright field images under two beam conditions using 220 diffraction beams showed wavelike Moiré fringe in these spherical particles. In the case of coherent particles, a coffee bean-shaped strain contrast, the Ashby-Brown contrast, is observed at the particles, but it changes to wavelike contrast as it becomes incoherent.11) Therefore, it was revealed that the spherical particles observed in Fig. 4(b) are probably incoherent particles. On the other hand, the spherical and rod-like particles indicated by white arrows in Fig. 4(a) were not observed in the dark-field image, Fig. 4(b). In order to
confirm whether the rod-like particles were Al3(Sc, Zr) having the L12structure or not, the extractive replica sample for TEM was observed, and an electron diffraction pattern of only precipitates was analyzed. The result confirmed that the rod-like particles were Al3(Sc, Zr) with the L12structure. The only difference from the spherical particles observed in Fig. 4(b) and the rod-like particles was that the spherical particles did not have an orientation relationship with the matrix. If we take into account the AlScZr ternary alloy casting reported by Norman et al. and the results of the studies of hot-rolled 5754 aluminum alloys with co-added Sc and Zr as reported by Fulleret al.,12,13)it could be considered that the rod-like particles were generated by eutectic reaction during solidification after casting. In the case of the spherical particles (white arrows) that were not observed in Fig. 4(b), from the STEM-EDS it was found that the Sc concentrated region was present in the spherical particle. Furthermore, when the STEM-EDS and 3D-ET were combined and subjected to the elemental analysis, it was confirmed that the Sc-enriched region was present in a cylindrical shape.14) It is considered that the rod-like particles were separated during hot rolling and spheroidized processes.
Based on these results, it was revealed that Al3(Sc, Zr) with L12 structure would become available when a small amount of Sc and Zr was added to the AlMgSi alloy. In the hot-rolled samples, two types of spherical particles with and without orientation relationship and rod-like particles coexist. The spherical particles with and without an orientation relationship with the matrix suggest that they were formed during the homogenization treatment and the solidification, respectively.
3.2 Microstructure analysis of cold-rolled and annealed samples
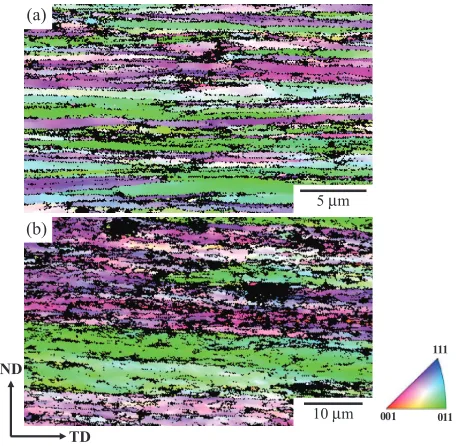
Figure 5 shows the crystal orientation distribution of the RD plane after the cold rolling of each alloy. The color shows the orientation of the ND plane of each crystal (hereinafter, the crystal orientation distribution maps show the same ND plane orientation distribution). Alloy A has a narrower grain size distribution than Alloy B. As stated in Section 3.1, the grain size distribution width has become narrower when Al3(Sc, Zr) is introduced in Alloy A after hot-rolling, and it probably remained its influence on the grain size, even after cold-rolling. Both alloys were occupied by brass, copper, and S orientations, which are the typical rolling textures of the aluminum alloy; besides, there were no major differences in the texture.
500 nm
RD (a)
1 μm
(b)
Fig. 2 HAADF-STEM images of hot-rolled sheets: (a) AlMgSiScZr (Alloy A) and (b) AlMgSi (Alloy B).
50 nm (b)
(a)
Al
(c)
M
(d)
Si
(e)
Sc
(f)
Zr
Fig. 3 (a) HAADF-STEM image and (b)(f ) STEM-EDS elemental maps of particles in hot-rolled sheet of Alloy A.
200 nm
g= 221
(b) (a)
[image:3.595.54.286.69.196.2] [image:3.595.313.541.71.162.2] [image:3.595.54.285.242.308.2]Figure 6 shows the crystal orientation distribution map on the RD plane after annealing of the cold-rolled samples of Alloy A at 400°C 400), 500°C 500), and 600°C (A-600) for 1 h. Elongated grains are found in A-400 and A-500, and the influence of cold rolling remained. However, it was found that the elongated grains were grown along the ND direction with A-600. Figure 7 shows the crystal orientation distribution on the RD plane of Alloy B after each heat treatment (named as B-400, B-500, and B-600). With B-400, the influence of cold rolling remained as occurrences of elongated grains, nevertheless grains were grown in an equiaxial manner with B-500 and B-600.
According to the crystal orientation relationship shown in Fig. 6 and Fig. 7, the distribution of the texture component was confirmed. Although Alloy A had a random crystal orientation distribution, a recrystallized texture with highly cube-oriented grains was formed in the annealed Alloy B. Al3(Sc, Zr) particles therefore cause a different recrystallized grain growth in AlMgSi alloy during the annealing after cold rolling. Moreover, because texture is randomized due to Al3(Sc, Zr) particles, a structural control may take place and contributes to improvements in the formability.
3.3 Influence of Al3(Sc, Zr) particles on recrystallized
grain growth
As shown in 3.2, it was shown that the AlMgSi alloy changes its microstructural formation process during the thermo-mechanical treatment by the presence of Al3(Sc, Zr) particles. A quantitative evaluation on how Al3(Sc, Zr) affects the formation process of AlMgSi alloy was conducted based on the microstructural observation. The deformed structure changed to stable structure by the annealing after cold-rolling, through a recovery, primary recrystallization, and normal grain growth, or secondary recrystallization. During each process, the progress or delay of recrystallization was determined by the correlation between the driving force of recrystallization and the Zener force (grain boundary pinning force) of the particles. In other words, if the driving force is larger than the Zener force, then the recrystallization proceeds, andvice versa. In this study, the driving force of recrystallization was determined by the SEM/EBSD method from the crystal orientation. The Zener force of Al3(Sc, Zr) particles was derived from the spatial distribution information obtained by TEM/STEM observation and the 3D-ET method. 3.3.1 The driving force of primary recrystallization of
cold-rolled samples
The recrystallization during the annealing of cold worked metals is called primary recrystallization, and the driving force of it is the stored strain energy introduced by the process. The dislocation substructures introduced during the cold working is recovered in the early stages of annealing. In other words, there are many sub-grains within the grains. In this study, the driving force was evaluated by the results obtained by the SEM/EBSD method of sub-boundary energy from the cold-rolled samples, as the stored strain energy.15) Based on the orientation information of the cold-rolled sample of Alloy A, as shown in Fig. 5, we observed the boundary where the orientation difference between the measured neighboring grains less than 15°, as a sub-boundary perpendicular to the observation plane, and the grain boundary energy£iat misorientation ªiwas calculated by the Read-Shockley’s Equation,16,17)eq. (1).
£i¼£m
ªi
ªm 1ln
ªi
ªm
ð1Þ
where, £m and ªm are the energy and the misorientation of high angle grain boundary, 0.32 J/m2and 15°,18)respectively.
ND
TD
011 001
111
5 μm
10 μm (a)
(b)
Fig. 5 ND plane crystal orientation distribution maps of cold-rolled sheets: (a) Alloy A and (b) Alloy B.
(a) A-400 (b) A-500 (c) A-600
ND
TD 150 μm
011 001
111
Fig. 6 ND plane crystal orientation distribution maps of cold-rolled and annealed sheets of Alloy A: (a) A-400, (b) A-500 and (c) A-600.
(a) B-400 (b) B-500 (c) B-600
ND
TD 150 μm
011 001
111
[image:4.595.56.286.70.293.2] [image:4.595.306.546.72.209.2] [image:4.595.49.289.342.481.2]The crystal orientation distribution map using regular hexagonal pixels were created by the SEM/EBSD method. The boundary length between the measuring points becomes x=pffiffiffi3, when the distance between the measuring points, x, is chosen. It is possible to obtain the sub-boundary energy per unit length using the formula ni£ix=
ffiffiffi 3 p
, with this boundary length as a unit length and the number of sub-boundariesniand a misorientationªmwithin the observation region. The total sum of the sub-boundary energy with less than 15° in the observation region£twill be£t¼P£i. The driving force of the primary recrystallization can be measured by subtracting the£tfrom the observed region. The driving force PI [J/m3=Pa] of the primary recrystallization can be
measured from eq. (2),
PI ¼
£t
S ð2Þ
whereSis the observed area. The values of£tandS, obtained from the sub-boundary length with misorientation less than 15° from the cold-rolled Alloy A sample is shown in Fig. 5(a), were 7.69©10¹4J/m and 6.49©10¹10m2, respectively. When PI was calculated in eq. (2), the driving
force was 1.18 MPa. This value will be compared with the Zener force of particles and the driving force of normal grain growth, as discussed in 3.3.2.
3.3.2 Zener force of Al3(Sc, Zr) particles
Dispersed particles, such as precipitates, contribute to the increase in strength by dispersion (precipitation) strengthening. Therefore, distribution of particles is also an important factor from the viewpoint of grain size and texture control. Because the elementary process of recrystallization is grain boundary migration, the dispersed particles in grains will inhibit grain boundary migration, leading to various phenomena, such as grain refinement. As shown in 3.1, a small amount of Sc and Zr in the AlMgSi alloy induces many Al3(Sc, Zr) particles, such as crystallized products and precipitates in the grains. In this section, we investigate the Zener force18,19) of the particles in the annealed cold-rolled samples. The interaction between the particles and grain boundaries is greatly influenced by the coherency. Figure 8(a) is a schematic image showing the influence of the incoherent particle on the boundary migration. The boundary moves in the Y direction in thisfigure. The force acting in the direction opposite to the direction of grain boundary migration is the Zener force. From Fig. 8(a), it is possible to express the Zener force using the grain boundary energy,£gb, and particle diameter, d, and the Zener force per incoherent particle, Fi,
will be given by eq. (3),
Fi¼³dcos¡£gbsin¡ ð3Þ
where, ¡ is the angle between the grain boundary and particles. When ¡=45°, the maximum value would be Fis,
and the value would thus be
Fis¼
³d£gb
2 ð4Þ
Based on this equation, the Zener force of incoherent particle, Pi, per unit volume will be calculated. When the
number of incoherent particles per unit volume is designated asNvthe number of particles that the grain boundary contacts per unit area, Nswill be Ns=d·Nv. When there is no size distribution in the particles, the Zener force, Pi, is given by
eq. (5).
Pi¼NsFis¼
Nv³d2£gb
2 ð5Þ
Figure 8(b) is a schematic image showing the relationship between the coherent particle and the grain boundary migration. The direction of the grain boundary migration is the same as that of the incoherent particles. These particles have a coherent relationship to Grain (1) and an incoherent relationship to Grain (2). Considering the energy balance at the interface between the particle surface and grain boundaries, the following equation can be used:
£23 ¼£13þ£12cos¢ ð6Þ where, £12 is the grain boundary energy, £13 represents the energy between Grain (1) and the coherent interface energy of particle, £23 is the energy between Grain (2) and the incoherent interface energy of particle, and ¢ is the angle shown in Fig. 8(b). From this equation, the Zener force, Fc
per coherent particle will be expressed as eq. (7):
Fc¼³dcos¤£12cosð¢¤Þ ð7Þ
where ¤ is the angle between the grain boundary and the coherent particle. When¤=¢/2 and ¢=0, it will become the maximum value,Fcs, and that value will be:
Fcs¼³d£12 ð8Þ
The Zener force,Pcof the coherent particle per unit area of
the grain boundary is given by eq. (9):
Pc¼NsFcs¼Nv³d2£12 ð9Þ
When eqs. (5) and (9) are compared, and the angle between the grain boundary and particle is less than 90°, the Zener force of the coherent particles becomes larger.
In this study, particles in the annealed Alloy A samples at 500°C and 600°C (A-500, A-600) were observed to obtain their particle coherency,Nvand average particle diameter,d, using TEM/STEM and 3D-ET method. Figures 9(a)(b) and (c)(d) are HAADF-STEM images ® the 3D reconstructed images of particles in the A-500 and A-600 samples, respectively. From analyzing d and Nv of both samples which were obtained based on spatial distribution information of multiple fields, it was found that d=45.7 nm and Nv= 1.15©1020/m3 for A-500, and d=89.9 nm and N
v= 3.25©1019/m3 for A-600. Moreover, it became clear that
X Y
ϕ
Particle(3) d
β
Grain(1)
Grain(2)
Boundary
Fc(Zener force) Incoherent
Coherent
Boundary
X Y
α
Incoherent particle d
Fi(Zener force)
(b) (a)
γgbsinα γgb
γ13 γ12
γ23
[image:5.595.56.283.660.760.2]the frequency of the presence of the rod-like particles was remarkably reduced. Therefore, it was considered that the rod-like particles can be ignored for calculation of the Zener force. Furthermore, evaluating the coherency of the spherical particles by TEM observation revealed that almost all particles in A-600 were found to be incoherent. It was found that semi-coherent particles and incoherent particles were mixed in A-500. It was obtained that the semi-coherent particles of A-500 had d=46.3 nm, and Nv=3.10© 1019/m3, and the incoherent particle had d=45.1 nm and Nv=8.38©1019/m3. Therefore, to evaluate the Zener force of A-500, eq. (5) was used for the incoherent particles and eq. (9) was used for the semi-coherent particles. Furthermore, for the grain boundary energies,£gband£12were regarded as the grain boundary energy of the high angle grain boundary; 0.32 J/m2. As a result, the Zener force P
z500(=Pi+Pc) of
the A-500 sample was 0.16 MPa, and the Zener force of A-600,Pz600(=Pi) was 0.13 MPa.
3.3.3 Driving force of grain growth during annealing The grain growth occurs during annealing after primary recrystallization. In the grain growth process, the driving force is the force with which the curved grain boundary becomes flat, and it is dependent on the grain boundary energy. The driving force of the grain growth is expressed in eq. (10),18)
PII¼ A£gb
R ð10Þ
where,Ris the radius of curvature of the grain boundary and Ais a constant. It can be seen from eq. (10) that as the grain size decreases, the driving force of the grain growth becomes
larger. In this study, the maximum driving force of the grain growth was obtained from the minimum crystal grain size of samples. From the crystal orientation distribution of Fig. 6, the minimum crystal grain radii of A-500 and A-600 were 4.1 µm and 7.9 µm, respectively. When A=1 and
£gb=0.32 J/m2 were used, the driving force of A-500 and A-600 were PII500=0.078 MPa, and PII600=0.041 MPa, respectively.
From these investigations, it was found that the driving force PI (=1.18 MPa) of the primary recrystallization is
much larger than the Zener force. Namely, Al3(Sc, Zr) spherical particles are not expected to be a strong hindrance for primary recrystallization in the annealing process of Alloy A at 500°C and at 600°C. On the other hand, the driving force of the grain growth after the primary recrystallization is smaller than the Zener force. Therefore, it is expected that the Al3(Sc, Zr) spherical particles may be an obstacle to grain growth.
3.4 Evaluation of recrystallization behavior by in-situ heating SEM/EBSD analysis
As discussed in Section 3.3, it was suggested that the Al3(Sc, Zr) spherical particles influence the subsequent grain growth behaviors rather than during the primary recrystallization. We will examine the prediction result by elucidating the recrystallization behavior by using in-situ heating SEM/EBSD analysis.
Figure 10 shows the results of cold-rolled sample of Alloy A. The black region in thefigure is a region with poor analytical reliability owing to the presence of high strain regions and grain boundaries. The sample before the heat
500 nm
500 nm
(a)(c)
(b)
(d)
Tilt Axis
Tilt Axis
[image:6.595.72.526.67.379.2]treatment has a typical cold-rolled structure. After the heat treatment at 300°C, it had almost the same structure as the cold-rolled texture, and there were no significant changes. However, at 350°C, grain growth was observed. The cold-rolled texture in the field almost disappeared by the heat treatment at 350°C, but it is found that the subsequent grain growth did not occur in the heat treatment up to 450°C. Furthermore, the recrystallized grain boundary is curved in many parts, suggesting that the Al3(Sc, Zr) particles had pinned the grain boundaries.
Figure 11 shows the results of cold-rolled sample of Alloy B. The sample before the heat treatment also had a cold-rolled structure like Alloy A, however it grew rapidly with heat treatment at 300°C, and the cold-rolled structure was consumed by this temperature. Moreover, during the heat treatment from 350°C to 450°C, the grain growth occurred continuously.
From the viewpoint of recrystallization texture compo-nents, it was found that the recrystallized grains of Alloy A didn’t have these components, while those of Alloy B had many components. Namely, in Alloy B, the recrystallized grains with rolling texture components of brass orientation ({110}©112ª: B) and copper orientation ({112}©111ª: C) grew
until 350°C, and the cube orientation ({100}©001ª) and Goss orientation ({110}©001ª) started growing by consuming the surrounding grains after 400°C.
From the above results, it was found that the presence of Al3(Sc, Zr) particles significantly changes the recrystallization behavior of the AlMgSi alloy, maintaining the grain shape after completion of the primary recrystallization, up to 450°C. The observation also revealed that the Al3(Sc, Zr) particles not only caused the pinning of grain growth after primary recrystallization but also influenced the elevation of the primary recrystallization starting temperature.
In the AlMgSi alloy, the presence of the MgSi compound or Si phase cannot be ignored. Because the Al3(Sc, Zr) particles are thermally stable with an average diameter of less than 100 nm even at temperatures of 500°C and 600°C, it is thought that they would be more effective than the MgSi or similar compounds in controlling the microstructures. Therefore, the thermally stable Al3(Sc, Zr) particles are expected to contribute towards the randomization of texture and the grain refinement, without additional heat treatment process. Furthermore, these structural changes are expected to contribute to the improvement in both the formability and the strength of AlMgSi alloys.
100 μm (a) RT (b) 300 -0.5h (c) 300 -1.5h (d) 350 -0.5h (e) 350 -1.5h (f) 400 -0.5h (g) 400 -1.5h (h) 450 -0.5h
TD
[image:7.595.77.526.68.241.2]RD
Fig. 10 ND plane crystal orientation distribution maps of cold-rolled sheet of Alloy A by usingin-situheating EBSD analysis.
100 μm
B C
C C
Cube
Cube Goss
Goss
TD
RD
[image:7.595.79.526.292.463.2](a) RT (b) 300 -0.5h (c) 300 -1.5h (d) 350 -0.5h (e) 350 -1.5h (f) 400 -0.5h (g) 400 -1.5h (h) 450 -0.5h
4. Conclusions
To clarify the influence of Sc and Zr on the recrystallization behavior of AlMgSi alloy, the alloy with a small amount of Sc and Zr was prepared. Then, it was examined for the presence of second phase particles and its grain growth behavior during recrystallization. From this investigation, the following aspects were clarified:
(1) The grains became finer than the non-added alloy in the case of hot-rolled samples with Sc and Zr co-addition, and two types of spherical Al3(Sc, Zr) particles, rod-like Al3(Sc, Zr) particles and rod-like Si particles were present. It was thought that 1) the rod-like Al3(Sc, Zr) particles were formed during the solidification, 2) spherical Al3(Sc, Zr) particles were precipitated during the homogenization treatment, and 3) incoherent spherical Al3(Sc, Zr) particles were formed from rod-like particles being separated during the hot-rolling.
(2) Annealing treatment of the co-added cold-rolled alloy sample showed that it consisted of elongated grains up to 500°C, and they became equiaxed at 600°C. Meanwhile, the non-added cold-rolled samples were also equiaxed at 400°C, and grains having recrystallized texture components occupied most of the sample. (3) After the comparison of driving forces of primary
recrystallization by stored strain energy owing to cold rolling and that of grain growth by recrystallized grain size as well as Zener force by Al3(Sc, Zr) particles, Al3(Sc, Zr) particles were found to act as the resistant to the grain growth after the primary recrystallization. (4) To clarify the recrystallization grain growth process
from 300°C to 450°C, an in-situ heating SEM/EBSD analysis was carried out. The results showed that the recrystallization starting temperature was increased in the co-added alloy, and the grain growth of primary recrystallization was inhibited. It also became clear that the primary recrystallization was nearly finished at 300°C in the non-added alloy, and the rolling and recrystallization texture components grew preferentially. (5) The texture and the grain size of AlMgSi alloys can be randomized and refined by the introduction
of Al3(Sc, Zr) particles, without a special thermo-mechanical treatment. It was found that Al3(Sc, Zr) particles are effective for improving the material properties by structural control.
Acknowledgments
We would like to express their hearty thanks to Mr. Y. Nishihata and T. Yokote for their help in the experimental work. We are also thankful to Kobe Steel, Ltd., for making AlMgSiScZr alloys used in this study. The present study was financially supported by The Japan Aluminium Association, The Light Metal Educational Foundation, Inc. and JSPS KAKENHI Grant Number 16H04502.
REFERENCES
1) T. Sakurai: Kobe Steel Engineering Reports57(2007) 4550. 2) K. Seto: JIDOUSHA NO KEIRYOUKA TECHNOLOGY, (NTS Inc.,
2014) pp. 2330.
3) J. Røyset and N. Ryum:Int. Mater. Rev.50(2005) 1944.
4) S. Fujikawa:J. JILM49(1999) 128144.
5) S. Iwamura and Y. Miura:J. JILM56(2006) 100104.
6) A. Tolley, V. Radmilovic and U. Dahmen:Scr. Mater.52(2005) 621 625.
7) C.B. Fuller, J.L. Murray and D.N. Seidman:Acta Mater.53(2005) 54015413.
8) V. Radmilovic, A. Tolley, E.A. Marquis, M.D. Rossell, Z. Lee and U. Dahmen:Scr. Mater.58(2008) 529532.
9) B. Forbord, H. Hallem, J. Røyset and K. Marthinsen:Mater. Sci. Eng. A475(2008) 241248.
10) K. Ikeda, Y. Miyata, T. Yoshihara, N. Takata and H. Nakashima:J. JILM64(2014) 353360.
11) S. Iwamura and Y. Miura:Acta Mater.52(2004) 591600.
12) A.F. Norman, P.B. Prangnell and R.S. McEwen:Acta Mater.46(1998) 57155732.
13) C.B. Fuller, A.R. Krause, D.C. Dunand and D.N. Seidman:Mater. Sci. Eng. A338(2002) 816.
14) K. Ikeda, R. Akiyoshi, T. Takashita, M. Mitsuhara, S. Hata, H. Nakashima, K. Yamada and K. Kaneko: Proc. of 13th International Conference on Aluminum Alloys (ICAA13), (2012) pp. 11811185. 15) M.J. Jones and F.J. Humphreys:Acta Mater.51(2003) 21492159.
16) W.T. Read and W. Shockley:Phys. Rev.78(1950) 275289.
17) W.T. Read:Dislocation in Crystals, (McGraw Hill, 1953).
18) F.J. Humphreys and M. Hatherly: Recrystallization and Related Annealing PhenomenaSecond Edition, (Elsevier, 2004).