Munich Personal RePEc Archive
Large-cap versus small-cap, a downside
risk comparison
Suarez, Ronny
6 April 2016
Online at https://mpra.ub.uni-muenchen.de/70547/
1
Large-cap versus small-cap, a downside risk
comparison
Working Paper
Ronny Suárez Araya
Email: [email protected]
____________________________________________________________
In this paper we estimated for the period 1990 - 2015, Sortino Ratio and
Return Level using a Generalized Pareto Distribution to evaluate downside
risk of large-cap companies, approach through S&P 500 Index, and
small-cap companies, approach through Russell 2000 Index. Small-small-cap depicted
higher downside risk than large-cap.
____________________________________________________________
2 I. Market Capitalization
Market capitalization is the market value of outstanding shares of a traded company, it’s calculated multiplying total number of outstanding shares by the company’s stock price per share.
Traded companies are usually grouped in different market capitalization
categories. Threshold values of each categories is a relative and subjective
amount that differ from source, have to be adjusted over time, and change
by country, too.
According to Investopedia.com US Large-Cap have a market value higher
than US$10 billion, and US Small-Cap have a market value less than US$2
billion.1
The S&P 500 Index is an appropriate benchmark for large-cap portfolios, and
the Russell 2000 Index is an appropriate benchmark for small-cap ones
(Hayes, 2015).
3
II. S&P 500 Index and Russell 2000 Index
We estimated monthly returns of S&P 500 Index and Russel 2000 Index from
January 2th, 1990 to December 1th, 2015, downloaded from Yahoo Finance,
for a total 332 observations per index.
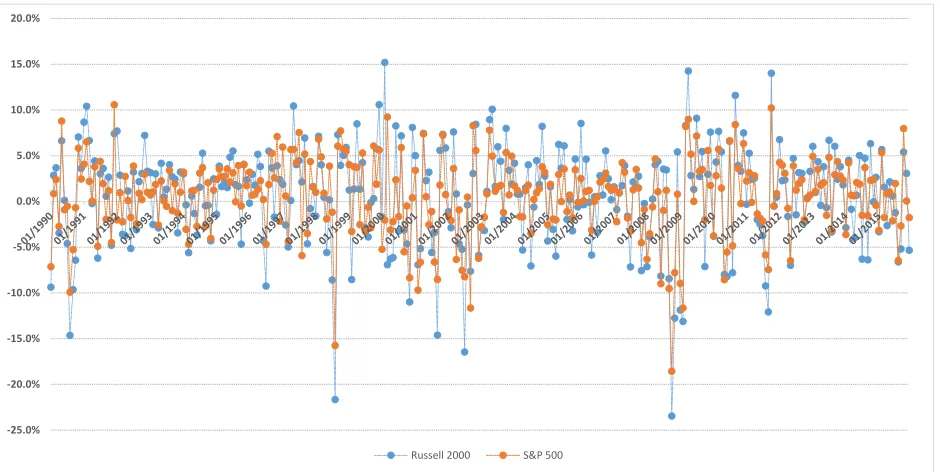
Figure I presents S&P 500 Index and Russell 2000 Index monthly returns
from 1990 to 2015.
Fig. I. S&P 500 Index and Russell 2000 Index Monthly Returns
Next table summarized main statistical data:
-25.0% -20.0% -15.0% -10.0% -5.0% 0.0% 5.0% 10.0% 15.0% 20.0%
Russell 2000 S&P 500
Period Obs. Mean Std. Dev. Mean Std. Dev.
1990-2015 312 0.6120% 0.0556 0.5625% 0.0424
[image:4.612.73.543.284.520.2]4
During the time period analyzed, the average monthly returns and the
standard deviation of Russell 2000 Index was higher than the average
monthly returns and the standard deviation of S&P 500 Index.
Generally, small-cap companies have registered higher returns and higher
volatility than large-cap companies.
For a robust analysis of small-cap outperformance large-cap see Davenport
& Meissner, (2014).
Small-cap stocks are potentially riskier than large-cap stocks due to lower
liquidity, less access to capital, a lack of operational history, and fewer public
information available (Maverick, 2015).
III. Downside Risk
Downside risk is the possibility of losses, a decline in value, of an investment.
In this section, we evaluated the Sortino Ratio and the Return Level at the
Russell 2000 Index monthly returns and the S&P 500 Index monthly returns
5 III.1. Sortino Ratio
The Sortino Ratio, SR is defined as:
SR = X - T
where X is the average of monthly returns, T is the target monthly return
defined at 0% for our case, Xi is the monthly return, and N is the number of
observations.
The higher the impact of the presence of negatives monthly returns (Xi<0),
the lower the Sortino Ratio.
In addition, see Rollinger and Hoffamn (2013) for a basic example calculation
of Sortino Ratio.
Next table summarized Sortino Ratio calculated:
During the time period analyzed, the Sortino Ratio value of S&P 500 Index
monthly return was higher than the Sortino Ratio value of Russell 2000 Index
monthly returns.
Russell 2000 S&P 500
Period SR SR
6 III.2. Return Level
The return level 𝑅𝑘𝑛 is the level expected, on average, to be exceeded in one
out of k periods of length n.
The return period is the amount of time expected to wait for particular return
level to be exceed; return period is the inverse of the probability of an event (e.g. a called “100 years event” has a 1% (1/100) probability of exceed the record level in a given year).
For a Generalized Pareto Distribution, the k year return level is defined:
𝑅𝑘 ≈ µ + 𝜎̃
𝜉̃ ([k*ny*Pr(X>µ)]ξ –1) for ξ̃≠0
where µ is the defined threshold, σ̃, and ξ̃ are the parameters of the
Generalized Pareto Distribution, ny is the number of observations per year,
and Pr (X>µ) is equal to number of exceedances of threshold (Nu) divided
by total number of observations (N).
Using the in2extRemes Toolkit developed by Eric Gilleland and Richard
Katz, within statistical software R, we conducted the estimation of the
7
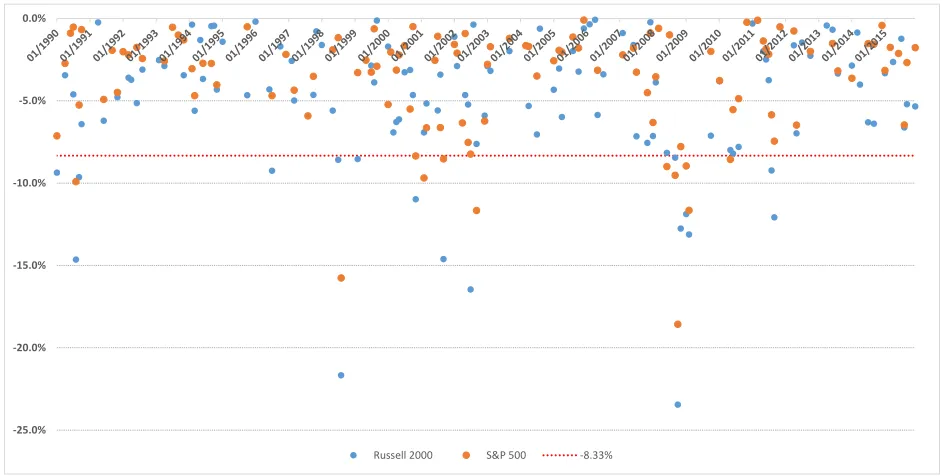
A threshold of a negative returns of 8.33%2 was selected for the estimation
of the Generalized Pareto Distributions.
Figure II depicts Russell 2000 and S&P 500 Index negatives monthly returns
from 1990 to 2015.
Fig. II. S&P 500 Index and Russell 2000 Index Monthly Negative Returns
For the period 1990 – 2015, the Russell 2000 Index recorded a total of 121
cases of negatives monthly returns, a maximum negative monthly return of
23.5%, and 17 cases of negative returns over -8.33%.
2 Usually, average log monthly returns are transformed to annually returns multiplying
it by 12, therefore a -8.33% monthly returns was selected to represent a 100% annual potential loss.
-25.0% -20.0% -15.0% -10.0% -5.0% 0.0%
[image:8.612.70.541.215.453.2]8
Russell 2000 Index monthly returns for that period give a Generalized Pareto
Distribution with parameters (µ): 8.33, (σ): 4.23190 and (ξ): 0.01535
For the period 1990 – 2015, the S&P 500 Index recorded a total of 115 cases
of negatives monthly returns, a maximum negative monthly return of 18.6%,
and 12 cases of negative returns over -8.33%.
S&P 500 Index monthly returns for that period give a Generalized Pareto
Distribution with parameters (µ): 8.33, (σ): 1.53381 and (ξ): 0.44631
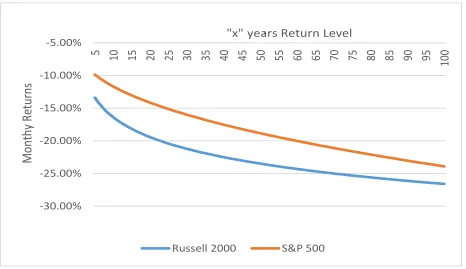
Figure III illustrates S&P 500 Index and Russell 2000 Index negative monthly
returns at different returns levels.
Fig. II. S&P 500 Index and Russell 2000 Index Return Levels -30.00% -25.00% -20.00% -15.00% -10.00% -5.00%
5 10 15 20 25 30 35 40 45 50 55 60 65 70 75 80 85 90 95
100 Mo n th y Re tu rn s
"x" years Return Level.
[image:9.612.72.538.385.654.2]9
Given any return level, the Russell 2000 Index monthly negative return is
higher than the S&P 500 Index monthly negative return, for example at the
25 years return level, the R25 Russell 2000 Index is -20.41% against R25 S&P
500 Index of -15.13%. Or, in other words, given a negative monthly return
value, the probability of exceed it in any given year is higher in the Russell
2000 Index than the S&P 500 Index, for example at -20.0%, there is a 4.34%
chance of exceeded (R23) in the Russell 2000 Index compared to a 1.66%
chance of exceed (R60) in the S&P 500 Index.
IV. CONCLUSION
Through the analysis of the Sortino Ratio and the Return Level values, we
can concluded that for the period 1990-2015, small-cap showed higher
downside risk than large-cap.
Future lines of research could apply estimation of return level using extreme
value theory to others time periods, stocks, portfolio analysis, or markets like
10
REFERENCES
Davenport, J. & Meissner, F. (2014). Exploiting the Relative Outperformance
of Small-Caps Stocks. AAII Journal, January, 2014.
http://www.aaii.com/journal/article/exploiting-the-relative-outperformance-of-small-cap-stocks.touch
Hayers, A. (2015). How the S&P 500 and Russell 2000 Indexes Differ.
Investopedia, January 22, 2015.
http://www.investopedia.com/articles/investing/012215/how-sp-500-and-russell-2000-indexes-differ.asp
Maverick, J. B. (2015). How do the risks of large cap stocks differ from the
risks of small cap stocks. Investopedia, March 26, 2015.
http://www.investopedia.com/ask/answers/032615/how-do-risks-large-cap-stocks-differ-risks-small-cap-stocks.asp
Rollinger, T. N. & Hoffman, S. T. (2013). Sortino: A ‘Sharper’ Ratio”. Red
Rock Capital.