Munich Personal RePEc Archive
Managing the diversity: board age
diversity, directors’ personal values, and
bank performance
Talavera, Oleksandr and Yin, Shuxing and Zhang, Mao
University of Sheffield, University of Sheffield, University of Sheffield
2016
Online at
https://mpra.ub.uni-muenchen.de/71927/
0
Managing the diversity: board age diversity, directors’
personal values, and bank performance
Oleksandr Talavera, Shuxing Yin, and Mao Zhang1
Management School, University of Sheffield
Abstract
This study examines the role of board age diversity on bank performance. Using a sample of 97 Chinese banks, we document a negative and significant relationship between age diversity and bank performance. To further investigate the negative link between age diversity and bank performance, we decompose age diversity into personal value diversities. In particular, a variety of directors’ views with respect to work, prudence, and wealth harm bank performance. This indicates that age diversity among directors can affect bank performance via their values.
JEL codes: G21, G30, J10
Keywords: corporate governance, board of directors, age diversity, value diversity, bank performance
1 Corresponding author.
1
1. Introduction
The functions of the board of directors are generally believed to include
monitoring and controlling management, providing advice and counseling, and setting
strategies for the company (e.g., Mace, 1971; Lorsch and MacIver, 1989; Demb and
Neubauer, 1992; Monks and Minow, 2004). The composition of the board influences
the way in which it performs these functions, which ultimately affects firm performance.
Despite the strong intuitive belief for a positive role of board diversity in the corporate
world2, the theoretical framework, which is traditionally underpinned by the resource
dependency theory (Pfeffer and Salancik, 1978), agency theory (Jensen and Meckling,
1976) and social psychology theories (Byrne, 1971; Williams and O’Reilly, 1996), does
not give a clear prediction. A more diverse board matches the diversity of a company
to the diversity of its customers and suppliers, being more creative and independent.
However, heterogeneity could lead to more conflicts (Cox and Blake, 1991; Robinson
and Dechant, 1997) and does not necessarily result in more effective monitoring (Cater
et al. 2003).
Board diversity is one of the most significant governance issues currently faced
by modern corporations (Milliken and Martins, 1996) and has become increasingly
2 See for example, “Boards drive higher and more sustainable investment returns if they benefit from
fresh perspectives, new ideas, vigorous challenge and broad experience.” -- Euan Munro, the Chief Executive of Aviva Investors.
2
important to policy makers interested in good governance. Compared with other
attributes of directors, such as gender and ethnicity3, age, a key diversity dimension, so
far has attracted little attention in the finance literature. When profiling an individual,
age offers more than descriptive statistics. It is a dynamic proxy of an individual’s life
experience, indicating multifarious characteristics (Mannheim, 1949). During the life
span, aging encompasses a wide range of factors that shape the formation of their
personal values (Medawar, 1952; Rhodes, 1983). In a shared context marked by the
same social and cultural environments, a cohort of individuals at similar ages is more
likely to share commonalities in their attitudes and values (Byrne, 1971; Zenger and
Lawrence, 1989).
Age is also a major feature of the social context in which organizational
members interact within groups (Ferris et al., 1991). In relation to corporate boards,
younger directors tend to behave differently from older directors with respect to
different values. Younger directors appear to be more energetic and have greater risk
appetites, while older ones are likely to be more conservative with a steady personality
(Mishra and Jhunjhunwala, 2013). A small body of literature has shown mixed
economic consequences of board age diversity. There is some evidence that age-diverse
boards lead to improved firm financial performance (Ararat et al., 2010; Kim and Lim,
2010; Mahadeo et al., 2012) by providing comprehensive resources to the board,
3 Increasing attention has been recognized to board diversities by gender (Erhardt et al., 2003; Huang
3
enhancing the pipeline of expertise, and improving the quality of boardroom
decision-making. However, age-diverse boards are also found to harm firm social performance
(Hafsi and Turgut, 2013), profitability (Ali et al., 2014), and strategic change (Tarus
and Aime, 2014) due to the communication breakdown and conflicts among directors.
Age diversity is particularly important in transition countries that have
experienced significant economic development and political transformation over a
relatively short period. Along with the transition of economic system, there is
simultaneously a push toward its cultural change (Stulz and Williamson, 2003). Thus,
people in different generations in transition countries are likely to share thoroughly
different life experience and hold diverse values.
During the last few decades, China has been experiencing an immense
transformation in economy, politics, and culture. Our sample shows that a large
proportion of directors in Chinese firms are aged from 35 to 70 and have grown up in
Mao Zedong’s or Deng Xiaoping’s era4. Under Chairman Mao’s socialist orthodoxy,
the Chinese government launched an initiative of collectivization, emphasizing the conformity to a group and discouraging individuals from standing out (Ralston et al., 1999). Thus, generation born in Mao’s time is more likely to be less educated and is dedicated to a single and conventional way of doing things, sacrificing creativity. In
4In 1949, Chinese Civil War ended with Mao Zedong’s Communist Party in power. Mao’s era covers
4
1978, Deng Xiaoping launched some modern policies which have encouraged individual achievement, materialism, entrepreneurship and economic efficiency (Tian, 1998), shifting China from a planned economy to a market-based one (Egri and Ralston, 2004). The “open-door” policy introduced western capitalistic ideology into Chinese business (Vohra, 2000), with rapid industrialization and modernization resulting unprecedented prosperity. The decision to resume China’s National College Entrance Test encouraged younger people to pursue higher education (Huang et al., 2016). As
Ralston et al. (1999) and Huang et al. (2016) suggest, the generation born during Deng’s era is likely to be better educated, more qualified, confident, and individualistic, emphasizing innovation and creativity. As people grew up in each distinctive cultural environment, previous studies show that, in China, there are significant differences in values between age cohorts (Sun and Wang, 2010).
The banking sector has been under great scrutiny since the financial crisis in
2007.Banking holds a unique role in a nation’s economy, and poor bank governance is
more likely to trigger bank failure, leading to serious systemic risk and negative
externalities (Pathan, 2009; Pathan and Faff, 2013; García-Meca et al., 2015).
Accordingly, the Basel Committee on Banking Supervision (2014) points out that the
bank board should be composed of diverse directors to reflect its complexity and risk
profile.
To study the link between board age diversity and bank performance, we
5
document a negative relationship between age diversity in the boardroom and bank
performance with return on assets (ROA) and return on equity (ROE), showing that the
costs of age diversity outweigh the benefits on bank performance in China. As age
difference is likely to lead to variation in personal values (Egri and Ralston, 2004; Sun
and Wang, 2010), we further decompose age diversity by value diversity. We find that
the heterogeneity of directors’ value on work, prudence, and wealth reduce banks’
profitability. This negative relation indicates that age diversity could negatively affect
bank performance via directors’ different values.
Our study contributes to the existing literature in a number of ways. First, our
work offers a new perspective on the impact of age heterogeneity on firm performance.
Earlier literature focuses on the direct relationship between age diversity among
directors and organizational outcomes (Ararat et al., 2010; Mahadeo et al., 2012; Hafsi
and Turgut, 2013; Tarus and Aime, 2014; Ali et al., 2014) or estimates the role of age
difference between chairman and CEO (Goergen et al., 2015). Differently from them,
we take a step further to estimate why age diversity can affect bank performance by
introducing directors’ personal values, an unobservable dimension of heterogeneity. We
decompose directors’ age diversity into value diversity and investigate whether the
heterogeneity of directors’ ages could affect bank performance via their personal values.
Secondly, to the best of our knowledge, this is the first study to statistically
show age-value changes. In general, previous studies always provide propositions that
6
eight specific personal value indicators from the World Values Survey and estimate the
changes of these values across age cohorts. The results prove that individuals’ personal
values with respect to risk, work, prudence, and wealth vary widely across different
ages, while values (namely, success, thoroughness, creativity, and helping others)
change only slightly across age cohorts.
Thirdly, with the existing work mostly limited to non-financial firms, our work
extends board age diversity to the banking sector. Facing greater liquidity problems
with high leverage and severe information asymmetry, directors in banks are different
from non-bank directors as they are accountable to not only shareholders but also
depositors and regulators (Levine, 2004; García-Meca et al., 2015). This requires the
boards to be equipped with more specialized skills and wider knowledge (Nguyen et
al., 2015). Having the right board composition is crucial for the success of a bank.
Lastly, we provide the first empirical study on board age (value) diversity and
bank performance in China. The existing literature on China mainly concentrates on
gender diversity (Liu et al., 2014; Cumming et al., 2015). Regarding the Chinese
banking sector, existing studies mainly focus on ownership structure rather than board
characteristics. The only work related to bank board characteristics is Liang et al. (2013)
who find that independent directors are beneficial to bank performance, while
political-connected directors are negatively associated with bank profitability.
We believe that findings from this study are not only relevant for China but also
7
cultural systems, directors from different generations are more likely to hold
heterogeneous values. Hence, there is a growing need to manage the generational gaps
between directors and have a better understanding of optimal board composition that
can influence firm performance.
The rest of the paper is organized as follows. Section 2 presents a critical review
of literature on board age diversity and firm performance. Section 3 describes the data
collection and methodology. Section 4 provides the empirical analysis. Finally, Section
5 provides the summary and the conclusion.
2. Literature review and hypothesis development
2.1 Board age diversity and performance
Grounded in resource dependency theory, the board is regarded as the provider
of advice and counsel, legitimacy, and communication channels (Pfeffer and Salancik,
1978). A diverse board can enhance the firm’s performance by providing
comprehensive and valuable resources to the board, improving information quality and
creating a balanced board (Wiersema and Bantel, 1992; Carter et al., 2010).
Furthermore, a more age-diverse board facilitates the bank to meet the need of different
customers and penetrate deep into the market (Mishra and Jhunjhunwala, 2013).
Based on agency theory, the board of directors is an important internal
mechanism to mitigate conflicts between shareholders and managers (Fama and Jensen,
8
independence as diversity can bring more ultimate outsiders into boards and enhance
mutual monitoring (Kandel and Lazear, 1992; Wiersema and Bantel, 1992; Cater et al.,
2003). However, some studies such as Carter et al. (2003) argue that board diversity
may not lead to more effective monitoring since diverse board members may be
marginalized.
Empirically, Ararat et al. (2010) find that a diversified representation of
different generations in boards enhances the flexibility of the decision-making by
balancing risks and ultimately leads to better firm performance in Turkey. Kim and Lim
(2010) prove that age diversity in independent directors can increase firms’ values due
to directors’ comprehensive human capital. Mahadeo et al. (2012) also suggest that a
mixed-age board is beneficial to firm performance in Mauritius.
By contrast, board age diversity may come at a cost and hamper firms’
performance. On the basis of the “similarity-attraction paradigm” (i.e., the similarity in
directors’ attributes facilitates group thinking), individuals perceive other people who
are demographically different from them as “outsiders” who are holding different
values. They tend to be reluctant to share information with “outside” individuals and
providing thoroughly different opinions, leading to interpersonal attraction breakdown
(Adams et al., 2010; Estélyi and Nisar, 2016). When it comes to the boards, different
perspectives and cognitive abilities in the board may generate conflicts among different
groups of directors (Byrne, 1971; Williams and O’Reilly 1996). Such conflicts are
9
communication, protract decision-making processes, and weaken firm performance
(Westphal and Bednar, 2005; Wang and Hsu, 2013).
Tarus and Aime (2014) provide evidence that age diversity on the board
negatively affects corporate strategic change since the old and the young have conflicts
in decision-making. Ali et al. (2014) show that the level of board age diversity falls
with the increase in firm profitability, which supports the argument of Hafsi and Turgut
(2013) that age diversity in the boardroom negatively affects corporate social
performance. Therefore, the above discussions suggest that board age diversity is a
“double-edged-sword”.
2.2 Age and personal values
As a demographic attribute, age is different from gender, ethnicity, and other
facets that make each of us unique as individuals. An individual’s age conveys
information about his preference and lifestyle as culture is transmitted across
generations. During the life span, ageing effects involve a wide range of factors
influencing the development of personal values, such as risk-taking behavior,
decision-making, and attitudes to work (Medawar, 1952; Child, 1974; Rhodes, 1983; Ferris et
al., 1991; Sun and Wang, 2010; Serfling, 2014).
At the group level, individuals of similar age prefer to interact with those whom
they perceive to be similar to them. This can be explained by the “similarity-attraction
paradigm”, where individuals born at similar times are more likely to develop similar
10
turn foster interpersonal attraction, group thinking, and cooperation (Byrne, 1971;
Zenger and Lawrence, 1989; Kunze et al., 2011; Goergen et al., 2015).
In the psychology literature, the socialization hypothesis proposes that the
values of each generation change in accordance with the prevailing condition during
their formative years (Inglehart, 2008). Rokeach (1973, p.25) argues that “personal
value is an enduring prescriptive and proscriptive belief that a specific mode of
behavior is preferred to an opposite mode behavior – this belief transcends attitudes
towards objects and situations”. It has been a tradition to explore the value changes
between generations since age difference is likely to lead to variation in personal values
(Bantel and Jackson, 1989; Egri and Ralston, 2004; Sun and Wang, 2010). In turn, the
difference in values can also cause a generation gap between young and old (Prasad,
1992). Thus, age might be one of the predictors of value. Furthermore, previous studies
generally agree that individuals’ values are entrenched since their late-teens (Ralston et
al., 1999). Consistent with this, Ghitza and Gelman (2014) find that social events
between the ages of 18 to 24 are far more influential than those that occur at an older
age.
2.3 Board value diversity and performance
Personal values are vital to management decisions and corporate actions
(Marcus et al., 2015). Certain values such as creativity, loyalty, hard work and sense of
responsibility are desirable for the board.
11
executives across age cohorts. Younger executives appear to be more creative with
greater risk appetite and are able to bring better cognitive resources to decision-making
tasks (Bantel and Jackson, 1989; Mishra and Jhunjhunwala, 2013). Young managers
are found to have a higher probability to challenge the existing system of company rules
and make risky decisions (Child, 1974; Hambrick and Mason, 1984; Cheng et al., 2010)
to signal to the market that they possess superior abilities (Prendergast and Stole, 1996).
Older executives tend to be more cautious and conservative (Bantel and Jackson, 1989),
more capable in dealing with external agencies such as regulators and authorities
(Grove et al. 2011).
Assessing values and the value difference across different generations
constitutes a basic approach to understand the generational gap. So far, no study has
examined why age-diverse boards influence performance. We decompose directors’ age
into their personal values and argue that board age diversity may affect bank
performance via directors’ value diversity. In the absence of empirical evidence on
directors’ personal values and firm performance, Jehn et al. (1999) provide some
theoretical explanations that personal value diversity in the workforce leads to conflicts
as the dissimilarity protracts the interaction in the group. In our study, we expect that
12
3. Data and methodology
3.1 Data and sample selection
We build a sample with information on directors’ characteristics, ownership
structure, and financial statements for 97 Chinese banks during the period 2009-2013.
We start with the universe of 190 Chinese banks available on Bankscope. We focus on
commercial banks, cooperative banks, and savings banks. To allow hand-collection of
data on the board and ownership structure, we exclude banks that fail to have at least
one annual report during the study period. Finally, we focus on banks that disclose
directors’ demographic characteristics, especially age, in their annual reports. The
filtering procedure results in a final sample of 97 banks, which represent about three
quarters of the total assets of Chinese banking institutions at the end of 2013 (China
Banking Regulatory Commission, 2014).
Bank-specific financial information is mainly extracted from Bankscope. We
replace the missing values and questionable values in Bankscope by hand-collected
data from each individual bank’s annual report. Most of the banks in our sample follow
the local GAAP Chinese Accounting Standards (CAS), while the listed commercial
banks5 employ the International Financial Reporting Standards (IFRS). The CAS was
developed recently following the principle of IFRS, and there is no material difference
between the financial statements of the same bank under IFRS and CAS (Berger et al.,
13
2009; Liang et al., 2013). Additionally, the data for the economic indicator (i.e., GDP
per capita) are extracted from China City Statistical Yearbook published by China
Statistics Press.
To predict directors’ values, we employ the World Values Survey Sixth Wave, a
cross-country project containing information about demographics (age, gender, and
education), self-reported economic information (income and social class), and answers
to specific questions on fifteen categories of values on the economy, work ethics,
religions, democracy, and other attitudes. The China Survey was conducted in 2012 and
measures values and attitudes held by Chinese citizens. The respondents are aged from
18 to 75 and they reside in all provinces of China. We employ World Values Survey
China (2012)6 to predict the values of Chinese directors.
Among the 6,195 directors who served on the board of sample banks, we have
177 (around 2%) foreign directors from 13 other countries/regions. To predict foreign
directors’ values, we also download the respective 13 foreign countries/regions’ World
Values Surveys, including the United Kingdom, the United States, the Switzerland,
Spain, the Netherlands, Taiwan, Singapore, Germany, Australia, France, Hong Kong,
and Italy. From the World Value Survey, we extract work-related value indicators.
6 The World Values Survey has six waves, each wave with five-year period. In each wave, there is only
14
3.2 Model specifications and descriptive statistics
To examine the impacts of board age diversity on bank performance, we employ
the following main model (1) specified:
𝐵𝑎𝑛𝑘_𝑝𝑒𝑟𝑓𝑜𝑟𝑚𝑎𝑛𝑐𝑒𝑖,𝑡 = α + 𝛽𝐵𝑜𝑎𝑟𝑑_𝑎𝑔𝑒_𝑑𝑖𝑣𝑒𝑟𝑠𝑖𝑡𝑦𝑖,𝑡−1 + 𝛾𝐶𝑜𝑛𝑡𝑟𝑜𝑙_𝑣𝑎𝑟𝑖𝑎𝑏𝑙𝑒𝑠𝑖,𝑡−1 +
𝜃𝑡 + 𝜇𝑖 + 𝜀𝑖,𝑡 (1)
Where 𝑖 is the bank identifier and t is the year. The key coefficient of interest 𝛽
captures the impact of board age diversity on bank performance. 𝜇 is an
individual-specific effect, which varies across banks, and 𝜀 denotes to the error term, which varies
both among banks and periods of time. Model (1) is estimated by a fixed-effects
estimator, which is justified using the Hausman Test. The reported standard errors are
adjusted for potential heteroscedasticity.
𝐵𝑎𝑛𝑘_𝑝𝑒𝑟𝑓𝑜𝑟𝑚𝑎𝑛𝑐𝑒 is measured by both profitability and risks. As for bank
profitability, return on assets (ROA) is net income over total assets, which shows how
efficiently the bank produces profit by the given assets. Return on equity (ROE) is
calculated as net income divided by total equity, assessing the return on shareholders’
investment. In terms of risk, the Z-score, defined as return on assets plus the equity to
assets ratio divided by the standard deviation of return on assets, is the inverse of the
probability that bank losses surmount bank capital7 and measures the distance to default
(Laeven and Levine, 2009; Dong et al., 2014). Thus, a higher Z-score indicates lower
15
risk in the bank. Since scores are highly skewed, we take the natural log of the
Z-score (Z-score) in further analysis. We also use non-performing loan ratio (NPLratio),
calculated as non-performing loans to total loans, as an alternative risk measure.
<Insert Table 1 about here>
Panel A of Table 1 reports the descriptive statistics for the bank performance
measures. During the sample period, the average ROA and ROE are 0.01 and 0.19,
which is comparable to 0.01 and 0.14 given in Liang et al. (2013) who study a sample
of 52 Chinese banks during the period from 2003 to 2010. The average Z-score value
is 3.87. On average, NPLratio is 0.01, which is smaller compared to 0.0262 given in
Dong et al. (2014) for a sample of Chinese commercial banks during 2003-2011.
𝐵𝑜𝑎𝑟𝑑_𝑎𝑔𝑒_𝑑𝑖𝑣𝑒𝑟𝑠𝑖𝑡𝑦is measured by the coefficient of variation of age (CV)
calculated by the ratio of the standard deviation of board age to mean of board age.8
<Insert Figure 1 about here>
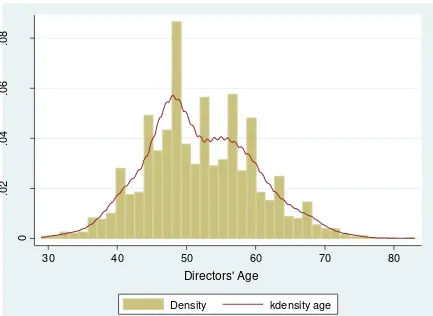
Figure 1 and Panel B of Table 1 show substantial board age diversity in Chinese
banks. The average age of board directors in Chinese banks is 51.95, and the standard
deviation is high at 7.99. The youngest is 29 years old, while the oldest is 83. The
average coefficient of variation of board age (CV) is 0.14. The majority of directors on
Chinese boards appear to be in their forties (39%) and fifties (39%).
8 Alternative measures of age diversity are the Blau Index (Blau) and standard deviation of board age
16
𝐶𝑜𝑛𝑡𝑟𝑜𝑙_𝑣𝑎𝑟𝑖𝑎𝑏𝑙𝑒𝑠 includes four categories. First, three variables on board
characteristics include the natural logarithm of board size (Board Size), which is found
to have a significant effect on bank performance (Staikouras et al., 2007; Adams and
Mehran, 2012), the percentage of independent directors (Independent Director) who
may have strong incentives to scrutinize the management (Erkens et al., 2012; Adam
and Mehran, 2012), and a dummy variable (Duality), which equals one if the chief
executive officer (CEO) is also the chairman.
Second, the ownership variables control for both the type and level of the
ownership structure (Liang et al., 2013). We include the proportion of shares owned by
the largest shareholder if the largest shareholder is the government or state-owned
enterprises (State), a foreign investor (Foreign), and a private investor (Private).
Some additional variables to capture bank-specific characteristics (Berger et al.,
2009; Lin and Zhang, 2009; Liang et al., 2013; Dong et al., 2014; García-Meca et al.,
2015) are also included. Bank size is measured by the natural logarithm of total assets
(Size). The capital ratio is measured as total equity to total assets (Capital Ratio),
reflecting the bank capitalization. We also calculate the loan ratio by total loans to total
assets (Loan Ratio), which is related to the banks’ credit. A dummy variable for listed
banks (Listed) equals one if the bank is listed. We also include the natural logarithm of
the number of years since the bank has been established (Bank Age) as banks with a
long history tend to have a more mature operation system that is related to better
17
Lastly, to account for the potential regional effects on bank performance, we
follow previous studies (Ferri, 2009; Zhang et al., 2012; Qian et al., 2015) and employ
the natural logarithm of GDP per capita for the city (City GDP) where the bank’s
headquarters are located. To control for macroeconomic shocks, all of our regressions
contain a full set of year dummies.
Panel D of Table 1 reports the summary statistics for the control variables. The
average board size in Chinese banks is 13.77, which is comparable to that of 12.68 in
the US (Pathan and Faff, 2013) and 12.79 in nine developed countries9 (García-Meca
et al., 2015). On average, 25% of directors in Chinese banks are independent directors.
In our sample, only 3% of CEOs in Chinese banks have the duality position. In the
ongoing process of privatization, only about 18% (18) of the sample banks are listed on
the stock exchange. On average, in our sample, around 24% of shares are owned by the
largest shareholder if the largest shareholder is the government or state-owned
enterprise.
In order to explore the reasons why board age diversity affects bank
performance, we introduce directors’ personal values. As discussed before, directors’
values are not directly observable but are assumed to be framed by their ages. To obtain
the impact of value diversity on bank performance, we take three steps. In the first stage,
we extract 17 value indicators which are related with work and business from China
9 Nine developed countries include Canada, France, Germany, Italy, the Netherlands, Spain, Sweden,
18
Values Survey (2012), namely, risk, work, happiness, prudence, wealth, success,
thoroughness, pressure, outgoing, active, creativity, helping others, finding faults,
reserved, life satisfaction, slackness, tension10 . Then we apply a logit model (2) to
predict the parameters based on China Values Survey (2012). To create the dependent
variable, following Ahern et al. (2015), we rescale the responses to each question (each
value indicator) into a binary variable, taking values of zero or one (See Appendix A).
For example, for a value on risk taking, we assess whether taking risk is important to
the person by scaling answers “Very Important” and “Rather Important” as one and
“Not very important” and “Not at all important” as zero.
The following logit model is used to predict each director’s values:
Pr(𝑣𝑎𝑙𝑢𝑒𝑖𝑗 = 1) = 𝐹 (𝛽0 + 𝛽1𝑎𝑔𝑒𝑗 +𝛽2𝑒𝑑𝑢𝑐𝑎𝑡𝑖𝑜𝑛𝑗 + 𝛽3𝑔𝑒𝑛𝑑𝑒𝑟𝑗 +𝛽4𝑖𝑛𝑐𝑜𝑚𝑒𝑗 + 𝛽5𝑠𝑜𝑐𝑖𝑎𝑙 𝑐𝑙𝑎𝑠𝑠𝑗
+𝛽6𝑠𝑢𝑝𝑒𝑟𝑣𝑖𝑠𝑜𝑟𝑦 𝑠𝑡𝑎𝑡𝑢𝑠𝑗 + 𝛽7𝑒𝑚𝑝𝑙𝑜𝑦𝑚𝑒𝑛𝑡 +𝜀) (2)
𝐹 is the cumulative standard logistic distribution. 𝑣𝑎𝑙𝑢𝑒𝑖𝑗 equals one if the
respondent 𝑗 ’s response to the question (value indicator 𝑗 ) is recorded as one. 𝜀
denotes the random error, and the values are all measured by the probability of holding
this value. Independent variables in Model (2) include available key demographic and
socio-economic variables taken from the background information provided in the
10 World Values Survey measures support for democracy tolerance of foreigners and ethnic minorities,
19
survey. Age is given in years. Except for Age, Education, Income and Social Class are
specified as categorical variables. Education is divided into three groups: university
(university or higher), second school (specialized secondary or vocational technical
school), and primary school (primary school or less). Income is consolidated from nine
into three categories: high, middle, and low. Social Class is assessed in four categories:
lower class, working class, middle class,and upper class. Gender is indicated with a
zero for female and a one for male. Supervisory Status equals one if he/she is
supervising other people at work and 0 otherwise. Employment is denoted as one for
those in employment and zero otherwise. After we estimate parameters for each value
indicator, we can identify the value indicators that are significantly affected by age
shown by 𝛽1 in model (2) and keep them for later analysis. After this step, we keep
only eight out of seventeen value indicators, namely, risk, work, prudence, wealth,
success, thoroughness, creativity, and helping others (see Panel B of Appendix B).
In the second stage, we predict directors’ personal values on these eight value
indicators in our sample, inputting directors’ information including age, education level,
gender, income level, social class, and supervisory status into model (2) using the
parameters predicted in the first step. Apart from age, education level, gender and
supervisory status, we assume that all the bank directors in our sample have the same
income level11, and the same social class. Since some foreign directors have stayed in
11In the World Values Survey, individuals’ income level is scaled across nine levels (1-9). We rescale
20
China for a long time, they are likely to be influenced by Chinese culture and lifestyle.
These foreign directors’ values are affected not only by their own country but also by
China. Thus, we calculate foreign directors’ values based on the China survey and their
own country survey with equal weights.
In the third stage, we employ the following model, which is similar to model
(1), to examine the impacts of these value diversities on bank performance:
𝐵𝑎𝑛𝑘_𝑝𝑒𝑟𝑓𝑜𝑟𝑚𝑎𝑛𝑐𝑒𝑖,𝑡 = α + 𝛽 𝐵𝑜𝑎𝑟𝑑_𝑣𝑎𝑙𝑢𝑒_𝑑𝑖𝑣𝑒𝑟𝑠𝑖𝑡𝑦𝑖,𝑡−1 + 𝛾 𝐶𝑜𝑛𝑡𝑟𝑜𝑙_𝑣𝑎𝑟𝑖𝑎𝑏𝑙𝑒𝑠𝑖,𝑡−1 +
𝜃𝑡 + 𝜇𝑖 + 𝜀𝑖,𝑡 (3)
𝐵𝑜𝑎𝑟𝑑_𝑣𝑎𝑙𝑢𝑒_𝑑𝑖𝑣𝑒𝑟𝑠𝑖𝑡𝑦includes eight value diversities which are calculated by
the coefficient of variation of each value indicator, respectively. From Panel C of Table
1, we find that values on risk, work, prudence, and wealth have higher coefficients of
variation (0.11, 0.06, 0.06, 0.07, respectively) compared with the rest of the value
indicators. Furthermore, after the estimation, if the 𝛽 in model (3) is in the same sign
(positive or negative) as 𝛽 in model (1), we can conclude that age is one of the strongest
predictors of value, and age diversity can affect bank performance via directors’ values.
4. Empirical results
4.1 Does age diversity affect bank performance?
We first examine whether the age diversity affects bank performance. Table 2
21
columns (1)-(2) and (3)-(4), respectively. Age diversity has a significant and negative
impact on bank profitability. Specifically, a two standard deviation increase in age
diversity (CV) shrinks ROA by 10.4% and ROE by 9.68%, which is comparable with a
strand of existing literature in non-bank samples (Murray, 1989; Ali et al., 2014; Tarus
and Aime, 2014).
This result is in line with the argument that age diversity lessens the cohesion
in the boardroom, leads to barriers such as difficult communication, and generates
conflicts (Williams and O’Reilly 1996; Pelled et al., 1999; Westphal and Bednar, 2005).
Such conflicts can protract the decision-making process and weaken the effectiveness
of the board. When the effects of conflicts in board communication, cooperation, and
decision-making processes outweigh the benefits of providing comprehensive
perspectives and different external information by directors at different ages, the role
of the board as a monitor and advisor will be impeded. As a result, an insufficient board
may subsequently weaken the bank’s profitability. However, in terms of risk
performance, we do not find any significant relationship between age diversity and
bank risk.
<Insert Table 2 about here>
With respect to other board characteristics, Duality has a significantly negative
relationship with ROA (significance at the 10% level) and a strong positive impact on
22
position perform worse. In terms of board independence, the coefficient of Independent
Directors is significantly positive on bank profitability and negative on bank credit risk,
which is consistent with previous studies (Liang et al., 2013; García-Meca et al., 2015).
This relationship suggests that independent directors are beneficial to Chinese banks.
With regard to other bank characteristics, Private ownership harms bank performance
measured by ROA, while the larger Bank Size weakens bank performance by decreasing
ROE and augmenting non-performing loans. We also find that bank Capital Ratio is
negatively related with ROE and positively related with Z-score (at the significance
level of 1% and 5%, respectively), indicating that banks with a higher degree of
capitalization have lower insolvency risk.
4.2 Age and values
Generational gaps are often caused by differences in values (Prasad, 1992). It
appears that there is no consensus about how to define generations in China. Studies
generally reach an agreement each generation comes into existence with a particular
social movement with a shared experience (Sun and Wang, 2010) and that most of an
individual’s values become entrenched in one’s late-teens (Ralston et al., 1999). Based
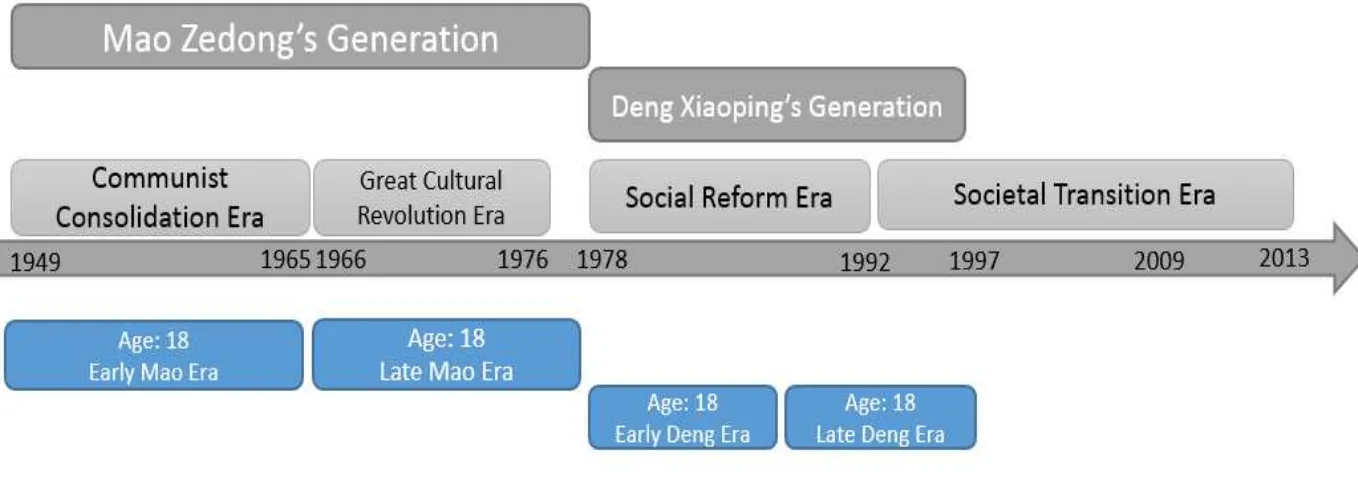
on this framework of value formation, in our work, we define our generation as two
main groups that correspond to specific social and political events at the age of 18:
Mao’s generation (born during 1931-1958) and Deng’s generation (born during
1959-1990) (See Figure 2). According to some specific social events, we further divide Mao
23
Communist Consolidation period and late Mao generation (born during 1948-1958)
who underwent Great Cultural Revolution. Similarly, we decompose Deng generation
into Early Deng generation (born during 1959-1974) who experienced Social Economic
Reform and Late Deng generation (born during 1975-1990) who are in the societal
transition period. (Ralston et al., 1999; Egri and Ralston, 2004; Sun and Wang, 2010)
<Insert Figure 2 about here>
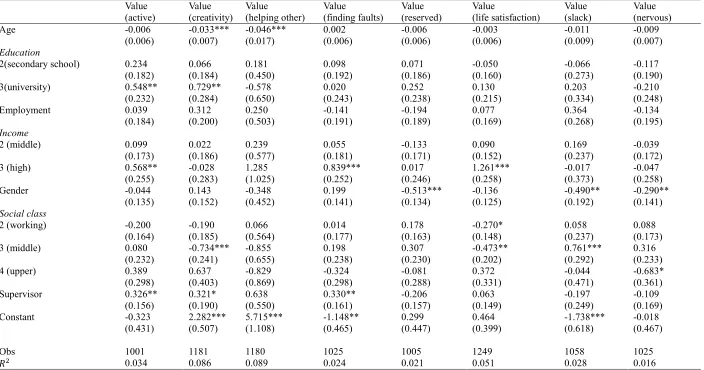
Our value analysis first focuses on 17 values based on the World Values Survey.
Table 3 shows the predicted parameters of different values. Coefficients of eight values
are significantly affected by age, including risk, work, prudence, wealth, success,
thoroughness, creativity, and helping others.
<Insert Table 3 about here>
<Insert Figure 3 about here>
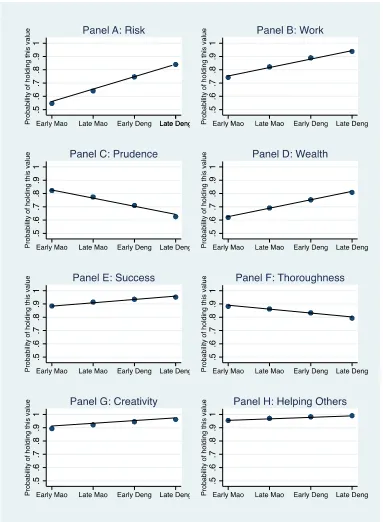
Figure 3 shows the changes of eight personal values (average probability of
holding this value) in the different generations of directors in our sample. In Panel A,
directors from the late Deng generation are shown to have greater risk appetite than
directors in from the early Mao generation. Regarding the value on creativity in Panel
G, directors growing up in Deng’s era are more creative and come up with new ideas,
whereas the ones who grew up in Mao’s era are more coherent in a conventional process
24
views by Ralston et al. (1999) and Sun and Wang (2010).
Panel B of Figure 3 shows that Deng’s generation values work more than the
other generations and devotes great passion into their work. Additionally, the late Deng
generation appreciates wealth more, pursing profit maximization (see Panel D of Figure
3). Consistent with previous studies (Sun and Wang, 2010), younger directors enjoy the feeling of being successful and yearn for achievement recognition.
In terms of work ethics, to behave properly is essential for older directors. Panel
C of figure 3 shows that they are more prudent and cautious than the younger ones.
Furthermore, Panel F shows that directors who are from the early Mao generation insist
on doing a job more thoroughly than the younger ones. However, the massive shifts in
China also pose slight impacts on some dimensions of directors’ values. For example,
there is a relatively small difference in directors’ attitudes to help others nearby across
age cohorts, as shown in Panel H.
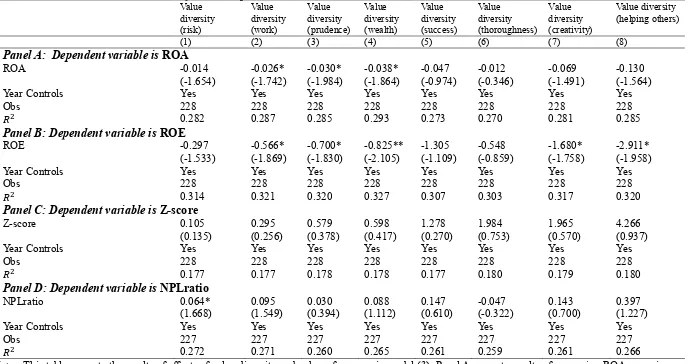
4.3 Why does age diversity affect bank performance?
In order to further investigate the negative relationship between age diversity
and bank performance, we decompose age diversity into value diversity and test
whether diversity in different values influences bank performance. Similar to age
diversity, the results presented in Table 4 show that the heterogeneity of directors’ views
in some cases poses a negative impact on bank performance.
25
The coefficients of directors’ diverse views on work, prudence, and wealth
impose negative impacts on banks’ profitability12 . An increase of two standard
deviations in value diversity on work is associated with a decrease in ROA of 10.4%
and in ROE of 11.92%. With regard to prudence, increases of two standard deviations
exert negative impacts on ROA and ROE of 12% and 14.74%, respectively. Furthermore,
increases of two standard deviations in directors’ value diversity of wealth reduce banks’
ROA by 30.4% and ROE by 34.74%. Additionally, we can observe that the coefficients
of directors’ diverse values on creativity and helping others affect ROE negatively at
the 10% level. These results are consistent with Jehn et al. (1999) who argue that value
diversity can trigger intragroup conflicts in the workforce and cause a negative impact
on group performance.
As shown in Figure 3, directors’ values on work, prudence, wealth, and
creativity change across the different generations. Directors growing up in Deng’s era
are more creative, devote greater passion to their work, and pursue profit maximization.
However, directors growing up in Mao’s era are more cautious, they value work less,
and they are more coordinated. Taken together, these differences in personal values
across generations are more likely to weaken the interpersonal relations between groups
but may spark intragroup conflicts in decision-making. This conflict hampers the board
12As the directors’ values are imputed, we employ a bootstrap approach to check the robustness of the
26
from functioning effectively, which ultimately reduces bank performance.
With respect to bank risk, Panel D in Table 4 illustrates that directors’ diverse
values on risk are positively associated with NPLratio (at the 10% level), indicating
that the variability of views on risks increases bank credit risk.
In summary, taking together the results shown in Tables 2, 3, and 4, the effect
of value diversity has the same sign with that of age diversity on bank performance.
Thus, we can conclude that age diversity may affect bank performance negatively via
their diverse values with respect to work, prudence, and wealth. Put differently,
directors in different age cohorts hold diverse personal values in work, prudence, and
wealth (creativity and helping others) and approach decisions and policies differently.
Consequently, it is more likely to create conflicts, hamper the board from effective
functioning, and lead to worse bank performance.
4.4 Robustness
4.4.1 Potential endogeneity concern
A key concern for analysis of board effects on firm performance is the
endogeneity. In our main model, we partially address this issue by employing one-year
lagged board characteristics since board structure needs time to affect bank
performance. In board composition research, dynamic endogeneity is also a major issue.
Wintoki et al. (2012) argue that most of the exiting literatures on board structure
27
performance. Current firm performance may affect future board composition, and these,
in turn, may affect future firm performance. In our study, shareholders may call for
changes to the board. Replacing a younger director with an older individual could
change the age distribution on the board and, ultimately, affect bank performance. Thus,
previous bank performance can affect the motivation of boards to hire new directors.
As a possible solution, our empirical analysis is extended to employ the
Arellano-Bond (1991) dynamic Generalized Method of Moments (GMM) estimator,
which accounts for unobserved heterogeneity as well as dynamic relation between
board structure and past firm performance (Wintoki et al., 2012; Liu et al., 2014). We
report the GMM regressions in Appendix C1. All the independent variables are assumed
to be endogenous variables, except Bank Age and the year dummies. The lags (t-2, t-3,
and t-4) of the dependent variable and endogenous variables, together with all the lags
of the exogenous variables, are instrument variables. In Appendix C1, we still find a
significant negative effect (at 10% level) of board age diversity on bank profitability.
Therefore, our main results in model (1) are robust and are not driven by endogeneity.
4.4.2 Additional robustness tests
In examining the relationship between age diversity and bank performance in
model (1), we use the standard deviation of board age (SV) and Blau index of board age
(Blau) as alternative measures of age diversity. We find a consistently negative relation
28
we employ an alternative measure to calculate foreign directors’ values only based on
their own country survey as a robust check in Appendix C4. Consistent with Table 4,
we also find negative relations between directors’ value diversities on work, prudence,
and helping others at one side and bank profitability at the other side.
5. Conclusion
This paper extends the existing literature on board diversity by providing the
first empirical evidence of the effect of board age diversity on bank performance in
China. Our results show that age diversity in Chinese banks has a significant and
negative influence on bank performance. Although previous studies based on resource
dependency theory argue that a more diverse board provides more valuable information
and enhances firm performance, this study suggests that this type of age diversity is not
beneficial to Chinese banks. That is, age-diverse boards are more likely to suffer from
communication barriers and generate interpersonal frictions and conflicts in the
boardroom, and ultimately reduce bank performance.
To examine why age diversity negatively affects bank performance, we further
decompose directors’ age diversity into their personal value diversity. Given the
immense transition in China over the past decades, Chinese directors growing up in
Mao’s and Deng’s eras experienced different historical events and cultural phenomena,
which in turn affected their formulation of values and cognitive abilities. We find that
29
negatively affects bank profitability. This negative relation confirms that directors’ age
diversity affect bank performance via directors’ diverse values, as age is one of the
strongest predictors of value. Put differently, directors with diverse values on work,
prudence, approach decisions differently (i.e., they are more likely to slow down the
decision process in the boardroom and make it more conflicts), leading to worse bank
performance. In this way, we conclude that the ultimate success of the board depends
not only directors’ resources but also the interactions between them.
Our findings provide useful guidance for regulators, policymakers, and bank
directors concerning board diversity and shed light on the direction of further banking
governance reform. In particular, our findings suggest that, in the current weak
corporate governance system in China, an age-diverse board is not beneficial to the
bank. Banks with weak governance should look into adding directors with similar ages
into their board, to lower the generation gap in the board.
We believe that findings from this study are relevant not only for China but also
for other transition countries that are transforming from a centrally planned economy
to a market-based economy. For these countries, directors from different generations
are more likely to hold heterogeneous values, as cultural change is an ingredient of
economic development. To strive for excellence, the board should appreciate the
diverse personal values among directors, learn to manage value differences, and utilize
the benefits of directors’ different personal values to improve the effectiveness of the
31
References
Adams, R. B., Hermalin, B.E. &Weisbach, M. S. 2010. The Role of Boards of Directors in Corporate Governance: A Conceptual Framework and Survey. Journal of Economic Literature, 48(1), 58-107.
Adams, R. B. & Mehran, H. 2012. Bank board structure and performance: Evidence for large bank holding companies. Journal of Financial Intermediation, 21, 243-267.
Ahern, K., Daminelli, D & Fracassi, C. 2015. Lost in translation? The effect of cultural values on mergers around the world, Journal of Finacial Economics, 117(2015), 165-198.
Ali, M., NG, Y. L. & Kulik, C. T. 2014. Board Age and Gender Diversity: A Test of Competing Linear and Curvilinear Predictions. Journal of Business Ethics, 125,
497-512.
Ararat, M., Aksu, M. & Cetin, A. T. 2010. Impact of board diversity on boards' monitoring intensity and firm performance: evidence from the Istanbul Stock Exchange. Paper presented at the 17th Annual Conference of the Multinational Finance Society, Barcelona, June 27‐30.
Bantel, K. A. & Jackson, S. J. 1989. Top management and innovation in banking : does the composition of the top management team make a difference. Strategic Management Journal, 10, 107-124.
Basel Committee on Banking Supervision. 2014. Guidelines on Corporate Governance Principles for Banks.
Berger, A. N., Hasan, I. & Zhou, M. 2009. Bank ownership and efficiency in China: What will happen in the world’s largest nation? Journal of Banking & Finance,
33, 113-130.
Byrne, D. 1971. The attraction paradigm. Academic Press, New York.
Carter, D. A., D'souza, F., Simkins, B. J. & Simpson, W. G. 2010. The Gender and Ethnic Diversity of US Boards and Board Committees and Firm Financial Performance. Corporate Governance: An International Review, 18, 396-414. Carter, D. A., Simkins, B. J. & Simpson, W. G. 2003. Corporate Governance, Board
Diversity, and Firm Value. The Financial Review, 38, 33-53.
Cheng, L. T. W., Chan, R. Y. K. & Leung, T. Y. 2010. Management demography and corporate performance: Evidence from China. International Business Review,
19, 261-275.
Chevalier, J., & Ellison, G., 1999. Career concerns of mutual fund managers. Quarterly Journal of Economics. 114(2), 389–432.
Child, J.1974. Managerial and Organizational Factors Part I1. Journal of Management Studies, 11, 175-189.
China Banking Regulatory Commission. 2014. Banking Operation Report in 2014. Cumming, D., Leung, T. Y. & Rui, O. 2015. Gender diversity and securities fraud.
32
de Haan, J. & Vlahu, R. 2015. Corporate Governance of Banks: A Survey. Journal of Economic Surveys, 00, 1-50.
Demb, Ada & F.-Friedrich Neubauer, The Corporate Board, Oxford: Oxford University Press, 1992.
Estélyi, K.S. & Nisar, T.M. 2016. Diverse boards: Why do firms get foreign nationals on their boars? Journal of Corporate Finance, Forthcoming.
Johan, D., Dewatripont, M., Heremans, D., & Nguyen, G., 2004. Corporate governance, regulation and supervison of banks. Financial Stability Review, National Bank of Belgium.
Dong, Y., Meng, C., Firth, M. & Hou, W. 2014. Ownership structure and risk-taking: Comparative evidence from private and state-controlled banks in China.
International Review of Financial Analysis, 36, 120-130.
Egri, C. & Ralston, D.A. 2004. Gerneration Cohorts and Personal Values: A Comparison of China and the United States. Orgaization Science. 15(2). 201-220.
Erkens, D. H., Hung, M. & Matos, P. 2012. Corporate governance in the 2007–2008 financial crisis: Evidence from financial institutions worldwide. Journal of Corporate Finance, 18, 389-411.
Erhardt, N.L., Werbel, J.D. & Shrader, C.B. 2003. Board of Director Diversity and Firm Financial Performance, Corporate Governance: An Internatioanl Review, 11(2). Faleye, O. & Krishnan, K. 2010. Risky Lending: Does Bank Corporate Governance
Matter? 23rd Australasian Finance and Banking Conference 2010 Paper. Fama, E. F. & Jensen, M. C. 1983. Separation of Ownership and Control. Journal of
Law and Economics, 26, 301-32.
Ferris, G.R., Judge, T.A., Chachee, J.G. & Lide, R.C.,1991. The Age Contex of Performance Evaluation Decision. Psychol. Aging 6, 616-622.
García-Meca, E., García-sanchez, I.M. & Marinez-ferrero, J. 2015. Board diversity and its effects on bank performance: An international analysis. Journal of Banking & Finance, 53, 202-214.
Goergen, M., Limbach, P. & Scholz, M. 2015. Mind the gap: The age dissimilarity between the chair and the CEO. Journal of Corporate Finance, 35(2015), 136-158.).
Ghitza, Y. & Gelman, A. 2014. The Great Society, Reagan’s Revolution, and Generations of Presidential Voting, Working Paper.
Grove, H., Patelli, L., VictoravichI, L. M. & Xu, P. T. 2011. Corporate Governance and Performance in the Wake of the Financial Crisis: Evidence from US Commercial Banks. Corporate Governance: An International Review, 19, 418-436.
Hafsi, T. & Turgut, G. 2012. Boardroom Diversity and its Effect on Social Performance: Conceptualization and Empirical Evidence. Journal of Business Ethics, 112,
463-479.
33
Reflection of Its Top Managers. The Academy of Management Review, 9, 193-206.
Huang, J. & Kisgen, D. J. 2013. Gender and corporate finance: Are male executives overconfident relative to female executives? Journal of Financial Economics,
108, 822-839.
Huang, Z., Wang, T. & Li, X. 2016. The political dynamics of efucational changes in Chian, Policy Future in Education, 14(1),24-41.
Inglehart R. 2008. Changing Values among Western Publics from 1970 to 2006, West European Politics, 31 (1/2), p. 130-146.
Jackson, S. E. & Joshi, A. 2004. Diversity in social context: a multi-attribute, multilevel analysis of team diversity and sales performance. Journal of Organizational Behavior, 25, 675-702.
Jehn, K.A., Northcraft, G.B. & Neale, M.A., 1999. Why Differences Make a Difference: A Field Study of Diverstiy, Conflict, and Performance in Workinggroups,
Administrative Science Quartely, 44(4), 741-763.
Jensen, M. C. & Meckling, W. H. 1976. Theory of the Firm: Managedial Behavior Agency Costs and Ownership Structure , Journal of Financial Economics, 3, 305-360.
Kandel, E. & Lazear, E. P. 1992. Peer Pressure and Partnerships. Journal of Political Economy, 100, 801-817.
Kim, H., & Lim,C. 2010. Diversity, outside directors and firm valuation: Korean evidence. Journal of Business Studies. 28(2), 309-335.
Kunze, F., Boehm, S. A. & Bruch, H. 2011. Age diversity, age discrimination climate and performance consequences-a cross organizational study. Journal of Organizational Behavior, 32, 264-290.
Laeven, L. & Levine, R. 2009. Bank governance, regulation and risk taking. Journal of Financial Economics, 93, 259-27s5.
Levine, R. 2004. the Corporate Governance of the Banks: A Concise Discussion of Concepts and Evidence, Working Paper, World Bank Policy Research.
Liang, Q., Xu, P. & JirapornI, P. 2013. Board characteristics and Chinese bank performance. Journal of Banking & Finance, 37, 2953-2968.
Lin, X. & Zhang, Y. 2009. Bank ownership reform and bank performance in China,
Journal of Banking & Finance, 20-29.
Liu, Y., Wei, Z. & Xie, F., 2014. Do women directors improve firm performance in China? Journal of Corporate Finance, 28, 169-184.
Lorsch, Jay W. & Elizabeth MacIver, Pawns or Potentates: The Reality of America’s Corporate Boards, Boston: Harvard Business School Press, 1989.
Mace, M. L., Directors: Myth and Reality, Boston: Harvard Business School Press, 1971.
34
Mannheim, K. 1949 Man and society in an age of construction. New York: Harcour, Brace.
Marcus, J., MacDonald, H.A., & Sulsky, L.M. 2015. Do Personal Values Influence the Propensity for Sustainability Actions? A Policy-Capturing Study, Journal of Business Ethics, 2015(217), 459-478.
Medawar, P.B. 1952. An Unsolved Problem of Biology, London: H.K.Lewis.
Milliken, F. & Martins, L. 1996. Searching for Common Threads: Understanding the Multiple Effects of Diversity in Organizational Groups, The Academy of Management Review, 21(2), 402-433.
Mishra, R.K. & Jhunjhunwala, S. 2013. Diversity and the Effective Corporate Board, Oxford: Elsevier.
Monks, R. & Minow, N. 2004. Corporate Governance. Blackwell Business, Cambridge. Murray, A. I. 1989. Top Management Group Heterogeneity and Firm Performance.
Strategic Management Journal, 10, 125-141.
Nguyen,D.D.L., Hagendorff,J. & Eshraghi,A. 2015.Which executive characteristics create value in banking? Evidence from appointment announcements. Corporate Governance: An International Review23(2), pp. 112-128.
Pathan, S. 2009. Strong boards, CEO power and bank risk-taking. Journal of Banking & Finance, 33, 1340-1350.
Pathan, S. & Faff, R. 2013. Does board structure in banks really affect their performance? Journal of Banking & Finance, 37, 1573-1589.
Pelled, L. H., Eisenhardt, K. M. & Katherine R. X. 1999. Exploring the BlackBox: An Analysisof Work Group Diversity, Conflict,and Performance. Administrative Science Quarterly, 44, 1-28.
Pfeffer, J. & Salacik, G. R. 1978. The external control of organizations: A resource dependence perspective.
Prasad, R. 1992. Generation Gap: A Study of Intergenerational Sociological Conflict. Mittal Publications, New Delhi.
Prendergast, C. & Stole, L. 1996. Impetuous Youngsters and Jaded Old-Timers: Acquiring a Reputation for Learning. Journal of Political Economy, 104, 1105-1134.
Qian, X., Zhang, G. & Liu, H. 2015. Officials on boards and the prudential behavior of banks: Evidence from China's city commercial banks. China Economic Review,
32, 84-96.
Ralston, D.A., Caolyn, P.E., Stewart, S. Terpstra, R.H. & Yu, K. 1999. Doing Business in the 21st Century with the New Generation of Chinese Managers: A Study of Generational Shifts in Work Values in China. Journal of International Business Studies, 30(2), 415-427.value
Rhodes, S. R. 1983. Age-related differences in work attitudes and behavior: A review and conceptual analysis. Psychological Bulletin, 93(2), 328-367.
35
Ruigrok, W., Peck, S. & Tacheva, S. 2007. Nationality and Gender Diversity on Swiss Corporate Boards. Corporate Governance: An International Review, 15, 546-557.
Schusky, E.L. & Culbert, P., 1973. Introducing Culture. Englewood Cliffs. NJ: Pretice-Hall.
Serfling, M. A. 2014. CEO age and the riskiness of corporate policies. Journal of Corporate Finance, 25, 251-273.
Sila, V., Gonzalez, A. & Hagendorff, J. 2016. Women on board: Does boardroom gender diversity affect firm risk? Journal of Corporate Finance, 36(2016), 26-53. Staikouras, P. K., Staikouras, C. K. & Agoraki, M.-E. K. 2007. The effect of board size
and composition on European bank performance. European Journal of Law and Economics, 23, 1-27.
Stulz, R.M. & Williamson, R. 2003. Culture, openess and finance. Journal of Finance Economics, 70, 313-349.
Sun, J. and Wang, X. 2010. Value differnece between generations in China: a study in shanghai, Journal of Youth Studies, 13(1), 65-81.
Tarus, DK. & Aime F. 2014. Board Demographic Diversity, Firm Performance and Strategic Change, Management Research Review, 37(12), 1110-1136.
Tian, X. 1998. Dynamic of Development in an Opening Economy: China Since 1978. Nova Science Publisher, Commack, NY.
Vohra, R.2000. China’s Path to Modernization: A Historical Review From 1800 to the Present. Pretice-Hall, Upper Saddle River, NJ.
Wang, T. & Hsu, C. 2013. Board composition and operational risk events of financial institutions. Journal of Banking & Finance, 37, 2042-2051.
Westphal, J. D. & Bednar, M. K. 2005. Pluralistic Ignorance in Corporate Boards and Firms’ Strategic Persistence in Response to Low Firm Performance.
Administrative Science Quarterly, 50, 262-298.
Williams, K. Y. & O’Reilly, C. A. 1998. Demography and diversity in organizations: A review of 40 years of research. B.M. Staw, L.L. Cummings (Eds.), Research in Organizational Behavior, JAI Press, Greenwich, CT20, 77-140.
Wintoki, M.B., Linck, J.S. & Netter, J.M. 2012. Endogeneity and the dynamics of intenal corporate governance. Journal of Financial Economics, 105 (2012),581-606.
Zhang, J., Wang, P. & Qu, B. 2012. Bank risk taking, efficiency, and law enforcement: Evidence from Chinese city commercial banks. China Economic Review, 23, 284-295.
36
Figure 1 Distribution of Directors’ Age in Chinese Banks from 2009- 2013
Source: Chinese bank annual report (2009, 2010, 2011, 2012 and 2013)
Notes: This figure reports the age distribution of all the directors on the board. Age is on the horizontal axis.
0
.0
2
.0
4
.0
6
.0
8
30 40 50 60 70 80
Directors' Age
37 Figure 2 Chinese Generation Timeline
38
Figure 3 Personal Value Differences of Directors in the Sample (Chinese Banks: 2009 – 2013)
Source: Chinese bank annual report (2009, 2010, 2011, 2012, and 2013), World Values Survey 6th Wave
Notes: Panels A to H show directors’ personal value (mean) changes across different age groups,
namely, risk, work, prudence, wealth, success, thoroughness, creativity, and helping others. We define our generation groups that correspond to specific social and political events at the age of 18: Early Mao generation (born during 1931-1947),late Mao generation (born during
1948-1958),Early Deng generation (born during 1959-1974) and Late Deng generation (born
39 Table 1 Summary statistics
Variables Mean Std P25 P50 P75 Obs
Panel A: Bank Performance
ROA 0.01 0.00 0.01 0.01 0.01 448
ROE 0.19 0.07 0.15 0.18 0.22 448
Z-score 3.87 0.71 3.39 3.80 4.31 441
NPLratio 0.01 0.01 0.01 0.01 0.01 435
Panel B: Bank Board Age Diversity
Age diversity (CV) 0.14 0.04 0.11 0.14 0.17 450
Age diversity (SD) 7.24 1.96 6.03 6.96 8.61 450
Age diversity (Blau) 0.58 0.11 0.52 0.60 0.65 450
Panel C: Bank Board Value Diversity
Value diversity (risk) 0.11 0.03 0.09 0.11 0.13 302 Value diversity (work) 0.06 0.02 0.04 0.05 0.07 302 Value diversity (prudence) 0.06 0.02 0.05 0.06 0.07 302 Value diversity (wealth) 0.07 0.04 0.04 0.06 0.08 302 Value diversity (success) 0.02 0.02 0.01 0.02 0.02 302 Value diversity
(thoroughness) 0.03 0.01 0.02 0.03 0.03 302
Value diversity (creativity) 0.02 0.01 0.01 0.02 0.02 302 Value diversity (helping
others) 0.01 0.01 0.01 0.01 0.01 302
Panel D: Control Variables
Board Characteristics
Independent Director 0.25 0.12 0.15 0.27 0.33 450
Board Size 13.77 3.37 11.00 14.00 15.00 450
Duality 0.03 0.16 0.00 0.00 0.00 439
Ownership characteristics
State 0.18 0.19 0.00 0.12 0.21 451
Foreign 0.02 0.06 0.00 0.00 0.00 451
Private 0.03 0.07 0.00 0.00 0.00 451
Bank-Specific measures
Capital Ratio 0.07 0.02 0.05 0.06 0.08 444
Loan Ratio 0.46 0.11 0.40 0.48 0.54 446
Size 18.83 1.65 17.70 18.44 19.56 446
Bank Age 2.40 0.88 1.95 2.56 2.77 442
Listed 0.18 0.39 0.00 0.00 0.00 451
Location effects
City GDP 10.98 0.49 10.63 11.07 11.38 454
Notes: This table reports descriptive statistics on key variables. The sample is an unbalanced panel
covering 97 banks over the period of 2009 -2013. Panel A reports the summary statistics of bank performance variables. Panel B reports the summary statistics of Bank Board Age Diversity variables. Panel C reports the summary statistics of board value diversity variables. Panel D reports the
40 Table 2
Relation between board age diversity and bank performance
Profitability Risk
ROA ROE Z-score NPLratio
(1) (2) (3) (4)
Age Diversity -0.013** -0.230* -0.026 0.025
(-2.021) (-1.922) (-0.055) (0.715)
Board Size 0.000 0.001 -0.001 0.000
(1.307) (0.657) (-0.195) (0.142) Duality -0.002* -0.024 0.086 0.005*** (-1.810) (-1.317) (0.950) (2.867)
Independent Director 0.005* 0.055 0.247 -0.025**
(1.691) (1.019) (1.562) (-2.278)
State 0.008 0.186 0.095 -0.038
(1.382) (1.629) (0.290) (-0.958)
Foreign 0.001 0.224 -0.348 0.004
(0.144) (1.406) (-0.897) (0.111)
Private -0.008* -0.065 0.029 0.044
(-1.739) (-0.757) (0.111) (1.530)
Size -0.002 -0.051** -0.078 0.018*
(-1.366) (-2.039) (-0.923) (1.754)
Listed 0.001 0.016 -0.022 0.000
(1.091) (1.037) (-0.414) (0.029)
Loan Ratio -0.005 -0.085 -0.274 0.035
(-1.363) (-1.202) (-0.990) (1.359) Capital Ratio 0.014 -0.998*** 1.444** -0.014 (0.961) (-4.003) (2.028) (-0.300)
City GDP -0.001 -0.023 0.008 -0.000
(-0.899) (-0.843) (0.095) (-0.044)
Bank Age 0.000 0.010 0.044 0.009*
(0.084) (0.472) (0.749) (1.751)
Year Controls Yes Yes Yes Yes
Obs 325 325 325 322
𝑅2 0.224 0.204 0.154 0.207
41 Table 3a
Regression of prediction of values (China) Value
(risk) Value(work) Value(happiness) Value(prudence) (wealth)Value Value(success) Value(thoroughness) Value(pressure) Value(outgoing)
Age -0.046*** -0.051*** 0.000 0.030*** -0.026*** -0.025*** 0.020*** 0.001 -0.007
(0.006) (0.009) (0.007) (0.007) (0.007) (0.008) (0.007) (0.006) (0.006)
Education
2(secondary school) -0.304* -0.042 0.245 -0.059 -0.439** 0.187 0.378* 0.258 0.269
(0.172) (0.214) (0.207) (0.218) (0.194) (0.213) (0.194) (0.180) (0.177)
3(university) -0.067 -0.018 0.342 -0.177 -0.222 0.700** 0.692*** -0.172 -0.099
(0.223) (0.318) (0.311) (0.261) (0.259) (0.337) (0.266) (0.231) (0.229)
Employment 0.275 0.833*** 0.059 0.410* 0.707*** 0.477** 0.149 -0.101 -0.035
(0.179) (0.215) (0.238) (0.213) (0.195) (0.229) (0.206) (0.186) (0.185)
income
2(middle) 0.053 0.094 0.028 -0.404* 0.427** 0.112 -0.020 0.261 0.234
(0.162) (0.254) (0.203) (0.233) (0.189) (0.231) (0.182) (0.168) (0.165)
3 (high) 0.479** 0.608* 0.396 -0.960*** 0.435 -0.027 0.027 0.599** 0.178
(0.232) (0.367) (0.380) (0.297) (0.269) (0.356) (0.283) (0.255) (0.243)
gender 0.323** 0.241 -0.275 -0.121 0.054 0.251 0.225 0.140 0.257*
(0.130) (0.185) (0.179) (0.158) (0.152) (0.186) (0.149) (0.135) (0.133)
Social class
2 (working) -0.368** 0.280 -0.481** 0.130 -0.343* -0.339 -0.323* -0.349** -0.200
(0.155) (0.237) (0.210) (0.194) (0.185) (0.231) (0.174) (0.162) (0.162)
3 (middle) -0.599*** -0.223 -1.239*** -0.133 -0.357 -0.753** -0.238 -0.068 -0.372*
(0.216) (0.321) (0.254) (0.286) (0.254) (0.294) (0.246) (0.227) (0.221)
4(upper) 0.557* -0.311 0.299 -0.054 -0.166 0.173 -0.241 -0.147 -0.166
(0.298) (0.379) (0.550) (0.322) (0.311) (0.451) (0.339) (0.302) (0.293)
Supervisor -0.087 -0.166 0.477** -0.055 -0.682*** -0.194 0.163 -0.073 0.279*
(0.153) (0.210) (0.232) (0.181) (0.173) (0.219) (0.185) (0.157) (0.158)
Constant 1.807*** 3.339*** 1.914*** 0.432 2.213*** 2.517*** -0.296 0.242 0.318
(0.419) (0.600) (0.517) (0.480) (0.472) (0.590) (0.495) (0.440) (0.449)
Obs 1175 1235 1253 1174 1181 1176 1037 1046 1050
𝑅2 0.094 0.151 0.064 0.038 0.071 0.066 0.023 0.017 0.018