Accelerated Calcium Phosphate Formation on Titanium Utilizing Galvanic
Current between Titanium and Gold in Hanks
’
Solution
Yusuke Tsutsumi
1,+1, Equo Kobayashi
2, Masakimi Ogo
3,+2, Suyalatu
1, Satoshi Migita
1,
Hisashi Doi
1, Naoyuki Nomura
1, Kazuhiko Noda
3and Takao Hanawa
1,41Institute of Biomaterials and Bioengineering, Tokyo Medical and Dental University, Tokyo 101-0062, Japan
2Department of Metallurgy and Ceramics Science, Tokyo Institute of Technology, Tokyo 152-8552, Japan
3Department of Materials Science and Engineering, Shibaura Institute of Technology, Tokyo 135-0061, Japan
4Department of Materials Engineering, Graduate School of Engineering, The University of Tokyo, Tokyo 113-8656, Japan
To enhance hard-tissue compatibility of Ti, galvanic current between titanium (Ti) and gold (Au) may be available. Prior to the design of medical devices with the capability to generate a galvanic current, it is necessary to understand the control mechanism. In this study, wefirst measured galvanic current between Ti and Au with various surface areas in Hanks’solution. The galvanic current increased immediately after connection of two electrodes, followed by an abrupt decrease and a steady state. The galvanic current varied with the combinations of Ti and Au areas. We, thereafter, evaluated the formation of calcium phosphate on Ti under a condition of applying simulated galvanic current. Surface characterization was revealed in which the calcium phosphate formation was enhanced accompanied by growth of Ti oxide layer under the galvanic current application. A similar result was observed on Ti with patterned Au coating without outer electric power. Therefore, galvanic current is useful to enhance hard-tissue compatibility, and this technique has potential for applications to metallic biomaterials.
[doi:10.2320/matertrans.MC201204]
(Received July 2, 2012; Accepted September 10, 2012; Published November 2, 2012)
Keywords: titanium, galvanic current, calcium phosphate, hard-tissue compatibility
1. Introduction
When a metallic material is implanted into a human body, an immediate reaction occurs between its surface and the living tissues. In other words, immediate reaction at this initial stage straightaway determines and defines a metallic material’s biofunction. With surface modification, the biofunction of surface layers could be improved. For these purposes, many techniques for surface modification of metals are attempted on a research stage, and some of them are commercialized. Major purpose of surface modification is to improve hard-tissue compatibility or accelerate bone formation. Research to improve hard-tissue compatibility involves two approaches based on the resultant surface layer: a calcium phosphate and titanium oxide layer with the thickness measured in micrometers and a surface-modified layer with the thickness measured in nanometers.1) Most
orthopedic materials and dental implants are made of titanium (Ti) due to its superior biocompatibility. In some commercialized devices, to enhance bone bonding to metal surfaces and to shorten the clinical treatment period, various surface modification techniques have been developed. Hydroxyapatite (HA) or calcium phosphate coating is a promising technique to accelerate bone formation on Ti.
One of the strong tools for HA coating is electrochemical deposition. Through an electrochemical process, carbonate-containing HA with a desirable morphology could be precipitated on a Ti substrate with/without following heat treatment.2,3)Beta tricalcium phosphate is cathodically coated on Ti with immobilization of collagen.4) Low-voltage
alternating current is also effective to precipitate calcium phosphate on Ti.5) HA is electrodeposited with pulse
current.6) Nano-grained calcium phosphate is
electrochemi-cally deposited on Ti using acidic electrolytes.7)The coating
layer contains dicalcium phosphate dihydrate with a small amount of HA; the content of HA increases with the increase of the current density.8)In addition, various electrochemical
methods for producing HA coatings on a Ti surface are reported.911) Electrochemical HA deposition is also appli-cable to other metallic biomaterials.12,13) The mechanism of electrodeposition of calcium phosphate was recently inves-tigated.14) HA is co-electrodeposited on Ti with chitosan15) and collagen.16) Electrochemical deposition is an excellent technique to coat calcium phosphate on metal surfaces.
On the other hand, the acceleration of the formation of callus by electric stimulation has been reported.17)At present,
electric stimulation is clinically applied to regenerate bone in orthopedics in methods that are invasived, non-invasive and semi-invasive.18)If this electrical stimulation is applied to the
formation of bone in a dental implant, an electric power source should be connected to the medical device. However, it is not easy to implant an electric power source in a living body.
In this study, we assumed that the galvanic current between Ti and gold (Au) is useful to accelerate the formation of bone on Ti. Prior to the design of a medical device with the capability of generating galvanic current, it will be necessary to understand the control mechanism for the current and how it would affect the formation of calcium phosphate in a simulated bodyfluid. Wefirst measured the galvanic current between Ti and Au with various surface areas in Hanks’ solution. We, thereafter, evaluated the calcium phosphate formation on Ti with a simulated steady-state galvanic current. The resultant surfaces were characterized with +1Corresponding author, E-mail: tsutsumi.met@tmd.ac.jp
+2Graduate Student, Shibaura Institute of Technology. Present address: GC
Corp., Tokyo 113-0033, Japan
microscopic observations with energy dispersive X-ray spectroscopy (EDS), ellipsometry and X-ray photoelectron spectroscopy (XPS). Thereafter, the spontaneous acceleration of calcium phosphate formation on Au-coated Ti in Hanks’ solution was evaluated to confirm the availability of a spontaneously generated galvanic current for the enhance-ment of the hard-tissue compatibility of Ti.
2. Experimental Procedures
2.1 Specimen preparation
Commercially pure Ti plates (10 mm©10 mm©2 mm) with grade 2 (Rare Metallic Co., Ltd.) were polished with
#320 to#600 grid SiC papers, a 9 µm diamond suspension, and,finally, a 0.04 µm colloidal-silica suspension to obtain a flat, clean and shinny surface. The Ti plates were cleaned by ultrasonication in acetone for 900 s and dried with a stream of nitrogen (99.9%). To obtain a stable passive oxide layer on the Ti, the disks were placed in ultrapure water (18.2 M³cm) for 7 d immediately after polishing. A pure Au plate (99.9%, Ishifuku Metal Industry, Co., Ltd.) was also used as a galvanic couple electrode. Au plates were polished with#600 grid SiC paper and cleaned according to the same method described above.
2.2 Galvanic current between Ti and Au
The Ti plate wasfixed in a polytetrafluoroethylene (PTFE) holder, and the Au plate was sealed using PTFE tape so that it would be insulated from the electrolyte with the exception of an open window with a different exposed area. The structures of the electrodes are illustrated in Fig. 1(a). Hanks’solution with a composition similar to extracellular fluid without glucose was used as an electrolyte. The ion concentrations
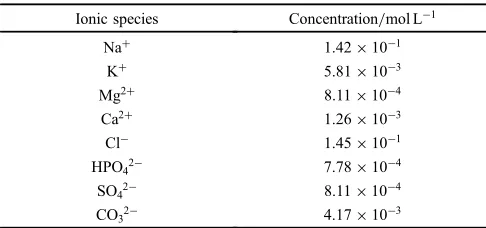
of the Hanks’ solution used in this study are summarized in Table 1. The pH of the solution was confirmed to be 7.4 just after preparation. The Hanks’solution was deaerated by nitrogen gas for 30 min and kept at 37°C.
The galvanic current between Ti and Au in the Hanks’ solution was measured with a non-resistance ammeter (HM-104, Hokuto Denko Corp.), and the transient current was recorded using a digital storage oscilloscope (DS-9200C, Iwatsu Test Instruments Corp.) at 250 Hz of sampling frequency up to 20 s. The measurement system is illustrated in Fig. 1(b). After the Ti and Au electrodes were connected to the non-resistance ammeter in air, only the Au electrode was immersed in the electrolyte. Thereafter, the Ti electrode was immersed in the solution to measure the galvanic current between Ti and Au because the Ti surface easily reacts with the solution and the surface oxide layer on Ti immediately alters. This process makes it possible to measure a transient galvanic current. The measurements were performed with various combinations of exposed areas of both electrodes because the area ratio influences the magnitude of the
Au
PTFE Tape with single hole Lead wire
Ti O-ring PTFE Tube Lead wire
(a)
Au
(b)
Pt
SCE
(c)
Ti
PTFE Base PTFE Cap
Non-resistance Ammeter
Digital Storage Oscilloscope
Ti
Salt Bridge
Galvanostat
PC
Ti Electrode Au Electrode
[image:2.595.98.498.66.342.2]Fig. 1 Schematic illustrations of the insulation of (a) Ti and Au electrodes, (b) the experimental setup for galvanic current measurement, and (c) the experimental setup for galvanosatic polarization.
Table 1 Ion concentrations of Hanks’solution.
Ionic species Concentration/mol L¹1
Na+ 1.42©10¹1
K+ 5.81©10¹3
Mg2+ 8.11©10¹4
Ca2+ 1.26©10¹3
Cl¹ 1.45©10¹1
HPO42¹ 7.78©10¹4
SO42¹ 8.11©10¹4
[image:2.595.305.548.407.521.2]galvanic current. The combination of the exposed area of the Ti electrode (STi) and that of the Au electrode (SAu) is
summarized in Table 2.
The current transient just after the immersion of Ti is extremely fast, and it is difficult to measure the true value of the peak current. To estimate the accurate peak current, Ipeak, an extrapolated current at 0 s was used instead of the
maximum net current in the recorded data. The extrapolation was done by fitting with an exponential model in a time-current curve.
2.3 Calcium phosphate formation with galvanic current
2.3.1 Galvanostatic polarization
As described in the later, the galvanic current momentarily increased by the immersion of the Ti electrode, showed a sharp peak in about 0.2 s after the immersion, then abruptly decreased, and finally achieved the steady state. Therefore, galvanostatic polarization with constant current simulating the steady-state current density was performed in Hanks’ solution.
The Ti plate was fixed in the PTFE holder with the exception of an open window for contact with the electrolyte (6.0 mmº), as shown in Fig. 1(c). The exposed area for electrodeposition was 0.28 cm2. A saturated calomel
elec-trode (SCE) and platinum (Pt) were used as the reference and counter electrodes, respectively. Ti, SCE and Pt were connected to a potentio/galvanostat (HAB-151, Hokuto Denko Corp.) in Hanks’ solution at 37°C, and constant anodic current density of 0.5 or 1.0 µA cm¹2 was applied for 104 and 105s. The potential was recorded during the galvanostatic polarization. After polarization, Ti was rinsed with ultrapure water. As control samples, Ti plates just immersed in Hanks’solution for the same periods without polarization were also prepared.
2.3.2 Ti with Au pattern coating
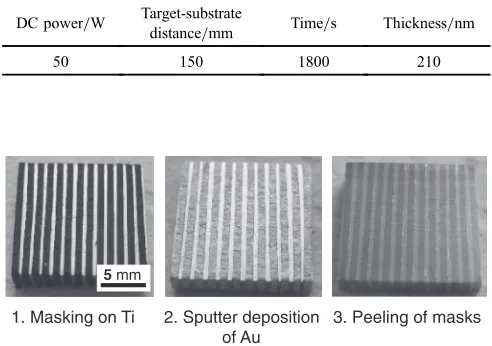
A Ti sheet with Au pattern coating was prepared in the following manner. A Ti sheet (15 mm©15 mm©2 mm) was polished with#320,#600 and#800 grid SiC papers. In order to avoid peeling of the coated Au, relatively roughened surface without mirror finish was applied to this test. The Au was then sputter-deposited on the Ti sheet. A pure Au (Furuya Metal Co., Ltd.) was used as a target in a sputter-deposition system, and an Au layer of 210 nm in thickness was deposited on Ti using partially covering masks. The deposition parameters are shown in Table 3. Figure 2 shows the appearance of the samples during the coating steps. In this way, equidistant striated Au layers were deposited on Ti. The samples with and without the Au coatings were then immersed in Hanks’ solution at 37°C for 7 d to evaluate calcium phosphate formation.
2.4 Surface characterization
The surfaces of the specimens were observed with a stereoscopic microscope (SZX12, Olympus Co., Ltd.) and a scanning electron microscope with an energy dispersive X-ray spectrometer (SEM/EDS, S-3400N, Hitachi High-Technologies Corp.).
The change in an apparent thickness of a newly formed layer on Ti was determined with an ellipsometer (DVA-36Ls, Mizojiri Optical, Co., Ltd.) in air. The light source was a He Ne laser with a wavelength of 632.8 nm, and the incident angle to the specimen surface was 70°. The apparent thickness was calculated using a single-layer model with variables of a refraction index, n, and a thickness, t. The optical parameters of the substrate, n0, and extinction
coefficient, k0, were measured in advance, and they were
2.39 and 3.07, respectively.
X-ray photoelectron spectroscopy (XPS) was performed with an electron spectrometer (SSX100, SSI, UK). All binding energies given in this paper are relative to the Fermi level, and all spectra were excited with the mono-chromatized Al K¡line (1486.61 eV). The spectrometer was calibrated against Au 4f7/2 (binding energy, 84.07 eV) and
Au 4f5/2 (87.74 eV) of pure Au and Cu 2p3/2 (932.53 eV),
Cu 2p1/2 (952.35 eV) and Cu Auger L3M4,5M4,5 line
(kinetic energy, 918.65 eV) of pure copper. The energy values were based on published data.19) To estimate the
photoelectron peak intensities, the background was sub-tracted from the measured spectrum according to Shirley’s method.20) The binding energy of spectra were calibrated
by the C 1s peak originating from CH2 contaminant as
285.0 eV.
The composition of the surface layer was calculated according to the method by previous studies.21,22) Empirical data2325)of the relative photoionization cross sections were used for the quantification. The relative photoionization cross sections used in this study are summarized in Table 4, where ·ij/·O1s represents the relative photoionization cross
[image:3.595.304.550.86.259.2]section of a level j electron of an element i to that of O 1s electrons. The reproducibility of the results was confirmed several times under the same conditions.
Table 2 Combinations of the exposed area of Ti and Au electrodes.“Y” indicates the combinations tested.
Area of Au,
SAu/mm¹2
Area of Ti,STi/mm¹2
4.9 7.1 9.6 28.3 78.5 92.5 134.8
7.1 Y Y Y Y ® Y ®
12.6 ® Y ® Y Y Y Y
[image:3.595.47.292.93.164.2]19.6 Y Y Y ® ® Y Y
Table 3 Sputter deposition parameters of Au on a Ti substrate.
DC power/W Target-substrate
distance/mm Time/s Thickness/nm
50 150 1800 210
1. Masking on Ti 2. Sputter deposition of Au
3. Peeling of masks
5 mm
3. Results and Discussion
3.1 Galvanic current measurement
An example of the time transient curves of the galvanic current between Ti and Au electrodes is shown in Fig. 3. This curve is obtained from the combination of Ti (STi=
78.5 mm2) and Au (S
Au=12.6 mm2) electrodes. The galvanic
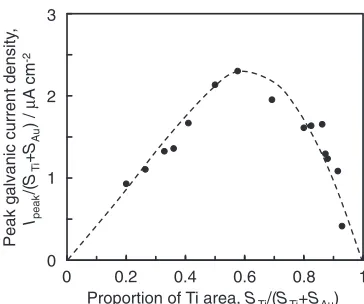
current jumped up immediately after immersion of Ti into Hanks’ solution and showed a peak current approximately 0.2 s after the immersion followed by an abrupt decrease and, thereafter, the steady state. The same tendency of the time transient was observed in all combinations of Ti- and Au-exposed areas. However, the magnitude of the peak current was varied by the combinations of both electrode areas. In addition, the magnitude of the galvanic current in the steady state was approximately proportional to that of the peak current. Theoretically, the peak and the steady state currents are proportional to the total area of the two electrodes when the area ratio is constant. Therefore, the degree of the galvanic currents should be expressed by the current density. Figure 4 shows the efficiency for generating a galvanic current arranged from the proportion of Ti area. It is noteworthy that the peak galvanic currents in thisfigure were normalized by the whole area of the electrodes. The galvanic current clearly showed a maximum when the proportion of the Ti area was around 5070%. In other words, a galvanic current between Ti and Au can be utilized most effectively when the area ratio is appropriate. The steady-state currents around this ratio were determined as 0.050.2 µA; therefore, the anodic current density for a Ti electrode was estimated to be in the range of 0.01 to 1.0 µA cm¹2.
3.2 Galvanostatic polarization measurement
To simulate the steady-state galvanic current on Ti, a galvanostatic polarization to Ti was performed. A slight and constant anodic current of 0.5 or 1.0 µA cm¹2was applied to
Ti for 104and 105s in Hanks’solution. A time transient of the potential during the polarization is shown in Fig. 5. In this figure, “0 µA cm¹2”indicates that no current was applied to Ti but that it was just immersed in the solution. When a current was applied, the potential gradually increased, and the gradient became small with a potential of approximately 2.5 VSCE. The change in the apparent thicknesses of the
[image:4.595.335.517.68.220.2]surface oxide layers on these samples was measured with an ellipsometer, and the results are shown in Fig. 6. In the case of immersion without galvanostatic polarization, the Table 4 Photoionization cross sections of leveljof element i relative to
that of O1s,·ij/·O1s.
Level Ti 2p3/2 Ca 2p P 2p
·ij/·O1s 1.28 2.59 0.786
Reference 23 24 25
-0.5 0.0 0.5 1.0 1.5 2.0
-5
Time, t / s
Current,
I
/
µ
A
Connection Peak current (Ipeak
25 20 15 10 5 0
)
Fig. 3 Example of the time transient curve of the galvanic current between Ti (STi=78.5 mm2) and Au (SAu=12.6 mm2) electrodes in Hanks’
solution.
0
Proportion of Ti area, STi/(STi+SAu) 0
1 2 3
Peak galvanic current density
,
Ipeak
/(
STi
+
SAu
) /
µ
A c
m
-2
0.8 1 0.6
0.4 0.2
Fig. 4 Efficiency of generating galvanic current between Ti and Au.
0
Time, t / ×104s
-1 0 1 2 3 4
Potential,
E
/ V vs. SCE
0 µA cm−2
0.5 µA cm−2
1.0 µA cm−2
10 7.5
5 2.5
Fig. 5 Time transient of potential of Ti during galvanostatic polarization.
Time, t / s
Apparent thickness of
surface oxide layer
,
t
/ nm
104 105
0 µA cm−2
0.5 µA cm−2
1.0 µA cm−2
0 2 4 6 8 10
[image:4.595.46.291.91.302.2] [image:4.595.334.518.263.411.2] [image:4.595.322.530.450.622.2]thickness did not change until at least 105s. On the other
hand, the thickness increased by polarization and was dependent on both the current density and polarization time. From these results, the increase in the potential at the initial stage of the polarization in Fig. 5 was attributed to growth of the surface oxide layer with high electric resistance. The oxygen evolution reaction by oxidation of water then started to occur at a higher potential of approximately 2.5 VSCE. It was confirmed that the growth of the surface
oxide layer of Ti continued under the condition of slight current application.
The XPS measurement was performed to evaluate the condition of the surface oxide layer and calcium phosphate formation on Ti in Hanks’ solution with/without galvano-static polarization. Carbon was detected on all specimens. From the C 1s spectra, it was concluded that none of the specimens contained carbonate because no peak was detected at an energy region of 289290 eV, where carbonate should give a C 1s peak.26)Therefore, carbon detected by XPS can
be ascribed to the so-called contaminant carbon.
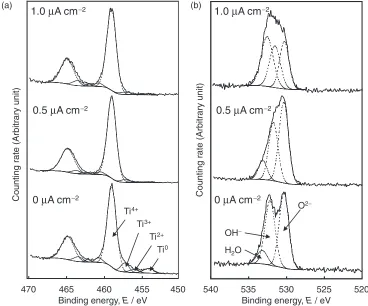
Apart from carbon, titanium, calcium, phosphorus and oxygen were detected from all specimens with XPS, but other elements contained in the Hanks’solution were undetected. The XPS spectra of the binding energy regions of Ti 2p are shown in Fig. 7(a). The Ti 2p peak gave four doublets23) according to the valence, i.e., Ti0, Ti2+, Ti3+and Ti4+. In the
case of immersion in Hanks’solution, peaks originating from Ti0and Ti2+were detected in addition to those from Ti3+and
Ti4+, while only those from Ti3+and Ti4+were observed on
Ti with polarization. This indicates the growth of a surface
layer and it agrees with the results of the ellipsometry. The XPS spectrum of the O 1s electron-binding energy region consists of at least three peaks originating from O2¹,
hydroxide, or hydroxyl groups, OH¹, and hydrate and/or adsorbed water,27) as shown in Fig. 7(b). The proportion of peak origination from H2O increased with the applied
current. The binding energy of peaks of the Ca 2p3/2
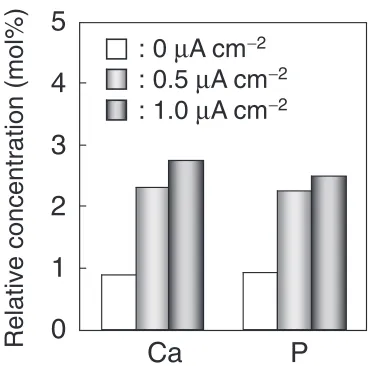
electron-binding energy region was around 347.6 eV, indicating that calcium exists as Ca2+.28) The P 2p region peak existed at 133.3133.6 eV. The binding energy of the peak is in agreement with that of calcium phosphate.29,30) Therefore, calcium phosphate formation on Ti was con-firmed. The relative concentrations of Ca and P calculated from quantitative analyses of the XPS data are shown in Fig. 8. The relative concentrations of both Ca and P on Ti with the anodic polarization were higher than those on Ti without polarization. In addition, this tendency of the Ca and P concentrations is similar to that of the growth of the surface oxide layer, as shown in Fig. 6. Thus, the acceleration of calcium phosphate formation in Hanks’ solution may be attributed to the growth of the surface oxide layer by constant current application.
3.3 Calcium phosphate formation on Au-coated Ti
To confirm the availability of the actual TiAu galvanic current, a Ti sheet with Au pattern coating (Ti/Au) was prepared. The proportion of the exposed Ti area was calculated as 58.2% of the total area of Ti/Au by image analysis. As shown in Fig. 4, this proportion is expected to be appropriate for utilizing the galvanic current between 450
455 460
465 470
Binding energy, E / eV
Counting rate (Arbitrary unit)
Ti4+ Ti3+
Ti2+ Ti0
1.0 µA cm−2
0.5 µA cm−2
0 µA cm−2
520 525
530 535
540
Binding energy, E / eV
Counting rate (Arbitrary unit)
H2O OH−
O2−
1.0 µA cm−2
0.5 µA cm−2
0 µA cm−2
(b) (a)
[image:5.595.113.481.71.377.2]Ti and Au. After 7-d immersion in Hanks’ solution, many small precipitates of calcium phosphate were observed on the Ti area on Ti/Au, as shown in Fig. 9. The precipitates were uniformly distributed on the Ti area without relation to the distance from the Au edge. On the other hand, no precipitate was observed on the Au area. EDS measurement was performed to evaluate the acceleration of calcium phosphate formation on this area. Figure 10 shows the relative concentrations of Ca and P on the different area of Ti/Au specimen. The result of a Ti sheet without Au coating as a control is also listed in the figure. The concentrations of both Ca and P were the highest on the exposed Ti area on Ti/Au. The atomic ratio of Ca to P, which is often used as an indicative parameter of maturing calcium phosphate, on the area was also higher than that on uncoated Ti. Thus, the galvanic current between the Ti substrate and coated Au was confirmed to be effective to enhance calcium phosphate formation in Hanks’ solution as well as the result of a galvanostatic polarization test. The same effect of applying the anodic current with an outer power source can be expected by the self-generating galvanic current between Au and Ti. In both cases, growth of the
oxide layer on Ti must be took place. Uedaet al.31)reported
that the chemically- and hydrothermally-synthesized TiO2
on Ti substrate showed the promotion of hydroxyapatite precipitation in simulated body fluid (SBF). The same mechanism may be contributed to the electrochemically-grown TiO2 layer in this study. On the other hand, no
phosphorous was detected on the Au-coated area on Ti/Au by the EDS measurement. That is, the total amount of the precipitated calcium phosphate must be lower than that of untreated Ti because Au takes up about 40% of the whole area of the Ti/Au sample.
Therefore, we suggest that optimization for utilizing the galvanic current is still necessary for the clinical application of this technique. Segregation of the part of a medical device will also be effective: the Au coating should be applied only on the area in which there is no contact with hard tissue. In this study, we demonstrated the non-biological efficiency of the galvanic current between Ti and Au; the acceleration of calcium phosphate formation can be achieved by this technique. However, consecutive electric stimulation with slight galvanic current is generated through different metals and might influence biological activities of cells. Thus, it would be worthwhile to conduct further investigation of not only bioactivity with body fluids but also biological proper-ties to apply this technique to the development of novel biomaterials.
4. Conclusion
A galvanic current between Ti and Au is possibly useful to enhance the hard-tissue compatibility of Ti. The galvanic current between the Ti and Au electrode in Hanks’solution varied in the Ti- and Au-exposed area and was at its maximum in the Ti/Au area ratio. Calcium phosphate formation on Ti was accelerated by a constant anodic current from an outer power source and the actual galvanic current generated on partially Au-coated Ti. The amount and formation rate of maturing calcium phosphate increased by the anodic current. An electric stimulation system based on a galvanic current between Ti and Au in this study has potential as an advanced technique for the development of novel metallic biomaterials.
Relative concentration (mol%)
0
1
2
3
4
5
Ca
: 0
µ
A cm
−2: 0.5
µ
A cm
−2: 1.0
µ
A cm
−2P
Fig. 8 Relative concentrations of Ca and P on Ti with/without galvanostatic polarization determined by XPS.
20
µ
m
Fig. 9 Calcium phosphate precipitates formed on the Ti area of the Au-coated Ti sample after 7 d immersion in Hanks solution.
Relative concentration (mol%) Atomic ratio of Ca fo P
,
Ca
/
P
0 0.5 1 1.5 2
0 0.5 1 1.5 2
Ti Ti area on Ti/Au
Au area on Ti/Au
[image:6.595.325.527.66.234.2]Ca P Ca/P
[image:6.595.77.262.68.251.2] [image:6.595.55.281.305.477.2]Acknowledgments
This study was performed under the inter-university cooperative research program of the Institute for Materials Research, Tohoku University. This study was also supported by a grant-in-aid for Challenging Exploratory Research No. 17659607 by Japan Society for the Promotion of Science.
REFERENCES
1) T. Hanawa:Jpn. J. Dent. Sci. Rev.46(2010) 93101.
2) A. Yuda, S. Ban and Y. Izumi:Dent. Mater. J.24(2005) 588595.
3) K. Kuroda, M. Moriyama, R. Ichino, M. Okido and A. Seki:Mater. Trans.49(2008) 14341440.
4) M. Hosaka, Y. Shibata and T. Miyazaki:J. Biomed. Mater. Res. Part B 78B(2006) 237242.
5) Y. Tanaka, E. Kobayashi, S. Hiromoto, K. Asami, H. Imai and T. Hanawa:J. Mater. Sci. Mater. Med.18(2007) 797806.
6) T. Hayakawa, M. Kawasaki and G. H. Takaoka:J. Ceram. Soc. Jpn.116 (2008) 6873.
7) R. Narayanan, S. K. Seshadri, T. Y. Kwon and K. H. Kim:Scr. Mater. 56(2007) 229232.
8) R. Narayanan, T. Y. Kwon and K. H. Kim:J. Biomed. Mater. Res. Part B85B(2008) 231239.
9) R. Narayanan, T. Y. Kwon and K. H. Kim: Mater. Sci. Eng. C28 (2008) 12651270.
10) R. Narayanan, S. Y. Kim, T. Y. Kwon and K. H. Kim: J. Biomed. Mater. Res. Part A87A(2008) 10531060.
11) X. W. Meng, T. Y. Kwon and K. H. Kim:Dent. Mater. J.27(2008) 666671.
12) D. Richard, N. Dumelié, H. Benhayoune, S. Bouthors, C. Guillaume, N. Lalun and G. Balossier:J. Biomed. Mater. Res. Part B79B(2006) 108115.
13) D. Y. Lin and X. X. Wang:Surf. Coat. Technol.204(2010) 32053213.
14) R. Hu, C. Lin, H. Shi and H. Wang:Mater. Chem. Phys.115(2009) 718723.
15) X. Pang and I. Zhitomirsky:Mater. Charact.58(2007) 339348.
16) K. L. Ou, J. Wu, W. F. T. Lai, C. B. Yang, W. C. Lo, L. H. Chiu and J. Bowley: J. Biomed. Mater. Res.92A(2010) 906912.
17) A. N. Zengo, C. A. L. Bassett, G. Prountzos, R. J. Pawluk and A. Pilla:
J. Dent. Res.55(1976) 383390.
18) I. Yasuda: Clin. Orthop.124(1977) 58.
19) K. Asami:J. Electron. Spectrosc.9(1976) 469478.
20) D. A. Shirley: Phys. Rev. B5(1972) 552556.
21) K. Asami, K. Hashimoto and S. Shimodaira: Corros. Sci.17(1977) 713723.
22) K. Asami and K. Hashimoto:Corros. Sci.24(1984) 8397.
23) K. Asami, S. C. Chen, H. Habazaki, A. Kawashima and K. Hashimoto:
Corros. Sci.31(1990) 727732.
24) K. Asami, M. S. De Sá and V. Ashworth: Proc. 6th European Symposium on Corrosion Behavior of Amorphous NiCrPB alloys, (1985) pp. 769778.
25) K. Hashimoto, M. Kasaya, K. Asami and T. Masumoto: Corros. Eng. 26(1977) 445452.
26) J. S. Hammond, J. W. Holubka, J. E. DeVries and R. A. Dickie:Corros. Sci.21(1981) 239253.
27) K. Asami and K. Hashimoto:Corros. Sci.17(1977) 559570.
28) C. D. Wagner:Practical Surface Analysis, 2nd ed., ed. by D. Briggs and M. P. Seah (Wiley, New York, 1990) pp. 595634.
29) T. Hanawa and M. Ota:Biomaterials12(1991) 767774.
30) T. Hanawa and M. Ota:Appl. Surf. Sci.55(1992) 269276.