Work Hardening and Microstructural Development
during High-Pressure Torsion in Pure Iron
Akihide Hosokawa
1,+, Seiichiro Ii
1and Koichi Tsuchiya
1,21Structural Materials Unit, Research Center for Strategic Materials, National Institute for Materials Science,
Tsukuba 305-0047, Japan
2Graduate School of Pure and Applied Sciences, University of Tsukuba, Tsukuba 305-8577, Japan
The work hardening behavior and the developments of microstructure and crystallographic texture during high-pressure torsion (HPT) in pure iron were investigated. A set of the 3D electron backscatter diffraction (EBSD) measurements were also performed to characterize the microstructure in 3D using an orthogonally arranged focused ion beam-scanning electron microscope (FIB-SEM) instrument. It was found that the image quality (IQ) values of the EBSD data obtained by the FIB-SEM are better compared to the conventional mechanical polishing procedure. A detailed analysis on the distribution of misorientation angle was performed, beingfitted with the Mackenzie plot. The use of the Hencky equivalent strain made it possible to compare the work hardening behaviors and the microstructural evolutions observed in the current investigation with those reported for accumulative roll bonding (ARB). This comparison has revealed that the HallPetch coefficientkobtained by HPT deformation drastically increases with the grain refinement by HPT deformation. [doi:10.2320/matertrans.M2013462]
(Received December 26, 2013; Accepted April 21, 2014; Published June 25, 2014)
Keywords: severe plastic deformation, electron back-scattered diffraction (EBSD), three dimensional electron back-scattered diffraction (3D-EBSD), work hardening, Hencky strain, cut and see
1. Introduction
Ultrafine grained (UFG) metals with an average grain size below 1 µm are known to exhibit excellent strength and reasonable ductility. It is widely known that severe plastic deformation (SPD) such as high-pressure torsion (HPT) is a promising method to produce UFG metals.14) The grain
refinement for various metallic materials by HPT have been extensively reported by numerous authors,1,57) and the
knowledge for the resultant mechanical properties and the microstructure formed after HPT deformation have been well established.
Meanwhile, for pure bcc iron, the evolution of mechanical properties and microstructure during HPT deformation is not well understood. A few investigations have been performed on the texture development by HPT deformation,811) but they involve some drawbacks. The works by Valiev et al.8)
and by Edalati et al.9) presented detailed microstructural
developments during HPT deformation by TEM, but no crystallographic texture analysis was performed. The work by Descarteset al.10)presented a detailed study on the
develop-ment of the microstructure/texture for pure iron during HPT deformation by means of electron back-scatter diffraction (EBSD) measurements, but the imposed hydrostatic pressure is only 500 MPa. This pressure is much smaller than the other experimental investigations (Typically several GPa. See Refs. 5, 7, 8) for examples), making us wonder if the results reported in Ref. 10) is truly comparable with the other works for HPT deformation in the literature. Ivanisenko et al.11)
also performed TEM and SEM/EBSD study, showing the development of microstructures and texture as well as the grain boundary character distribution by misorientation
angles for Armco iron. However, that EBSD analysis has focused on the grain morphologies, and no analysis was performed on the crystallographic texture formed by HPT deformation. It is thus reasonable to conduct a set of EBSD analyses to investigate the crystallographic texture formed by HPT deformation in bcc iron.
Deformation texture due to simple shear or torsion has been studied by several researchers,12,13) whereby the
maximal equivalent strain applied was about 5. One of the advantages of HPT deformation over conventional torsion tests is that HPT can apply infinite strain avoiding material’s failure because of a high quasi-hydrostatic pressure. It is thus expected that HPT deformation makes it possible to apply much larger strain to bcc iron than those reported in Refs. 12, 13). It would be interesting to investigate whether the deformation textures formed by conventional torsion and HPT deformation differ or not.
Moreover, it is of particular interest to compare the work-hardening behavior and the development of microstructure and texture in bcc iron at such large strain between several different deformation modes such as HPT, wire drawing and accumulative roll bonding (ARB). These three deformation methods are capable of applying quite large equivalent plastic strain, and the experimental results for wire drawing and ARB are available in the literature.3,14,15)
The aim of the current study is to investigate the work hardening behavior and the evolutions in microstructure and texture for pure iron during HPT. Furthermore, an attempt was made to characterize the 3D grain morphology by 3D-EBSD technique using the recently developed FIB-SEM dual beam instrument.16)This technique can potentially clarify the influence of the 3D grain morphology on work hardening behavior. The obtained work hardening behavior is compared with those reported for other deformation modes in the literature.
+Corresponding author, E-mail: hosokaa@mech.kyushu-u.ac.jp. Present
address: Department of Mechanical Engineering, Kyushu University, Fukuoka 819-0395, Japan
0.2 rpm. The number of HPT turns, N, ranged from 0.5 to 10.
The deformed discs were cut into two half discs, and then embedded in resin for cross-sectional metallography by optical microscopy (OM) and by scanning electron micro-scope (SEM) equipped with electron backscatter diffraction (EBSD) system. The same samples were also subjected to the Vickers microhardness testing. The surface was finished by 0.5 µm colloidal silica for EBSD analyses, and further etched by nital (HNO3: ethanol¼1 : 9) for optical microscopy. Vickers microhardness was also measured with a load of 1.96 N on the well-polished cross sections, whereby the radial position of the individual indentations were measured to quantify the local strain.
Transmission electron microscopy (TEM) were performed using the JEOL-2010F TEM equipped with afield-emission gun operated at 200 kV. In preparing the TEM foils, circular discs with a diameter of 2 mm were cut out of the HPTed discs. The thickness of those discs were then reduced to 0.1 mm by mechanical grinding the outer regions from both the sides so that the discs are taken out from the central region along the thickness direction. Each disc was then glued on a Pt grid. The inner diameter of a grid was 0.5 mm while the outer diameter was 3 mm. Afterward, twin-jet electropolishing was performed to prepare TEM foils using an electrolyte composed of 10% HCl4 and 90% ethanol
at 253 K.
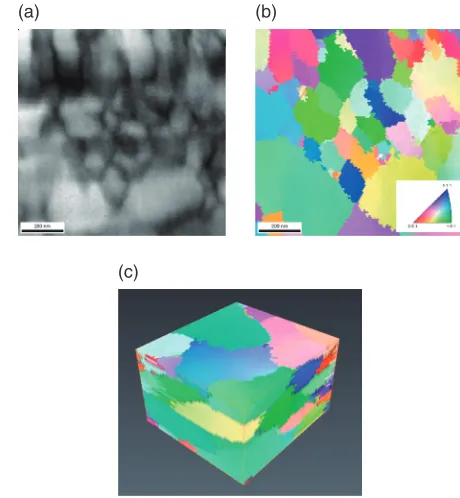
The 3D-EBSD measurements were carried out for the sample after HPT (N=10,r=4 mm) using an orthogonally arranged FIB-SEM instrument16) to characterize the micro-structure as well as the crystallographic orientation in 3D. A rectangular piece (2 mm©2 mm©0.85 mm) was cut out of the HPTed sample, followed by mechanical polishing and electropolishing using the same electrolyte for TEM samples at 253 K. The acceleration voltages for SEM and FIB were 15 and 30 kV, respectively. The FIB current was set to 600 pA during the serial sectioning for the 3D-EBSD measurement. The measurement time for the whole single process to collect a series of the 2D-EBSD scans was approximately 14 h. To prevent the drift during this long-term measurement, a marker point was used for the drift correction. The marker point was created by depositing carbon in the small square form at the vicnity of the area of interest. A series of the collected 2D inverse pole figure (IPF) maps were used to visualize a 3D image using a commercial software Avizo. The size of a non-isotropic voxel is 1.96 nm©1.96 nm©10 nm, and the total visualized volume is 588 nm©625 nm©390 nm. The total number of the EBSD scans for this 3D visualization was thus 39.
£¼
t ð1Þ
where r is the distance from the center along the radial direction,Nthe number of turns, andtis the thickness of the disc. The equivalent strainheq is obtained by substituting£ into the following equation.18)
heq¼p1ffiffiffi3ln 2þ£
2þ£pffiffiffiffiffiffiffiffiffiffiffiffiffi4þ£2
2
!
ð2Þ
According to the recent review by Onaka,18) this equivalent strain heq for simple shear deformation is essentially the same with the so-called von Mises equivalent strain,¾V:M:, and thus it can be used as a convenient measure of strain for large scale deformation to compare different deformation modes. Thus one can compare the value ofheq
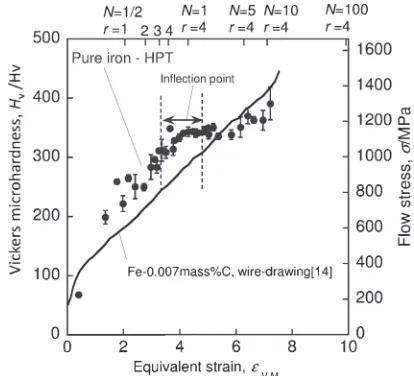
[image:2.595.322.529.560.748.2]calculated for an HPT deformation with the axial logarithmic strain of wire drawing, ¾V:M:¼lnðA0=AÞ where A0 is the initial cross sectional area of the sample and A the current cross sectional area. The result of the comparison is shown in Fig. 1, where the evolution of the microhardnessas a function of this equivalent strain is shown. The inevitable preliminary deformation by compression (equivalent strain ³0.4) was included in the equivalent strain. Note that the strain in an HPT disc is dependent on the distance from the center along the radial direction r, and also dependent on the number of turns, N. The Vickers microhardness data points shown in Fig. 1 were measured from the various different positions of the various different discs (i.e., different r, different N) to illustrate the continuous evolution of the hardness as a
function of equivalent strainheq. Theflow stress (in MPa) is also indicated in the secondaryy-axis, which was calculated from the following equation.19)· ’3:33Hv, whereHv is the
value of the Vickers microhardness. Since the curve obtained from the evolution in hardness shown in Fig. 1 is equivalent to the uniaxial stressstrain curve of electrolytic pure iron, this can be compared with the stressstrain curve for ultra-low carbon steel obtained by repeated wire-drawing process-es14)shown in the solid line. The stressstrain curve obtained for the HPT samples was found to show an almost linear hardening behavior and then shows an inflection at around
heq¼34, above which the rate of hardening became
significantly lower, while the curve for a wire-drawn sample kept exhibiting linear work-hardening up to heq7. Similarly, good agreement was observed between wire-drawing and HPT deformations below heq¼34, but the agreement suddenly poor with further deformation. This disagreement will be further discussed in later section.
3.2 Evolution in microstructure 3.2.1 Optical microscopy
The evolution of microstructure due to the HPT deforma-tion was first characterized by OM as shown in Fig. 2. The grain structure is clearly seen in the sample before HPT deformation. These microstructure drastically evolves with HPT deformation, particularly in the perimeter region of the discs. Although the grain structure marginally remains in the central region, it was found that those grain boundaries become invisible with optical microscopy even after just a half turn of HPT deformation. Electron microscopy is definitely required to investigate the microstructure in these regions.
3.2.2 TEM
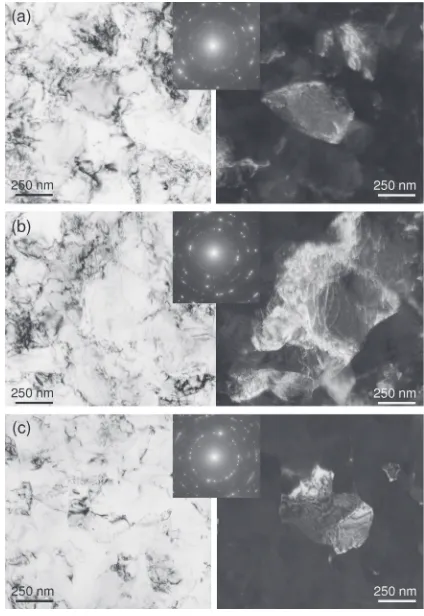
The microstructures of the perimeter (r=4 mm) of the HPTed discs were observed by TEM as shown in Fig. 3. The approximate average grain size was estimated to be 200 nm, which was found not to change with the increasing strain further. This tendency is consistent with the more quantitative results obtained by means of SEM/EBSD as will be shown later. Another remarkable point is that the dislocation density does not drastically differ between the samples after HPT deformation with various different number of turns, N. It seems that the dislocation density stops increasing around the
heq¼4, bringing no significant contribution to the increase
inflow stress any further.
3.2.3 SEM/EBSD
SEM/EBSD measurements were carried out to investigate the crystallographic texture as well as the microstructure more quantitatively. The evolutions in IPF maps and the corresponding IPFs with the increasing strain are shown in Fig. 4. Note that the grain boundary maps were super-imposed on the IPF maps. In thisfigure, the evolutions in the microstructures and the texture with an increasing distance from the centerris presented. It can be seen from the grain boundary maps that the low angle grain boundary (LAGB= boundaries with misorientation angle 2°<ª<15°, indicated by the thin lines) and the high angle grain boundary (HAGB=misorientation angle 15°<ª<180°, indicated by the thick lines) are almost equally mixed at the strain of
Fig. 2 The evolution of microstructure with the increasing number of turns,N.
[image:3.595.138.459.69.212.2] [image:3.595.320.532.252.560.2]EBSD analyses. Considering the local deformation mode, it would be natural that the shear plane is perpendicular to the thickness direction of the HPT discs and the shear direction is parallel to the hoop direction in HPT deformation. Similarly, the shear plane should be parallel to the rolling plane and the shear direction should be parallel to the rolling direction if neglect the local strain concentration in the vicinity of the sheet surfaces. However, a clear feature of the deformation texture formed by HPT deformation beyond the strain of
heq4shown in Fig. 4(b) is that©110ªis parallel to the disc
normal (thickness direction), which differs from the deforma-tion texture components observed on the sheet normal planes in cold-rolled bcc iron. The texture component pointing in the hoop direction (which corresponds to the shear direction) is also ©111ª with some scatter. Indeed, several researchers have reported that torsion of ferritic steels results in shear deformation texture that is composed of {110}©112ª and
{110}©001ª.12,13) These texture components are consistent
with those observed in the current EBSD analysis, and also explain the inflection point in work hardening atheq4.
The distribution of misorientation angle ª also changes with increasing strain as shown in Fig. 5. As was qualitatively demonstrated in the grain boundary maps in Fig. 4, the boundaries with misorientation angle below 15° were found to be more frequently counted when the strainheq is small. By the time strain exceedsheq¼4, the frequencies of the HAGBs becomes much higher showing good agree-ment with the Mackenzie model.20)
One may notice that there are three spikes in the distribution (i.e., abnormally high number fraction) at the misorientation angles of 30, 45 and 60° which are quite close to the angles of the coincidence site lattice (CSL) boundaries of 13b, 19b and 3, respectively. Several researchers however pointed out that these peaks are artifacts originated from misindexing by the software.21) We therefore do not
pursue further discussion about these peaks. It seems conclusive, at least based on the EBSD observation from the cross-section, that misorientation of the grain boundaries becomes randomized after the strain heq exceeds 3.
3.2.4 3D EBSD
The three dimensional morphology of individual grains after HPT (heq¼6:96) was visualized by 3D EBSD technique as shown in Fig. 6. Figures 6(a) and 6(b) show a typical IQ map and an IPF map of each 2D scan while Fig. 6(c) is the visualized 3D image from a series of the collected 2D EBSD scans. It is remarkable that the IQ values obtained from the surface milled by FIB (13806710) were found to be higher than those obtained for the mechanically polished surface (5003400). Removal of sample surface
successful example of 3D visualization of UFG pure iron fabricated by HPT deformation has ever been reported in literature and thus the current result is considered to be quite precious. Although the orientation is indicated based on the color key in thisfigure, it is of course possible to assign the other parameters that are used in conventional EBSD analyses such as IQ, Kernel Average Misorientation (KAM) and so on. It has been reported that the grains are generally elongated along the shear direction after HPT (see Ref. 22) for example). In the current 3D image, however, the grains do not appear elongated very much.
4. Discussion
4.1 Inflection point observed in Vickers hardness result
It is of interest to discuss the origin of the inflection point of the work hardening behavior as observed in Fig. 1. Beyond this inflection point, the work hardening behavior obtained with HPT deformation clearly differs from that for wire-drawing. Such an inflection can also be found in a classical work by Younget al.,23)whereby they compared the stress
strain curves for torsion (without hydrostatic pressure) and wire drawing in Fe0.17 mass%Ti alloy. That paper demon-strated that the work hardening in torsion ceases at around
¾V:M: (i.e., heq)³2 while that for wire drawing continues
to exhibit work-hardening. Gil Sevillano et al.17)mentioned the possibility that this linear hardening observed in wire drawing is due to the development of©110ªfiber texture being parallel to the drawing axis. Such a texture is of course never formed by torsion, as confirmed by the texture analysis on steels after torsion.12,13) This is consistent with our current
EBSD result.
One might be curious about the microstructures (i.e., grain morphology) formed by wire-drawing and torsion. The detailed micrographs of the microstructure are provided in Refs. 14, 23) In wire-drawing, the grains are elongated along the drawing direction while the thickness of the grains keep decreasing all the way up to 100 nm at the equivalent strain of 7. Although the grain size of the pure iron formed by wire-drawing is surely smaller than that for the HPTed iron, the linear hardening behavior observed in wire-drawing cannot be explained solely by the grain size. The microstructure formed by torsion is not very different from those observed by the current observation for the HPTed iron.23) It is therefore concluded that the inflection in the equivalent stress strain curve in Fig. 1 is ascribed to the texture formed by torsion.
£=pffiffiffi3), the disagreement between the stressstrain curve obtained by HPT and that of wire-drawing becomes more significant. It follows that the Shrivastava strain seriously overestimates the actual strain and thus is not an appropriate measure of shear deformation especially for heq>4. The current authors are aware of that the research group of Jonas and his co-workers have been claiming that the use of the Hencky strain (the version recommended by Onaka18,25))
is not applicable for large simple shear deformation.26,27) However, Onaka25)pointed out that the version recommended
by Jonas and his co-workers, £=pffiffiffi3, is indeed a nominal equivalent strain which is not appropriate when we deal with large deformation. Moreover, we feel that the current results shown in Fig. 1 support the viewpoint of Onaka.18,25)
Fig. 4 The evolutions of IPF maps and the corresponding IPFs with increasing equivalent strain. The maximal intensity of each IPF,Imaxis also indicated. The scale bars represent 1 µm.
Fig. 5 The evolution in the distribution of misorientation angle with increasing equivalent strain.
(a) (b)
(c)
[image:5.595.147.449.69.345.2] [image:5.595.48.290.390.633.2] [image:5.595.307.537.393.642.2]4.2 Evolution in microstructure: HPT vs. other defor-mation methods
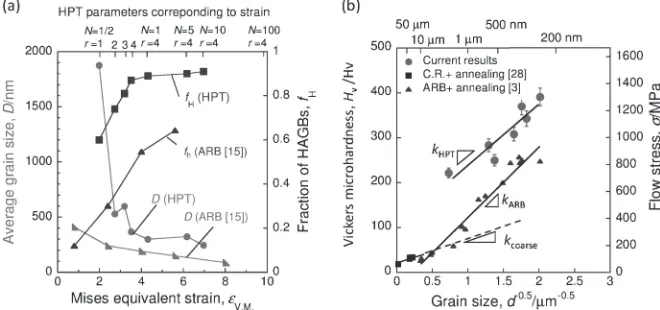
To discuss the ratio between the amounts of LAGBs and HAGBs more quantitatively, the fraction of HAGBs,fH(i.e., defined by the ratio of the number of HAGBs to the total number of grain boundaries) is plotted as a function of equivalent strainheqas shown in Fig. 7(a). The evolution of grain size is also plotted in the samefigure. ThefHincreased rapidly and reached the saturation value of about 90% at
heq4, and further deformation does not seem to change the
fH. The grain refinement proceeded rapidly with increasing
strain in the beginning of deformation, and then the rate of grain refinement significantly slowed down beyond heq¼
34. The grain size then very gradually decreased with further deformation, except for a slight increase at heq¼
6:16, andfinally reaches the minimum grain size of 254 nm at
heq¼6:96.
As was done by Young et al.,23) it is worth trying to compare these tendency obtained by HPT with a similar set of data obtained by other deformation modes, for example, ARB.15)The von Mises equivalent strain after ten passes of ARB is 8, which is comparable with the equivalent strain applied by HPT with N=30 and r=5 mm. The data obtained for IF (=Interstitial-Free) steels deformed at room temperature by ARB reported by Kamikawa and Tsuji are also plotted in Fig. 7(a) for a comparison. It seems that ARB can reduce the grain size (=lamellae thickness) slightly more effectively than HPT around equivalent strain 47 while the value of fHdoes not increase as steeply as HPT.
4.3 HallPetch relation
Now that the grain size and the microhardness and theflow stress of the HPTed iron samples are known, a HallPetch plot can be produced as shown in Fig. 7(b). The HallPetch plot for IF steels whereby the grain size was controlled by post-ARB annealing treatments3) is also indicated as a reference. The HallPetch coefficient of the HPTed iron,
kHPT, was estimated to be 447 MPa(µm)¹0.5. Here, it is worth
comparing this value with those in literature. Significant amount of works on HallPetch coefficients on ferritic steels have been reported for example by Takaki and his co-workers.2830)As reported by them, the HallPetch coefficient
is highly influenced by contents of carbon and nitrogen. Takeda et al.28) proposed that the relation between the k
(MPa(µm)¹0.5) value and the carbon content Cppm(ppm) is provided by the following equation.
k¼100þ120Cppm ð3Þ
The k value for the pure iron used in the current study (12 ppm C) is then estimated from this equation as 359 MPa(µm)¹0.5, which is not as large as the value ofk
HPT. This
higherkvalue in the HPTed samples (kHPT) might be due to
the grain refinement, as for example proposed by Kamikawa
et al.4) They have performed a series of tensile tests for
ARBed pure Al samples and reported that a significantly larger k value for UFG Al was obtained compared to conventional pure Al containing much coarser grains. They ascribed this extraordinarykvalue to the depletion of mobile dislocations in the highly refined grains. It is thus not very unnatural to consider that the higher kvalues are obtained also in bcc iron due to the similar mechanism. In fact, Tsuji
et al.3) reported that the HallPetch coefficient for IF steel obtained by ARB and the post-deformation annealing treatments was estimated as kARB=500 MPa(µm)¹0.5 as shown in Fig. 7(b). This is markedly higher than the value reported by Takaki and his co-workers,28,30) whereby they
estimated the k value for IF steel with coarser grains to be around 180 MPa(µm)¹0.5. This value k
coarse and the
corresponding data points are also plotted in Fig. 7(b). The difference between kARB and kcoarse also supports the idea that the HallPetch coefficient is enhanced by grain refinement.
Another remarkable point is that the interceptions are quite different between the slopes of the HPTed and ARBed samples but nevertheless their inclinations are relatively similar. The interceptions in thisfigure represent the strength independent of the grain boundary strengthening mechanism. In this particular situation, the main contribution is presumably due to the intragranular dislocations that would have been annihilated by post-ARB annealing. Hence, it is supposed that the density of the intragranular dislocations in as-HPTed samples is higher than in the samples after the post-ARB annealing treatments, resulting in the the differ-ence in the interceptions.
[image:6.595.132.462.72.227.2]4.4 3D grain morphologyvs.work hardening behavior
The biggest advantage of the 3D-EBSD technique is that the 3D morphology of the grains can be visualized. Work hardening behavior is probably influenced by the evolution of the grain morphology during deformation. Unfortunately, we have performed the 3D-EBSD measurement only for on single HPTed sample (heq¼6:96) at this moment. It is thus difficult to discus how the 3D grain morphology affect the work hardening behavior from the current investigation. Nevertheless, it is remarkable that the 3D-EBSD technique allows us to visualize the 3D grain morphology in the as-HPTedfine grained structure with a quite good IQ value. The 3D observations of the region with much lower strain (heq¼12) are the tasks to be performed, providing a solution to the discussion here.
5. Conclusions
The work hardening behavior of pure iron was studied by coupling the HPT deformation with Vickers microhardness testing. Moreover, the microstructure and the texture development during HPT deformation were also investigated by means of the EBSD technique. The 3D EBSD technique also successfully visualized the 3D grain structure and the orientations of the UFG pure iron produced by HPT deformation. Work-hardening in iron observed in HPT was found to be less than that of wire drawing probably due to the different deformation texture. The final texture obtained by HPT is{110}being parallel to the disc plane which prevents the linear work hardening beyond the equivalent strain
heq4, resulting in an inflection in the equivalent stress
strain curve. The distribution of misorientation angle becomes quite randomized, showing good agreement with the Mackenzie plot at larger strain. The grain size seems to keep decreasing moderately up to heq7, following the rapid grain refinement up to heq¼4. It was found that the HallPetch coefficient (k) obtained in the HPTed pure iron becomes much larger due to the significant grain refinement, showing reasonable agreement with thekobtained by ARB. It is the Hencky strain that makes it possible to compare the magnitude of the accumulative plastic strain applied by HPT with that by ARB.
Acknowledgment
This work is supported by a Grant-in-Aid for Scientific Research from the MEXT, Japan, in Innovative Areas“Bulk
Nanostructured Metals”. Ms. Yuka Hara is acknowledged for her assistance in the FIB-SEM experiments. The authors thank Dr. Julien Rosalie for his valuable comments and proof reading.
REFERENCES
1) R. Z. Valiev, R. K. Islamgaliev and I. V. Alexandrov:Prog. Mater. Sci.
45(2000) 103189.
2) M. A. Meyers, A. Mishra and D. J. Benson:Prog. Mater. Sci.51(2006) 427556.
3) N. Tsuji, Y. Ito, Y. Saito and Y. Minamino:Scr. Mater.47(2002) 893 899.
4) N. Kamikawa, X. Huang, N. Tsuji and N. Hansen:Acta Mater. 57
(2009) 41984208.
5) K. Edalati and Z. Horita:Acta Mater.59(2011) 68316836.
6) M. Hafok and R. Pippan:Int. J. Mater. Res.101(2010) 10971104.
7) Y. Todaka, M. Yoshii, M. Umemoto, C. Wang and K. Tsuchiya:Mater. Sci. Forum584586(2008) 597602.
8) R. Z. Valiev, Y. V. Ivanisenko, E. F. Rauch and B. Baudelet: Acta Mater.44(1996) 47054712.
9) K. Edalati, T. Fujioka and Z. Horita:Mater. Trans.50(2009) 4450.
10) S. Descartes, C. Desrayaud and E. F. Rauch:Mater. Sci. Eng. A528
(2011) 36663675.
11) Y. V. Ivanisenko, R. Z. Valiev and H.-J. Fecht:Mater. Sci. Eng. A390
(2005) 159165.
12) J. Baczynski and J. J. Jonas:Acta Mater.44(1996) 42734288.
13) E. Aernoudt and J. G. Sevillano: J. Iron Steel Inst.211(1973) 718725. 14) G. Langford and M. Cohen: Trans. ASM62(1969) 623638. 15) N. Kamikawa and N. Tsuji:Mater. Trans.53(2012) 3037.
16) T. Hara, K. Tsuchiya, K. Tsuzaki, X. Man, T. Asahata and A. Uemoto:
J. Alloy. Compd. (2013) S717S721.
17) J. G. Sevillano, P. van Houtte and E. Aernoudt:Prog. Mater. Sci.25
(1981) 69412.
18) S. Onaka:Philos. Mag. Lett.90(2010) 633639.
19) R. Hill: The Mathematical Theory of Plasticity, (Oxford University Press, 1950).
20) J. K. Mackenzie:Biometrika45(1958) 229240.
21) A. A. Gazder, W. Cao, C. H. J. Davies and E. V. Pereloma:Mater. Sci. Eng. A497(2008) 341352.
22) A. Hohenwarter and R. Pippan:Mater. Sci. Eng. A527(2010) 2649 2656.
23) C. M. Young, L. J. Anderson and O. D. Sherby:Metall. Trans.5(1974) 519520.
24) S. C. Shrivastava, J. J. Jonas and G. Canova:J. Mech. Phys. Solids30
(1982) 7590.
25) S. Onaka:Philos. Mag.92(2012) 22642271.
26) S. C. Shrivastava, C. Ghosh and J. J. Jonas:Philos. Mag.92(2012) 779786.
27) J. J. Jonas and S. C. Shrivastava:Mater. Trans.54(2013) 415416.
28) K. Takeda, N. Nakada, T. Tsuchiyama and S. Takaki: ISIJ Int. 48
(2008) 11221125.
29) S. Takaki, K. Kawasaki and Y. Kimura:J. Mater. Process. Technol.117
(2001) 359363.