Solvent Extraction of Sm from Chloride Solution
with PC88A and Saponified PC88A
Man-Seung Lee
1;, Gwang-Seop Lee
1, Jin-Young Lee
2,
Sung-Don Kim
2and Joon-Soo Kim
21Dept. of Advanced Materials Science & Engineering, Mokpo National Univ., Chonnam 534-729, Korea 2Division of Minerals Utilization and Materials, Korea Institute of Geoscience and Mineral Resources,
Taejon 305-350, Korea
In this study, solvent extraction experiments of Sm from a chloride solution with PC88A and with partially saponified PC88A were performed. The extraction reaction of Sm with PC88A was identified from the experimental data using a graphical method. A chemical model was then developed to predict the distribution coefficients of Sm for its extraction with the saponified PC88A. In the experimental ranges conducted in this study, the equilibrium constants for the solvent extraction of Sm with PC88A and with the saponified PC88A were estimated through an analysis of the ionic equilibria.
(Received August 5, 2004; Accepted November 26, 2004)
Keywords: SmCl3, PC88A, extraction, saponification, equilibrium constant
1. Introduction
Samarium is used as the raw material, in oxide form, for a ceramic condenser and magnets. Since the chemical natures of rare earth elements are very similar to one another, their mutual separation and purification is difficult. Solvent extraction is employed on an industrial scale to separate the rare earth elements. Acidic organophosphrous extractants, such as D2EHPA and PC88A, are widely used in this separation.1–6)Of these two extractants, PC88A is known to
have a higher loading capacity and to yield a higher separation factor.7)
In the solvent extraction of metals with acidic extractants, the concentration of hydrogen ions in the aqueous phase increases owing to the exchange reaction of the hydrogen ions in an acidic extractant with the extracted metal species. This increase in the concentration of hydrogen ions would diminish the driving force for the solvent extraction of metals. To overcome this problem, the saponification of acidic extractants with a base substance and the effect of the saponification of an extractant on the solvent extraction were studied.8–11)
Few studies, however, have been performed on the chemical model for the solvent extraction of metals with the saponified extractant. A study on this can predict the distribution coefficients of metals from the initial extraction conditions. In this study, therefore, solvent extraction experi-ments of Sm from a chloride solution with PC88A and with partially saponified PC88A were conducted. From the experimental results, the solvent extraction reaction was identified using a graphical method. A chemical model was then developed to predict the distribution coefficients of Sm from the extraction conditions with the saponified PC88A.
2. Experimental
SmCl3 solution was prepared by dissolving Sm2O3
(99.9%, Strem Chemicals) in an excess HCl solution. The excess HCl was evaporated to the point of dryness, and a
small amount of HCl solution was added to adjust the acidity of the solution. PC88A was diluted with kerosene, and all the chemicals were of reagent grade. Saponified PC88A was prepared by adding the requisite quantities of the NaOH solution to the PC88A in kerosene. The resulting mixture was stirred for 48 hours. During the solvent extraction experi-ments with the saponified PC88A, the degree of the saponification was kept at 40%.
The phase ratio was kept at unity in all solvent extraction experiments. Equal volumes of aqueous and organic solu-tions were placed in a 100 cm3separatory funnel and shaken
for an hour at ambient temperature with a wrist action shaker. The mixture was allowed to settle for 24 h, after which the aqueous phase was separated from it. Then, solution pH was measured using a pH meter (Fisher Accumet pH model 620). The concentration of Sm in the aqueous phase was measured using ICP-AES (Spectrflame, EOP), while that of Sm in the organic phase was calculated by using mass balance.
3. Results and Discussion
3.1 Solvent extraction reaction of Sm with PC88A
Figure 1 shows the effect of equilibrium pH on the distribution coefficient of 0.086 kmol/m3 Sm at different PC88A concentrations within the initial pH range of 1.2 to 2.4. It shows that the distribution coefficients of Sm increase linearly with an increase in the equilibrium pH. The slope of the graph is 3, indicating that three moles of hydrogen ion in PC88A are exchanged for one mole of Sm extracted into the organic phase.
Figure 2 shows the variation in the distribution coefficients of Sm with PC88A concentration, when the initial concen-tration of Sm is 0.072 kmol/m3 and the initial pH of the
solution is 0.8. This shows that the distribution coefficients of Sm increase rapidly with the concentration of PC88A.
The solvent extraction reaction of Sm from a chloride solution with PC88A was identified using a graphical method. In an acid solution, Sm extraction with PC88A may be represented by the following equation:
Sm3þþð3þxÞ
2 H2A2,orgSmA3xHAorgþ3H
þ ð1Þ
where H2A2 represents the PC88A dimer and the subscript
org denotes the organic phase.
Upon inserting the definition of distribution coefficientD
into the equilibrium constantKex, for the above reaction and
taking the logarithm on both sides, the equation becomes
logD3pH¼ð3þxÞ
2 log½H2A2 þlogKex ð2Þ
where [H2A2] represents the equilibrium concentration of
PC88A, and can be obtained by the following equation:
½H2A2 ¼ ½H2A2I
ð3þxÞ
2 ½SmA3xHA ð3Þ
where superscript I represents the initial concentration. From eq. (2), it is known that the plot of logD3pH againstlog[H2A2] should give a straight line with a slope of ð3þxÞ=2. The equilibrium concentration of PC88A was calculated using eq. (3) by varying the value ofxfrom zero to 3. For an assigned value of x, the agreement between the slope of the plot and the value ofð3þxÞ=2was investigated. As shown in Fig. 3, the plot yields a straight line with a slope of 1.3 only when the value ofxis zero. From this result, it might be inferred that eq. (4) represents the solvent extrac-tion reacextrac-tion of Sm from a chloride soluextrac-tion with PC88A within the experimental ranges investigated in this study,i.e.,
½SmCl3 0:086kmol/m3, ½PC88A 3:0kmol/m3, and initial pH2:4.
Sm3þ
aqþ1.5H2A2,orgSmA3,orgþ3Hþaq ð4Þ
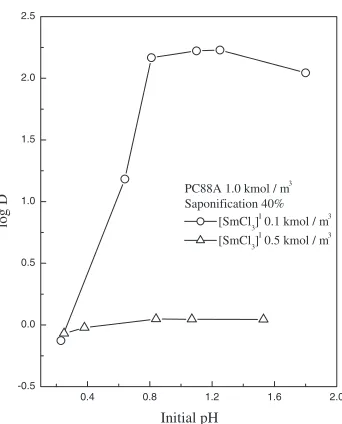
Figure 4 represents the extraction results with 40% saponified 1.0 kmol/m3 PC88A in the initial pH range of
0.25 to 1.80 when the initial concentrations of Sm are 0.1 and 0.5 kmol/m3, respectively. When the initial concentration of Sm is 0.1 kmol/m3, the distribution coefficients of Sm increase rapidly with increasing initial pH up to 0.8. The further increase in the initial pH, however, has a negligible effect on the distribution coefficients of Sm. When the initial concentration of Sm is 0.5 kmol/m3, the distribution
coef-ficients of Sm are nearly constant irrespective of the initial values of solution pH. The varied dependence of the distribution coefficient of Sm on the initial pH and on the initial concentration of Sm is attributed to the stoichiometric concentration ratio of PC88A to Sm.
3.2 Prediction of the distribution coefficients of Sm with PC88A
To predict the distribution coefficients of Sm from the initial extraction conditions, the equilibrium concentrations of the chemical species in both phases after extraction should be known. Table 1 shows the complex formation reactions considered in this study for SmCl3 solution.12) When the
0.5 0.6 0.7 0.8 0.9 1.0
-0.2 0.0 0.2 0.4 0.6 0.8 1.0
log D
eq. pH
PC88A 1.0 kmol / m3 2.0 kmol / m3 3.0 kmol / m3
Fig. 1 Effect of equilibrium pH on the distribution coefficients of Sm at different PC88A concentrations. (½SmCl3I¼0:086kmol/m3).
0.5 1.0 1.5 2.0 2.5 3.0
-0.8 -0.6 -0.4 -0.2 0.0 0.2 0.4
Initial pH = 0.8
log D
PC88A concentration, / kmol·m-3
Fig. 2 Effect of PC88A concentration on the distribution coefficients of Sm at 0.072 kmol/m3Sm concentration.
0.3 0.6 0.9 1.2 1.5
-2.8 -2.4 -2.0 -1.6
-1.2 slope = 1.3
correlation coefficient = 0.92
log D - 3 pH
log [H
2A2]eq, / kmol·m -3
[image:2.595.339.517.73.287.2] [image:2.595.86.257.73.282.2] [image:2.595.85.258.336.554.2]complex formation reactions shown in Table 1 are consid-ered, there would be 10 chemical species in both phases after extraction, namely, Sm3þ, SmCl2þ, SmOH2þ, Sm(OH)
2þ,
Sm(OH)3, Hþ, Cl, OH, SmA3, and H2A2. Ten
independ-ent equations are needed to calculate the equilibrium concentration of these chemical species. The following mass and charge balance equations are obtained from the complex formation reactions shown in Table 1 and from the solvent extraction reaction, eq. (4), when the volume ratio of aqueous to organic phase is unity.
½SmI ¼ ½Sm3þ þ ½SmCl2þ þ ½SmOH2þ
þ ½Sm(OH)2þ þ ½Sm(OH)3 þ ½SmA3 ð5Þ
½ClI ¼3[SmCl3]Iþ ½HClI¼ ½Cl þ ½SmCl2þ ð6Þ
½H2A2I¼ ½H2A2 þ1.5[SmA3] ð7Þ
½Hþ þ3[Sm3þ]þ2[SmCl2þ]þ2[SmOH2þ]
þ[Sm(OH)2þ]¼ ½Cl þ ½OH ð8Þ
To make use of a mass balance equation for chloride, the initial concentration of HCl should be known. Since the excess HCl was evaporated in preparing SmCl3 stock
solution, the exact concentration of HCl was not known. Therefore, the total concentration of chloride is calculated from the initial concentration of SmCl3and initial pH. In the
aqueous phase, there would be 8 chemical species before extraction in SmCl3solution. When the initial concentration
of HCl is not known, 8 independent equations are obtained from the five complex formation reactions shown in Table 1, a mass balance equation for Sm, a charge balance equation and the value of initial pH. Once the concentration of the hydrogen ion is obtained from the initial pH, the concen-tration of the chloride ion can be calculated using the charge balance equation. The concentration of Sm3þ, in turn, can be
calculated from the mass balance equation for Sm. The concentration of SmCl2þ is calculated using the complex
formation reaction and the total concentration of chloride is equal to the sum of the concentrations of Cland SmCl2þ.
The above 10 independent equations are solved by using the Newton-Raphson method. The activity coefficients of the ions present in the aqueous phase are calculated using Bromley equation,13)while ideal behavior is assumed for the chemical species in the organic phase. With this assumption, the equilibrium constant for the solvent extraction of Sm with PC88A is represented as
Kex¼
[SmA3][Hþ]3
[Sm3þ][H 2A2]1:5
ðHþÞ
3
Sm3þ
ð9Þ
To estimate the equilibrium constant for the solvent extraction of Sm with PC88A, an evaluation function is defined as follows:
Err¼ 1 N
X
ðDcalcDmeasÞ2 ð10Þ
whereN denotes the number of experimental data andDcalc
represents the distribution coefficient of Sm calculated in this study, and Dmeas is the measured distribution coefficient of
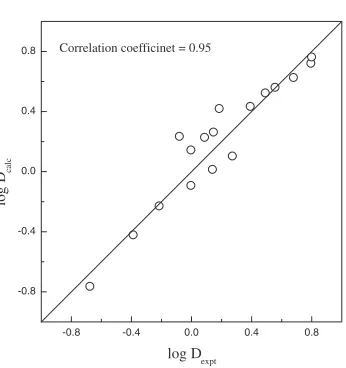
Sm. The equilibrium constant for the solvent extraction reaction of Sm with PC88A is estimated to be 0.3 by minimizing the Err function. Table 2 shows the extraction conditions and the experimental data conducted in this study. The calculated values, such as HCl concentration, equili-brium pH, and distribution coefficient of Sm, are also shown in Table 2. Figure 5 shows the measured distribution coefficients of Sm and the calculated values in this study. The correlation coefficient between the two values is 0.95, indicating good agreement between the two distribution coefficients of Sm.
3.3 Prediction of the distribution coefficients of Sm with saponified PC88A
The saponified PC88A exists as a monomer, and PC88A as a dimmer.10) The solvent extraction reaction of Sm with
saponified PC88A may be represented by
Sm3þþ3NaAorgSmA3,orgþ3Naþ ð11Þ
where NaA represents the PC88A saponified by NaOH solution.
When Sm is extracted with 40% saponified PC88A, some of it are extracted by dimeric PC88A, and the rest are extracted by the saponified PC88A. If Sm extracted by dimeric PC88A is represented as SmA3,H2A2 and Sm by
saponified PC88A as SmA3,NaA, there would be 13 chemical
species in both phases after extraction, namely, Sm3þ, SmCl2þ, SmOH2þ, Sm(OH)2þ, Sm(OH)3, Hþ, Naþ, Cl,
OH, SmA3,H2A2, SmA3,NaA, H2A2, and NaA. Thirteen
independent equations are necessary to calculate the
equili-0.4 0.8 1.2 1.6 2.0
-0.5 0.0 0.5 1.0 1.5 2.0 2.5
log D
Initial pH
PC88A 1.0 kmol / m3 Saponification 40%
[SmCl3] I
0.1 kmol / m3 [SmCl3]
I
0.5 kmol / m3
[image:3.595.84.255.69.281.2]Fig. 4 Effect of initial pH on the distribution coefficients of Sm using 40% saponified PC88A.
Table 1 Complex formation reactions considered for SmCl3solution and
the corresponding equilibrium constants at 298 K.
Reaction Equilibrium constant (logK)
HþþOH¼H
2O 14
Sm3þþCl¼SmCl2þ 2:03
Sm3þþOH¼SmOH2þ 6.16
Sm3þþ2OH¼Sm(OH)
2þ 13.92
Sm3þþ3OH¼Sm(OH)
[image:3.595.46.292.354.440.2]brium concentrations of these species. In the previous section, the 10 independent equations were obtained from the 5 complex formation reactions shown in Tables 1, 3 mass balance equations for Sm, Cl, and PC88A,; a charge balance equation,; and a solvent extraction reaction by PC88A. Therefore, three more independent equations are needed to calculate the concentrations of these 13 species.
Two equations are obtained from a mass balance equation for Na and the solvent extraction reaction, eq. (11). In adjusting the solution pH, NaOH is not added in this study. Therefore, it might be inferred that the sodium ion in the aqueous phase originates from the exchange reaction of saponified PC88A with the extracted Sm. In this case, the following relation between the concentration of Naþand that
of Sm extracted by the saponified PC88A is obtained from the stoichiometry of the solvent extraction of Sm with the saponified PC88A.
½Naþ ¼3[SmA
3]NaA ð12Þ
There are now 13 independent equations to calculate the equilibrium concentrations of chemical species from the
-0.8 -0.4 0.0 0.4 0.8
-0.8 -0.4 0.0 0.4
0.8 Correlation coefficinet = 0.95
log D
calc
log D
expt
[image:4.595.45.551.84.317.2]Fig. 5 Comparison of distribution coefficients of Sm between measured and calculated in this study.
Table 3 Measured and calculated data for the extraction of Sm with saponified PC88A.
Initial condition Measured values Calculated values
N [Sm]I [PC88A]I pHI LogD pH
eq [HCl]I pHeq LogD
1 0.1 1.0 0.64 1.18 1.25 0.32 0.51 1.59
2 0.1 1.0 0.81 2.17 3.48 0.22 0.61 1.82
3 0.1 1.0 1.10 2.22 5.01 0.12 0.75 2.14
4 0.1 1.0 1.25 2.23 4.99 0.08 0.79 2.27
5 0.1 1.0 1.80 2.04 5.18 0.02 0.89 2.53
6 0.5 1.0 0.25 0:07 0.77 0.59 0.12 0:31
7 0.5 1.0 0.38 0:02 0.84 0.46 0.19 0:25
8 0.5 1.0 0.84 0.04 1.07 0.17 0.35 0:11
9 0.5 1.0 1.07 0.04 1.14 0.10 0.39 0:08
10 0.5 1.0 1.53 0.05 1.20 0.04 0.44 0:05
[image:4.595.48.549.360.509.2]Unit of concentration: molarity
Table 2 Measured and calculated data for the extraction of Sm with PC88A.
Initial condition Measured values Calculated values
N [Sm]I [PC88A]I pHI LogD pH
eq [HCl]I pHeq LogD
1 0.072 0.5 0.80 0:68 0.69 0.223 0.74 0:76
2 0.072 1.0 0.80 0:39 0.63 0.223 0.69 0:42
3 0.072 1.5 0.80 0:22 0.59 0.223 0.66 0:23
4 0.072 2.0 0.80 0.0 0.58 0.223 0.63 0:09
5 0.072 2.5 0.80 0.14 0.51 0.223 0.61 0.02
6 0.072 3.0 0.80 0.27 0.48 0.223 0.60 0.10
7 0.086 1.0 1.60 0.0 0.89 0.0365 0.87 0.14
8 0.086 1.0 2.00 0.09 0.93 0.0146 0.89 0.23
9 0.086 1.0 2.40 0.15 0.94 0.0058 0.90 0.26
10 0.086 2.0 1.20 0:08 0.58 0.0910 0.73 0.24
11 0.086 2.0 1.60 0.39 0.75 0.0365 0.78 0.43
12 0.086 2.0 2.00 0.49 0.80 0.0146 0.80 0.52
13 0.086 2.0 2.40 0.56 0.81 0.0058 0.81 0.56
14 0.086 3.0 1.20 0.18 0.56 0.0910 0.69 0.42
15 0.086 3.0 1.60 0.68 0.72 0.0365 0.74 0.63
16 0.086 3.0 2.00 0.79 0.73 0.0146 0.76 0.72
17 0.086 3.0 2.40 0.80 0.79 0.0058 0.77 0.76
[image:4.595.85.258.573.757.2]initial extraction conditions,i.e., the initial concentration of Sm and PC88A, and the initial pH and saponification degree of PC88A. The mass balance equations for Na, Sm and PC88A are as follows:
½NaI ¼ ½NaAI¼ ½Naþ þ ½NaA ð13Þ
½SmI¼ ½Sm3þ þ ½SmCl2þ þ ½SmOH2þ
þ ½Sm(OH)2þ þ ½Sm(OH)3 þ[SmA3]H2A2
þ[SmA3]NaA ð14Þ
2[H2A2]Iþ ½NaAI ¼2[H2A2]þ ½NaA
þ3[SmA3]H2A2þ3[SmA3]NaA ð15Þ
The charge balance equation for the solvent extraction with the saponified PC88A becomes
½Hþ þ ½Naþ þ3[Sm3þ]þ2[SmCl2þ]þ2[SmOH2þ]
þ[Sm(OH)2þ]¼ ½Cl þ ½OH ð16Þ
With the assumption that the chemical species in the organic phase behave ideally, the equilibrium constant for the solvent extraction of Sm with the saponified PC88A may be represented by
K¼[SmA3][Na þ]3
[Sm3þ][NaA]3
ðNaþÞ3
Sm3þ
ð17Þ
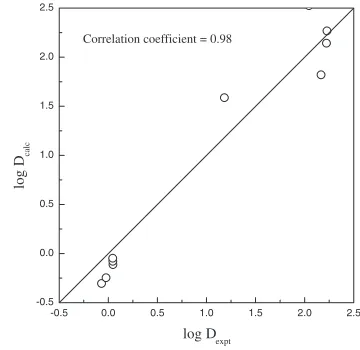
By minimizing the Err function for the extraction of Sm with the saponified PC88A, the above equilibrium constant is estimated to be 2:7102. Table 3 shows the experimental conditions and the results with the saponified PC88A. In this table, the columns in initial conditions represent the initial concentration of Sm and PC88A, and the initial pH of SmCl3
solution. The columns in measured values refer to the distribution coefficient of Sm and the equilibrium pH of the solution measured experimentally. The columns in calculated values list the initial concentration of HCl, and the equilibrium pH and the distribution coefficient of Sm calculated in this study. Figure 6 shows the experimental distribution coefficients of Sm and those calculated in this study. The correlation coefficient between the two values is 0.98, indicating that the two distribution coefficients of Sm agree well with each other.
Unlike the case of the extraction of Sm with PC88A, however, there is large discrepancy between the values of equilibrium pH calculated in this study and those measured. One of the reasons for the difference is the possibility that hydroxide ion in the saponified PC88A which was adsorbed during the saponification reaction, was dissolved into the aqueous phase in the course of solvent extraction.14)A further
study on the solubility of saponified PC88A in chloride solution and the incorporation of the solubility data in the model would improve the accuracy of the calculated pH values.
4. Conclusions
A solvent extraction reaction of Sm from a chloride solution with PC88A was identified from the experimental data by using a graphical method. The corresponding equilibrium constant for the solvent extraction was estimated
by analyzing ionic equilibria. The ionic equilibria for a SmCl3 solution were analyzed by considering the complex
formation reactions, as well as the mass and charge balance equations. Then, a chemical model was developed to predict the distribution coefficients of Sm for the extraction with the saponified PC88A. In the experimental ranges investigated in this study, the following solvent extraction reactions of Sm with PC88A and the saponified PC88A, and the correspond-ing equilibrium constants were obtained.
Sm3þ
aqþ1.5H2A2,orgSmA3,orgþ3Hþaq; K¼0:3; and
Sm3þþ3NaA
orgSmA3,orgþ3Naþ; K ¼2:7102
REFERENCES
1) T. Harada, R. G. Bautista and M. Smutz: Metall. Trans.2(1971) 195– 197.
2) T. K. Ioannou, M. Smutz and R. G. Bautista: Metall. Trans.3(1972) 2639–2648.
3) Y. C. Hoh and R. G. Bautista: Ind. Eng. Chem. Process Des. Dev.18
(1979) 446–453.
4) Y. C. Hoh and R. G. Bautista: J. Inorg. Nucl. Chem.41(1979) 1787– 1792.
5) S. N. Bhattacharyya and K. M. Ganguly: Hydrometallurgy32(1993) 201–208.
6) A. A. Abdeltawab, S. Nii, F. Kawaizumi and K. Takahashi: Separation and Purification Technology26(2002) 265–272.
7) P. Narayanan, V. R. Nair and L. N. Moharana: Proc. of the International Symposium on Solvent Extraction, ed. by V. N. Mirsa, S. C. Das and K. S. Rao, (Allied Publishers PVT Ltd., New Delhi, 2002) pp. 227–234.
8) J. G. Ahn, J. S. Sohn, K. H. Park and J. W. Ahn: J. Kor. Inst. Met. & Mater.39(2001) 1455–1460.
9) N. B. Devi, K. C. Nathsarma and V. Chakravortty: Hydrometallurgy49
(1998) 47–61.
10) K. Sarangi, B. R. Reddy and R. P. Das: Hydrometallurgy52(1999) 253–265.
11) N. B. Devi, K. C. Nathsarma and V. Chakravortty: Hydrometallurgy54
(2000) 117–131.
12) L. D. Pettit and K. J. Powell:Stability Constants Database, IUPAC and Academic Software, (1997).
13) L. A. Bromley: AIChE Journal.19(1973) 313–320.
14) J. G. Ahn, K. H. Park and J. S. Sohn: Mater. Trans.43(2002) 2069– 2072.
-0.5 0.0 0.5 1.0 1.5 2.0 2.5
-0.5 0.0 0.5 1.0 1.5 2.0 2.5
Correlation coefficient = 0.98
log D
calc
log D
expt
[image:5.595.334.514.73.248.2]![Fig. 3Equilibrium plot of log[H2A2] vs. log D � 3pH.](https://thumb-us.123doks.com/thumbv2/123dok_us/355245.533378/2.595.85.258.336.554/fig-equilibrium-plot-log-h-a-vs-log.webp)