Resistivity Study of Eutectoid Decomposition Kinetics of
-Fe
2Si
5Alloy
Junxiang Jiang, Kazuhiro Matsugi, Gen Sasaki and Osamu Yanagisawa
Graduate School of Engineering, Hiroshima University, Higashi-Hiroshima 739-8527, Japan
The kinetics of the eutectoid decomposition!þSi in a sintered-Fe2Si5alloy under isothermal conditions has been studied by using electrical resistivity technique. X-ray diffraction was applied to determine the relation of resistivity and transformed volume fraction by quantitative analysis. The time-temperature-transformation (TTT) diagram for the reaction was obtained in the temperature range of 873– 1148 K. The TTT diagram shows a typical C shape and gets nose at 1073 K. A general expression of Johnson-Mehl-Avrami (JMA) equation was proposed by introducing a constant, which is associated with spatial distribution of nucleation. The mechanism of the transformation was discussed in the theoretical frame of the modified JMA theory. The Avrami exponent was found to change with temperature,n¼3:8above 1073 K andn¼3:0in the region of 873–1073 K. The results indicated that an interface controlled three-dimensional growth is responsible for theformation in the eutectoid decomposition under the conditions of decreasing nucleation rate above 1073 K but zero nucleation rate (site saturation of nucleation) in the region of 873–1073 K. The activation energy associated with the eutectoid decomposition, obtained in the lower temperature range, was 132.8 kJ/mol.
(Received November 17, 2004; Accepted January 24, 2005)
Keywords: thermoelectric material, resistivity measurements, kinetics of eutectoid decomposition, Johnson-Mehl-Avrami equation
1. Introduction
Semiconducting -FeSi2 is well known as an attractive
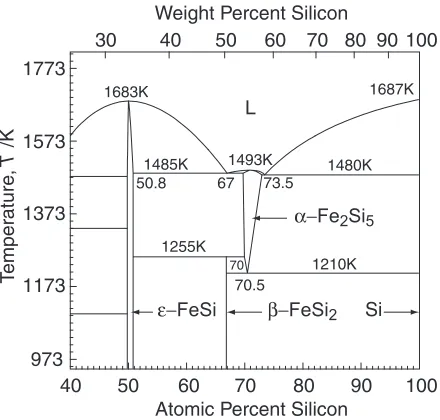
material for high temperature thermoelectric conversion due to its large Seebeck coefficient, chemical stability and relatively low cost.1,2)According to the binary phase diagram of the Fe-Si system (Fig. 1),3)a stoichiometric FeSi2 melt
will be transformed into the eutectic structure of two metallic phases, "-FeSi and -Fe2Si5. The semiconducting -FeSi2
can then be obtained by the following three reactions:4) 1. the peritectoid reaction (þ"!) at 1255 K, 2. the eutectoid reaction (!þSi) at 1210 K and 3. the subsequent reaction (Siþ"!).
As long as the FeSi2composition is selected, it is difficult to
obtain the full quantity of phase, in which the remained metallic"will decrease the thermoelectric power owing to form an electric circuit.5) To eliminate such problems,
Yamauchiet al.have proposed the-Fe2Si5 composition as
a new material instead of the conventional FeSi2
composi-tion.6) In the case of Fe
2Si5 alloy, a duplex structure of Si
particles and matrix will be formed by the eutectoid decomposition ofphase. It was also reported that the ultra fine eutectoid Si dispersoids could be beneficial to improve the thermoelectric properties.7,8)However, there is only few works on the mechanism of the eutectoid decomposition9) and the kinetics of the transformation is remaining subjects to be examined.
The electrical resistivity of-FeSi2is several orders larger
than that of-Fe2Si5 due to their different crystal structure,
whereis a typical metallic phase butis a semiconductor.5) Therefore, the electrical resistivity will change sensitively to the phase evolution betweenandand it will be a suitable parameter to evaluate the transformed volume fraction, as a function of time, for the eutectoid decomposition in-Fe2Si5
alloy.
This work is concerned with the mechanism of the eutectoid decomposition of the phase in a Fe2Si5 based
alloy under isothermal conditions. The course of the trans-formation was traced by the change in electrical resistivity and microstructure development. The kinetics of the eutec-toid decomposition was discussed within the theoretical frame of the Johnson-Mehl-Avrami (JMA) theory.10)
2. Experimental Procedure
A Fe29:5Si70:5 alloy with -Fe2Si5 composition was
prepared from 99.9% purity electrolytic iron, and high purity Si for semiconductor by levitation melting in a high-frequency induction furnace under an Ar gas atmosphere. The ingot was pulverized to 45 mesh and further mechanically ground with a planetary ball-miller for 5 h. The powders were sintered in a graphite die at 1223 K for 30 min at 30 MPa by the spark plasma sintering method in vacuum. Specimens with dimensions of 2mm4mm
18mm were cut and used in the experimental study. The resistivity experiments were carried out using a
time-40 50 60 70 80 90 100
973 1173 1373 1573 1773
L
1687K 1683K
1485K 1493K 1480K
1210K 1255K
67
50.8 73.5
70.5
70
Atomic Percent Silicon
T
emper
atur
e,
T
/K
Weight Percent Silicon
Si
40 50 60 70 80 90 100
30
Fig. 1 Equilibrium phase diagram of the Fe-Si system.
[image:1.595.60.280.557.767.2]temperature cycle: heating up to homogenization field (1233 K); isothermally holding at this temperature for 10 min; rapidly cooling to the chosen temperature and then isothermally holding at this temperature. During the iso-thermal exposure, the electrical resistivity () was simulta-neously measured by the standard four probe d.c. method to trace the course of eutectoid transformation. The measure-ments were performed at different constant temperatures (T) from 873 to 1148 K under an argon atmosphere.
On the other hand, a set of specimens annealed at 973 K with different time were used as calibration specimens. Their electrical resistivities were measured at 373 K to establish the correlation between the electrical resistivity () and the amount of the transformed volume fraction (X). The trans-formed volume fraction was derived from the amount of
phase, which was quantitatively determined by the X-ray powder method developed by Klug and Alexander11) by using corundum as an internal standard. X-ray diffraction (XRD) was performed at room temperature in the angular range of 15–45(2) with a step of 0.02and a counting time
of 7.5 s/step.
Some specimens were quenched into water from the intermediate stages of the isothermal annealing. The changes in microstructure were examined by optical microscopy, EPMA and XRD.
3. Theoretical Outline
Thermally activated transformation in the solid state can be investigated by isothermal or non-isothermal experiments. The isothermal transformation data are usually interpreted in terms of the JMA theoretical model,10)in which the fraction of transformed product phase as a function of time (t), is given by
XðtÞ ¼1expðKtnÞ ð1Þ
wherenis the Avrami exponent, which reflects the character-istics of the nucleation and growth processes, and K is a thermally activated rate constant, which represents both nucleation and growth rates, is usually assumed to have an Arrhenian temperature dependence,
K¼K0expðEa=RTÞ ð2Þ
where K0 is the pre-exponential term representing the
frequency factor,Ea is the apparent activation energy with contributions from the activation energy of nucleation (EN) and that of growth (EG),Ris the gas constant and T is the isothermal temperature in Kelvin. The transformation proc-ess is generally well understood when the three kinetic parametersn,K0 andEaare determined.
It is well known that the JMA equation is established on the assumption of random nucleation, in which the actual transformed volume (V) is described by a function of the extend volume (Vex) as supposed by Avrami12)as
V ¼1expðVexÞ: ð3Þ
However, the nucleation always occurs at preferred sites, such as grain boundaries, grain edges and so on. For these situations, Almansour et al.13) simulated the growth and impingement of spherical grains under site saturation
condition by supposing non-random (clustered or ordered) nucleation. From the simulated results, an approximate expression of the actual volume is suggested here as
Vm¼1expðVexmÞ ð4Þ
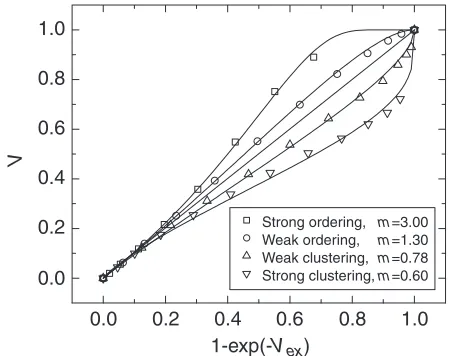
wheremis a constant associated with the spatial distribution of nucleation. The simulated results fitted by eq. (4) with differentmvalues are shown in Fig. 2. As can be seen, each situation simulated can properly be fitted by eq. (4) with a suitablemvalue.
Thus, a general expression of the JMA equation can be reconstructed by using eq. (4) as a substitute for eq. (3) and the modified JMA equation takes a form as
XmðtÞ ¼1expðKmtnmÞ: ð5Þ
This equation should cover all cases of the spatial distribution of nucleation, in which a value ofm¼1 represents random distribution,m>1ordered distribution andm<1clustered distribution.
4. Result and Discussion
4.1 Microstructure
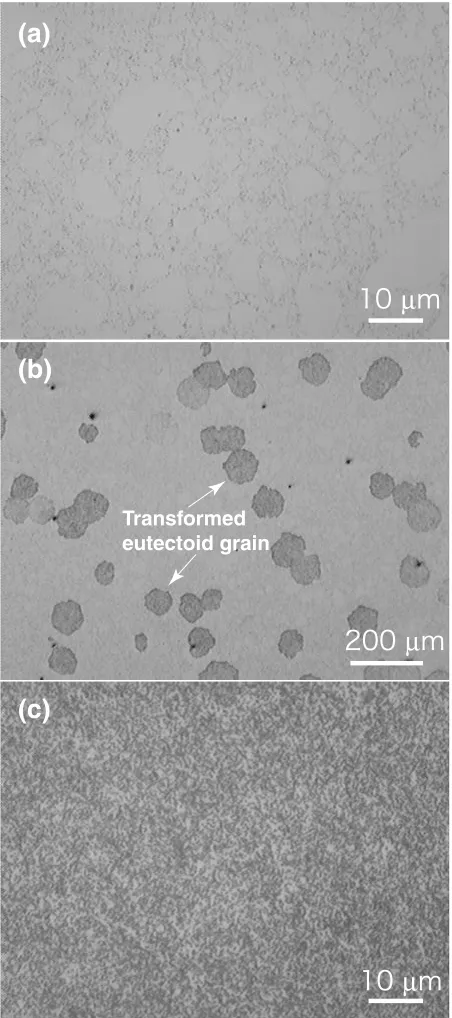
Figures 3(a), (b) and (c) are typical microstructures of (a) an as-sintered specimen, (b) a specimen quenched from intermediate stage of annealing, and (c) a fully annealed specimen. Their XRD patterns are shown as Figs. 4(a), (b) and (c) respectively. As can be seen, the as-sintered specimen shows a mono-phase of-Fe2Si5as Fig. 3(a). XRD analysis
in Fig. 4(a) also proves that no " or other phase appears. Figure 3(b) shows the microstructure of the initial stage of the transformation by quenching the specimen annealed at 1073 K for 1 h into water. The dark grey transformed regions can be seen in many places and the mutual impingement of regions transforming from separate nuclei is created even in the early stage of the transformation. The spatial distribution of the transformed regions shows a weak clustering charac-teristic. From the different sections of the specimen, it can also be confirmed that the transformed eutectoid grains are progressing with an isotropic growth. The results of EPMA
0.0 0.2 0.4 0.6 0.8 1.0
0.0 0.2 0.4 0.6 0.8 1.0
V
1-exp(-Vex)
m=3.00 Weak ordering, m=1.30 Weak clustering, Strong clustering, Strong ordering,
m=0.78 m=0.60
Fig. 2 Plot ofVvs.1expðVexÞsimulated for non-random nucleation13)
[image:2.595.314.539.71.249.2]and XRD in Fig. 4(b) show that these regions are composed of -FeSi2 and Si phases. Figure 3(c) shows the
micro-structure of the specimen annealed at 1073 K for 10 h and Fig. 4(c) shows the corresponding XRD result. It can be seen that there is no phase remained and the mono-phase structure has transformed to a duplex structure of phase matrix and Si particles.
[image:3.595.314.539.69.282.2]4.2 Time dependence of electrical resistivity
Figure 5 shows the relation of electrical resistivity () versus annealing time (t) at various isothermal temperatures. The electrical resistivity curve presents the same
character-istic sigmoidal shape at each temperature. During the isothermal treatment, the electrical resistivity keeps almost constant at first stage of annealing, then increases sharply with time and finally reaches its equilibrium value. The time, where begins to increase, decreases till 1073 K and then increases with temperature increasing. The equilibrium value of at the final stage decreases with increasing annealing temperature, which shows semiconducting characteristic because the transformed phases are semiconductors.
4.3 Quantitative analysis
In order to evaluate the transformed volume fraction (X) as a function of time (t) from the experimentally obtained relation of vs. t, a set of samples annealed at 973 K for different times were used to create a calibration curve ofvs. X.
After the electrical resistivity measurement at 373 K, the samples were crushed to powders for XRD analysis. The
(a)
(c)
(b)
Transformed eutectoid grain
Fig. 3 Microstructural evolution of the Fe29:5Si70:5alloy under isothermal annealing. (a) As-sintered, (b) Annealed at 1073 K for 1 h, (c) Annealed at 1073 K for 10 h.
10° 20° 30° 40° 50° 60°
X-r
a
y
Intensity (a.u.)
Si
(a)
(b)
(c)
Fig. 4 X-ray diffraction patterns of the Fe29:5Si70:5alloy. (a) As-sintered, (b) Annealed at 1073 K for 1 h, (c) Annealed at 1073 K for 10 h.
102 103 104 105 106
0.0 1.0 2.0 3.0 4.0
Time, t /s
873K 923K 973K 1023K 1073K 1123K 1148K
[image:3.595.56.282.72.581.2] [image:3.595.317.535.334.512.2]transformed volume fraction (X) was derived from the amount ofphase since the product phases are composed of
and Si. The amount ofwas quantitatively evaluated by a calibrated ratio of the integral intensity of the main peaks, peaks of (220) and (202) for-FeSi2 to peaks of (113) and
(104) for corundum. The obtained electrical resistivities () are plotted in Fig. 6 as a function of the transformed volume fraction (X).
Based on the concept of the electrical resistivity of a two-phase composite proposed by Fan,14)the resistivityccan be expressed as
1
c
¼ f
r
þ f
s
þ ð1f
r
fsÞ 2
ðffrÞ þðffsÞ
ð6Þ
wherec,andare the electrical resistivity of composite,
phase and phase respectively,f andf are the volume
fractions ofandrespectively, and randsare constants which are characteristics of the phase arrangement in the microstructure. The values ofr andswere estimated to be 1.268 and 3.536 respectively by fitting the relation ofvs.X in Fig. 6 with eq. (6). Here, the recalculation from the experimental resistivity curve ofvs.tto the volume fraction curve ofXvs.twas performed on the basis of eq. (6) with the predeterminedrandsby assuming the starting and finishing values ofin each curve as theandrespectively. As an
example, Fig. 7 shows the transformed volume fraction (X) as a function of time (t) for the isothermal annealing at 1073 K, as well as the experimental resistivity signal. The curve of X vs. t also shows sigmoidal shape but seems to increase earlier than the resistivity curve, because at early stage the change inis relatively small in the whole range.
4.4 Time-Temperature-Transformation (TTT) diagram
Figure 8 shows the TTT diagram for the eutectoid decomposition of the sintered Fe29:5Si70:5 alloy in the
temperature range of 873–1148 K. The diagram gives the relation between the temperature (plotted linearly) and the time (plotted logarithmically) for fixed fractional amounts of transformation to be attained. However, it must be empha-sized that the times corresponding to the beginning and end
of transformation cannot really be measured experimentally. For this reason we show the transformed fractions of 2 and 98% for the beginning and end of the transformation, respectively. The shape of the curve can typically be described by the character C and its nose temperature is about 1073 K. At that temperature, the eutectoid decompo-sition is started after annealing of2:0103s and completed after1:4104s. The nose temperature for the sintered alloy
is the same as that of as-solidified alloy and the time to complete reaction is also at the same level.9)
It is known that the isothermal transformation rate is controlled by the nucleation and growth rates. The nucleation rate increases rapidly as the undercooling increases, in contrast, the growth rate decreases as temperature decreases. These opposing factors give an overall transformation rate which first increases and then decreases again as the temperature falls, leading to the C-curves characteristic of TTT diagram. At sufficiently low temperatures, the nuclea-tion rate may be so large that the nucleanuclea-tion sites saturate early in the reaction and the growth rate alone controls the overall reaction rate. In this case, thenvalue is determined by the growth dimensions.
0.0 0.2 0.4 0.6 0.8 1.0
0.0 0.2 0.4 0.6 0.8 1.0 1.2 1.4
Experimental Data Fitted by Equation (6)
Transformed Volume Fraction, X
Fig. 6 Changes in the electrical resistivity of the Fe29:5Si70:5alloy against the transformed volume fraction.
0 5 10 15 20
0.0 0.2 0.4 0.6 0.8 1.0 1.2 1.4
Volume Fraction Resistivity
Time, t /103 s 0.001
0.0 0.2 0.4 0.6 0.8 1.0
V
o
lume F
raction,
X
Fig. 7 Time dependence of the transformed volume fraction for the Fe29:5Si70:5 alloy isothermally annealed at 1073 K, as well as the experimental electrical resistivity.
103 104 105 106
850 900 950 1000 1050 1100 1150
T
emper
ature
,
T
/K
Time, t /s
X=0.02 X=0.50 X=0.98
[image:4.595.61.279.69.247.2] [image:4.595.313.540.73.237.2] [image:4.595.317.536.303.475.2]4.5 Kinetics of eutectoid reaction
The analysis of the experimental data was made within the framework of the Johnson-Mehl-Avrami (JMA) theory by considering the spatial distribution of nucleation. Equa-tion (5) describes the kinetics of the transformaEqua-tion giving an evolution of the volume fraction transformed with time. For isothermal transformations eq. (5) has the following form,
1
mln½lnð1X
mÞ ¼lnKþnlnt: ð7Þ
Equation (7) can be used to analyze the experimental data by means of logarithmic plots, where ln½lnð1XmÞ=m is plotted vs.lnt. The slope of the resulting straight line is the Avrami exponentn, while from the intercept theKvalue can be calculated.
It should be emphasized that the research on the direct estimation of m from the spatial distribution of product phases is not enough till now. However, the eutectoid decomposition of thephase practically only starts at surface irregularities such as cracks and flaws15)and a clustering of nucleation will occur in this reaction. A value ofm<1can be expected since a weak clustering of the transformed regions was observed in all the samples annealed at different temperatures.
A linear fitting according to eq. (7) on the basis of least-squares regression was used to analyze the experimental data by taking into account the restriction ofm<1. Prior to the numerical data fitting, an induction period () was introduced to correct the onset time of the transformation. Here, the formation time 0:001, required to attain X¼0:001, was
considered as the induction time. The values of0:001used for
all temperatures are listed in Table 1 and an example of which is shown in Fig. 7. To eliminate the measuring error in the beginning and final stages of the transformation, the linear fitting was carried out in the region ofX¼0:02{0:98. The results of such fittings are shown in Fig. 9 by the plots of ln½lnð1XmÞ=m vs. lnðt
0:001Þ. As can be seen, the
experimental measurements are described very well by straight lines for all temperatures used. This means that eq. (5) can be applied to describe the kinetics of the eutectoid transformation in the sintered Fe29:5Si70:5 alloy under
isothermal conditions. The values of m, n, and K, derived from the linear fittings for all applied temperatures are also listed in Table 1.
The Avrami exponents take values about 3.0 in the temperature range of 873–1073 K, however, above 1073 K, take values about 3.8. The value of n3 for all samples
means a three-dimensional growth of the -phase, which is accordance with the results of microstructure observation (see 4.1). By taking experimental errors into account, the values of n in the low temperature region, below the nose temperature in the TTT diagram, can be assumed constant and equal to 3.0, implying that the growth rate alone controls the overall reaction rate after nucleation sites saturated at early stage of the transformation.10) However, the value of n¼3:8above 1073 K means that a three-dimensional growth occurs with the condition of decreasing nucleation rate in the transformation.10)
However, the n value for the as-solidified material obtained by Yamauchi et al.9) is about 2.0 in the whole range from 873 to 1123 K. Since the nucleation always prefers at surface irregularities such as cracks and flaws,15) the nucleation sites, which are relatively few in the as-solidified material, could saturate at an early stage of the transformation even at a temperature as high as 1123 K, at which a value of n¼3:8 obtained by us for the sintered material. Usually, the value of n¼2:0 means a two-dimensional growth under condition of zero nucleation rate.10) However, it also can be suggested by a strong clustering according to eq. (5). A further investigation on microstructure at different intermediate stages of the anneal-ing is beneficial to clarify the transformation mechanism in the as-solidified material.
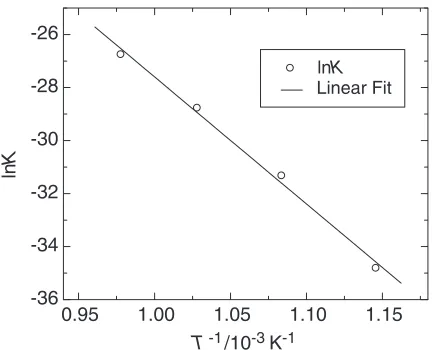
[image:5.595.319.535.70.245.2]On the other hand, the activation energy of the trans-formation can be derived from the low temperature region below the nose of C-curve. As can be seen, in the region of 873-1023 K, the rate constant (K) is a function of temper-ature, as expected, increasing with annealing temperature. They are assumed to follow Arrhenius dependence, eq. (2). Figure 10 shows the Arrhenius plot of the rate constantlnK vs. 1=T, fitted linearly on the basis of least-squares regression. The apparent activation energy obtained from the slope of the straight line is Ea¼398:4kJ/mol. As discussed above, in this region the transformation is controlled by the growth process alone and this apparent activation energy is contributed only by the activation energy of growth (EG) with Ea¼nEG.16) Thus, the effective activation energy (Ec) for the eutectoid decomposition of Table 1 JMA parameters for the isothermal transformation in the
Fe29:5Si70:5alloy at different temperatures.
T/K 0:001/s m n K/s1
873 41983 0.88 3.08 7:691016 923 18067 0.90 3.02 2:531014 973 8119 0.90 2.95 3:231013 1023 2995 0.88 3.01 2:431012 1073 1635 0.89 2.97 4:351012 1123 4846 0.91 3.82 8:131017 1148 56848 0.90 3.77 4:231019
-4 -2 0 2
ln[-ln(1-X
)]/
m
m
873K 923K 973K 1023K 1073K 1123K 1148K
6 7 8 9 10 11 12
Fig. 9 Plot ofln½lnð1XmÞ=mvs.lnðt
[image:5.595.47.291.684.785.2]phase is equal toEGwith a value ofEc¼Ea=n¼132:8kJ/ mol (n¼3:0).
Ibeet al.have studied theformation in the Siþ"!
reaction of FeSi2 alloys sintered with different powder
sizes.17)They found that the formation in this reaction is controlled by the diffusion of Si atoms and the activation energy decreases with decreasing the powder size because the increased boundaries act as additional routes for Si atom diffusing. Accordingly, if only the diffusion process controls the eutectoid reaction, an effective activation energy of Ec¼65kJ/mol is expected since the powder size used in this work is as small as they used.17)However, the value of E
c obtained for the eutectoid decomposition is so large that the diffusion process can not be considered to control the reaction. An interface controlled growth may be predominant because the mean composition may not change during the eutectoid decomposition.10) An additional energy barrier caused by the volume change could also be one of the reasons for high activation energy since a high volume change always accompanied with the eutectoid decomposition ofphase.15)
5. Conclusions
The eutectoid decomposition !þSi in the sintered Fe29:5Si70:5 alloy was studied by resistivity technique under
isothermal conditions. The parameters characterizing the
relation of the electrical resistivity and the transformed volume fraction has been determined by a two-phase composite model. In the temperature range of 873–1148 K, a time-temperature-transformation (TTT) diagram for the reaction was obtained, which shows a typical C shape and gets nose at 1073 K. A constant describing the effect of spatial distribution of nucleation was proposed to the Johnson-Mehl-Avrami (JMA) theory. The modified JMA equation was successfully used to analyze the mechanism of the eutectoid reaction under isothermal conditions. The kinetic analysis suggests that the reaction in the sintered material is predominated by an interface controlled three-dimensional growth with the conditions of decreasing nucleation rate above 1073 K and site saturation of nucleation in the range of 873–1073 K. An effective activation energy of Ec¼132:8kJ/mol is obtained for the eutectoid decomposi-tion ofphase at the temperatures below the nose of C-curve.
REFERENCES
1) U. Birkholtz and J. Schelm: Phys. Status Solidi27(1968) 413–425. 2) I. Nishida: Phys. Rev. B7(1973) 2710–2713.
3) T. B. Massalsky (Ed.):Binary Alloy Phase Diagram, (ASM, Metals Park, Ohio, 1986) p. 1108.
4) I. Yamauchi, A. Suganuma, T. Okamato and I. Ohnaka: J. Mater. Sci.
32(1997) 4603–4611.
5) I. Nishida, K. Masumoto, M. Okamoto and T. Kojima: Mater. Trans., JIM26(1985) 369–374.
6) I. Yamauchi, T. Okamato, A. Suganuma and I. Ohnaka: J. Mater. Sci.
33(1998) 385–394.
7) A. Heinrich, H. Griessmann, G. Behr, K. Ivanenko, J. Schumann and H. Vinzelberg: Thin Solid Films381(2001) 287–295.
8) J. X. Jiang, T. Sasakawa, K. Matsugi, G. Sasaki and O. Yanagisawa: J. Alloys Comp., in press.
9) I. Yamauchi, T. Nagase and I. Ohnaka: J. Alloys Comp.292(1999) 181–190.
10) J. Christian: Thoery of Transformation in Metals and Alloys, (Pergamon Press, Oxford, 1975) pp. 433–489.
11) P. Klug and E. Alexander:X-ray Diffraction Procedures, (Wiley, New York, 1954) p. 410.
12) M. Avrami: J. Chem. Phys.8(1940) 212–224.
13) A. Almansour, K. Matsugi, T. Hatayama and O. Yanagisawa: Mater. Trans., JIM37(1996) 1595–1601.
14) Z. Fan: Acta Metall. Mater.43(1995) 43–49.
15) J. Van Den Boomgaard: J. Iron Steel Inst.210(1972) 276–279. 16) J. Sˇestak:Thermophysical Properties of Solids: Their Measurements
and Theoretical Thermal Analysis, (Elsevier, Amsterdam, 1984) p. 191. 17) A. Ibe, M. Itai, N. Yamaguchi and O. Ohashi: J. Japan Inst. Metals67
(2003) 369–373.
0.95 1.00 1.05 1.10 1.15
-36 -34 -32 -30 -28 -26
ln
K
T-1 /10-3 K-1
[image:6.595.62.278.70.245.2]lnK Linear Fit