Munich Personal RePEc Archive
Consumer preferences for fair labour
certification
Drichoutis, Andreas C. and Vassilopoulos, Achilleas and
Lusk, Jayson and Nayga, Rodolfo M.
Agricultural University of Athens, Oklahoma State University,
University of Arkansas
3 March 2015
Online at
https://mpra.ub.uni-muenchen.de/73718/
Consumer preferences for fair labour certification
∗
Andreas C. Drichoutis
†1, Achilleas Vassilopoulos
‡1,2, Jayson L. Lusk
§3, and
Rodolfo M. Nayga, Jr.
¶4,5,6,71
Agricultural University of Athens
2
ICRE8: International Center for Research on the Environment and the
Economy
3
Oklahoma State University
4University of Arkansas
5
Norwegian Institue of Bioeconomy Research
6Korea University
7
The National Bureau of Economic Research
Abstract: High profile cases of exploitative labour practices have increased concerns over agricultural working conditions. However, it is unclear to what extent the public is willing to trade-off fair working conditions for higher prices. We implement a large-scale survey to uncover consumer preferences for a food labeling system that certifies fair working conditions for the workers employed in agricultural production. We test for several methodological issues
∗We’d like to thank the Editor and two anonymous reviewers for their constructive comments.
Dri-choutis, Vassilopoulos and Lusk acknowledge funding by the John S. Latsis Public Benefit Foundation. The sole responsibility for the paper’s content lies with its authors. We also acknowledge the help of several people: Sotiria Alexandri, Nikos Bochoridis, Christina Chliaoutaki, Froso Gkika, Almarina Gkramozi, Eirini Kostoula, Maria Michalopoulou, Alexandra Papadopoulou, Eleftheria Papamichali, Sofia Tsarsitalidou and Eleni Vasilaki for data collection; Foteini Tragou and Nikos Petrou for data coding; Panagiotis Lazaridis for additional financial help; Michalis Chletsos and Apostolis Tsiouris for supporting data collection in the city of Ioannina.
†Corresponding author: Assistant professor, Department of Agricultural Economics & Rural
Develop-ment, Agricultural University of Athens, Iera Odos 75, 11855, Greece, tel: +30-210-5294781, e-mail: [email protected].
‡Senior Researcher, ICRE8: International Center for Research on the Environment and the Economy,
Artemidos 6 & Epidavrou, 15125, Maroussi-Athens, Greece and Department of Agricultural Economics & Rural Development, Agricultural University of Athens, tel:+30-210-6875346, e-mail: [email protected], [email protected].
§Regents Professor and Willard Sparks Endowed Chair, Department of Agricultural Economics,
Okla-homa State University, Stillwater, OK 74078, USA, tel:+1-4057447465, e-mail: [email protected].
¶Professor and Tyson Endowed Chair, Department of Agricultural Economics & Agribusiness, Division
with respect to value elicitation and predictions of reference dependent theory. With our most conservative estimates, we find that consumers are willing to pay an average premium of 53 cents per 500 gr, 95% CI [43.9, 62.3], for strawberries with fair labour certification.
Keywords: fair labour label; willingness to pay; equivalent loss; contingent valuation; inferred valuation; consequentiality; cheap talk; uncertainty scale.
1
Introduction
Recently, there has been a surge of labour exploitation incidents in the Greek agricultural farm sector. The most recent incident in April 2013 involved 33 Bangladeshi workers being shot and injured by their supervisors at a strawberry farm as they protested being unpaid for several months. This incident brought mass media attention in the country about the long-term issue of labour exploitation in the agricultural farming sector. Subsequently, a steady stream of cases of mistreatment and unfair working conditions in farm businesses have emerged, resulting in public outcry in Greece and the European Union. Public anger was manifested by a strong (albeit temporary) decline in the demand for strawberries.1
Despite the public backlash, farmers have argued that in order to produce at prices that consumers are willing to pay, and to be competitive with imported agricultural products, they cannot provide employee benefits (e.g., minimum wage, maximum working hours, sick leave, housing). Hence, without resorting to illegal employment practices, producers fear that they will be unable to profitably operate.
This paper seeks to contribute to the debate regarding the controversy about the trade-offs between fair working conditions and the competitiveness of local agricultural products. We use non-market valuation techniques designed to uncover the underlying preferences of Greek consumers towards a food labeling system that certifies ‘fair’ working conditions for the workers employed at all stages of agricultural production. Our aim is to understand whether consumers’ alleged disapproval of unfair working practices is reflected in their willingness-to-pay (WTP) a premium above regular prices of conventional agricultural products. Most relevant to our work is a labeling system that is already in place in the global agro-food system known as Fair Trade (FT) labels.2
However, fair labour labeling is distinct from fair trade labeling in that the latter is mainly focused on commodities or products which are typically exported from developing countries to developed countries and thus, is focused on helping producers in developing countries.
Although previous research has studied ethically-related food marketing claims related to animal welfare, environment, or fair trade, we are not aware of prior research that has focused specifically on consumer preferences for agricultural employee pay and working conditions. However, recent works byHoward and Allen (2006,2010) and Hustvedt and Bernard(2010)
1
Although the decline in demand is an indication that part of the society does not tolerate the mistreat-ment and unfair working conditions of the workers, demand recovered when the dust settled down and the media coverage stopped. This does not mean that consumers do not care about fair working conditions. It likely reflects the fact that when something is not in their focus of attention, they tend to ignore or forget it. This is analogous to many consumers finding an animal slaughtering video repelling, which could perhaps make some of them temporarily stop eating meat, but which would doubtfully turn them into vegetarians.
2
provide accumulated evidence of the demand for labour-related information on a variety of products. Using both hypothetical and non-hypothetical methods, the studies found that consumers are willing to pay a premium for products, the production of which mandates subsistence wages to all employees in the production chain. Our aim in this paper is to take this line of research a step forward by introducing and testing labels that ensure not only subsistence wages but also the governance of working hours, access to decent housing, and the availability of personal hygiene facilities and health care services. Given that employment in Greek farms is mostly seasonal and reliant on illegal immigrants who might have less recourse through traditional legal channels, these additional conditions are likely aspects of an agro-food labour market that consumers might find desirable.3
Although there are legal means by which the state could sanction farmers and businesses that do not comply with the law with respect to the legal status of their workers or the legal benefits of the labourers etc., these laws are rarely enforced. For example, a law that prohibits farmers from hiring immigrants who are not green card holders is already in place in Greece. However, the law is widely not implemented. From the farmers perspective, there are good reasons for the non-implementation because of the high risk of encountering a shortage of farm labourers if they abide by these laws. 4
3
There are no official statistics to back our claim that the agricultural sector heavily relies on illegal immigrants because statistical services do not collect green card status information as this is considered sensitive personal information. Even if the collection of this information was possible, it would likely be unreliable given that it is questionable how many of the illegal immigrants would not try to escape census registration.
However, the illegal immigrant status of many labourers in the agricultural sector is implied by at least two facts. For one, Southern Europe’s model of migration is very different from the Northern European model of migration and is characterized (among others) by its broad ‘illegality’ connected to the migration controls imposed by EU countries, heterogeneity of the nationalities of the immigrants, and male predominance (Kasimis and Papadopoulos,2005). Illegal migratory flows for Greece in particular, have been facilitated by the geographic location of Greece, characterized by extended coastlines and relatively easier crossed borders, which act as the eastern gate to the EU (Kasimis,2008). Moreover, the nature of the Greek economy, which is based on tourism, allows the legal entry of migrants who could then stay illegally upon the expiration of their visas (Kasimis, 2008).
Second, it is the structure of the farm labour market that attracts illegal low-skilled immigrants. Officially, migrants’ share in the total population was 7.57% in 2015 (Eurostat, 2016) but the actual share is often estimated to be larger than official statistics (e.g.,Kasimis and Papadopoulos,2005). Immigrants represent a higher share of the economically active population (Kasimis et al.,2003) due to their relatively younger age. The main working nationalities in the agricultural sector are Albanians, Bulgarians, Indians, Pakistanis and Bangladeshis (Kasimis and Papadopoulos, 2013). The presence of immigrants in the country skyrocketed after the collapse of the communist regimes in Central and Eastern European countries, which resulted in hundreds of thousands of (predominantly) Albanians, Bulgarians and Romanians flowing into the country (Kasimis et al.,2003). For the immigrants, the agricultural sector has been very attractive because they can adjust easily to farm work, which often serves as a first step in their pursuit for a higher standard of living. The continuous inflow of immigrants reflects a labour market model where ‘old’ immigrants are replaced by ‘newcomers’ (Kasimis,2008). Thus, collective action and bargaining are limited by the nature of this labour market.
4
The illegal part of the equation is easier to resolve. For example, with a recently passed bill, farms in Greece will have the right to legally hire labourers without a green card for temporary farm work as long as farmers have registered the workers.5
However, this law does not enforce the other dimensions of the working environment such as subsistence wages, working hours, access to decent housing, personal hygiene facilities as well as health care services, which are additional elements of a fair labour certification system.
To uncover consumers’ preferences for a fair labour label, this study uses traditional stated preferences methods augmented with recent methodological advances designed to identify and weed out potential biases. We conducted a large scale questionnaire based experiment in two cities of Greece, Athens and Ioannina. We collected data from personal interviews of more than 3,800 subjects. In addition to the empirical objective related to fair labour labels, we also explore several methodological issues that are relevant to nonmarket valuation, such as social desirability bias, hypothetical bias, consequentiality of the survey, and certainty of responses. The next section describes the survey-experiment and the relevant methodological issues we address.
2
The valuation survey-experiment and
methodologi-cal issues
The Contingent Valuation Method (CVM) has become one of the most popular methods to measure WTP values for public and private goods, services, or amenities. Although it was principally developed in environmental and transport economics, it has made consider-able headway in the valuation of food products over the last decades (e.g., Buzby et al.,
1998; Corsi, 2007). Most, if not all, CVM studies are conducted in hypothetical contexts, particularly in environmental valuation studies where a real market with salient payments is difficult to establish (Carson, 2012; Haab et al., 2013; Kling et al., 2012).
and cooperatives asked for more than 4500 farm labourers through an open call, only a handful of people actually responded to the advertisements. This situation is not different from what has happened in the US when the E-verify system was introduced and mandated in some states. For example,Bohn et al.(2015) find that in Arizona where E-verify was mandated in 2007, contrary to its intent, the law did not appear to have improved labour market outcomes of legal low-skilled workers who compete with unauthorized immigrants. For instance, they find evidence of diminished employment and increased unemployment among legal low-skilled workers. Furthermore, the state of Georgia in the United States has reportedly experienced a shortage of farm labourers due to the E-verify mandate driving immigrants out of Georgia. This has caused crops being left unharvested (Mcardle, 2012; Powell, 2012). Zahniser et al. (2012) found through a simulation analysis that a large reduction in the number of unauthorized workers in all sectors of the U.S. economy (the consequence of E-verify) would lead to a longrun reduction in output and exports in agriculture as well as the broader economy.
5
2.1
The inferred valuation method
The CVM involves creating a hypothetical valuation scenario in which consumers are asked to state their WTP for the product in question. Empirical findings from several disciplines suggest that results from the CVM can be susceptible to social desirability bias. There are now several studies that show that when people are asked to predict other people’s value, as in the Inferred Valuation method (discussed momentarily), they state a different value than their own (e.g., Frederick, 2012;Kurt and Inman, 2013;Loewenstein and Adler,
1995;van Boven et al.,2000,2003). Lusk and Norwood(2009b) used a modification ofLevitt and List’s (2007) additive utility model to illustrate how social desirability may carry over to non-market valuation and produce inflated bids that misrepresent respondents’ preferences. Their so called Inferred Valuation (IVM) method, addresses social desirability bias by asking respondents to state their beliefs about the average consumer’s valuation for a good.
Lusk and Norwood(2009a,b) argued that the IVM generates valuations that are less likely to suffer from normative or moral response biases (such as social desirability bias), and they found that responses to the IVM better predicted actual shopping behavior than did those from a CVM. They also found that the IVM produced less hypothetical bias when social desirability was present. The authors showed that goods with normative dimensions are more prone to social desirability bias and thus the IVM is more effective in bridging the gap between the laboratory and field valuations. In the spirit of Lusk and Norwood (2009a,b),
Pronin (2007) argues that people tend to recognize biases in human judgment except when biases are their own, which implies that predictions over other peoples’ preferences should mitigate biases.
2.2
Incentive compatible elicitation formats and consequentiality
procedure exists.6
This is to say that any response format with at least three possible outcomes is subject to individual manipulation (i.e., it is not incentive compatible). This does not imply, however, that any binary DC format is incentive compatible but that, by elimination, only a DC format could be incentive compatible assuming subjects believe that their response is consequential (meaning there is some probability that the respondent’s answer will actually influence the provision of the good).7
As we discuss in the next paragraph, the consequentiality of the survey is a key condition in the assumption of incentive compatibility, and yet it is an issue that has only lately received much attention.
Much of the early literature has evolved around the presumption that hypothetical bias prevails in CVM estimates (i.e., that people tend to state a higher WTP in hypothetical questions as opposed to non-hypothetical questions). As such, a number of approaches have been proposed to mitigate hypothetical bias. As discussed above, the issue of consequen-tiality has only been given attention in the last few years. Carson and Groves (2007) argue that to produce useful information about an agent’s preferences, survey results must be seen as potentially consequential.8
Under consequentiality, survey respondents are explicitly told that their responses to preference questions will influence provision of the good under valuation. As a result of Carson and Groves’s (2007) suggestion, the literature examining the merits of consequential surveys has been rapidly growing.9
While proponents of the
6
The theorem was formalized by Gibbard (1973) and Satterthwaite (1975) and noted in passing by
Dummett and Farquharson(1961). See alsoSvensson and Reffgen(2014).
7
While proponents of the DC format take this result about the incentive compatibility of the DC format as granted for any type of good,Carson et al. (1997) show that the DC format is not incentive compatible in the case of provision of a new private or quasi-public good. The incentive compatibility of the DC format can be restored for quasi-public or private goods only if the binary choice is between two different forms of the good, so that the valuation question represents a change in the good (Carson et al., 2001; Carson and Groves,2007).
8
More recently,Carson et al.(2014) showed theoretically, that the conditions put forward byCarson and Groves(2007) for ensuring the incentive compatibility of the discrete choice format, also hold under weaker assumptions that do not not require agent preferences to conform to expected utility. In addition, Poe and Vossler(2011) provide a discussion of the theoretical arguments set forth byCarson and Groves (2007) and accumulated supporting empirical evidence. List and Price (2013) also discuss the role of consequentiality in aligning hypothetical and real statements of value. Rheinberger and Schl¨apfer(2015) express doubt that
Carson et al.’s (2014) results apply to the binary referendum with randomly assigned bids because, as they argue, the random bid assignment makes binary referendum CVM surveys incentive incompatible since a typical respondent is presented with a randomly assigned bid that might be very different from the actual cost of the project under consideration.
9
DC elicitation format take this result about the incentive compatibility of the DC format as granted for any type of good, Carson et al. (1997) show that the DC elicitation format is not incentive compatible in the case of provision of a new private or quasi-public good. The incentive compatibility of the DC elicitation format can be restored for quasi-public or private goods only if the binary choice is between two different forms of the good, so that the valuation question represents a change in the good (Carson et al.,2001;Carson and Groves,
2007).
2.3
Cheap talk
The Cheap Talk method has been used to potentially reduce hypothetical bias by re-minding participants of the tendency among people to inflate their (hypothetical) valuations (Kling et al., 2012). However, the evidence of its effectiveness is far from conclusive. In particular, Cummings and Taylor (1999) proposed a quite lengthy cheap talk script which they found to be effective at reducing hypothetical bias in experiments using public good referenda. List (2001) and Lusk (2003) found that Cummings and Taylor’s (1999) cheap talk script lowered bids for inexperienced (unknowledgeable) consumers while Brown et al.
(2003) and Murphy et al. (2005) concluded it was indeed successful but only for high pay-ment amounts. Blumenschein et al. (2007) on the other hand, found that cheap talk has no significant impact while the results of Morrison and Brown (2009) suggest that it can over-calibrate responses and underestimate the actual WTP. Earlier attempts also failed to match the hypothetical with the actual WTP. Notably, Cummings et al. (1995) found that short scripts inflated the hypothetical bias while Loomis et al. (1996) argued that although the short script reminder reduced the ratio of hypothetical and actual WTP, this effect failed to reach statistical significance. Our script resembles the ones employed in Champ et al.
(2009), Bulte et al. (2005) and Aadland and Caplan (2003) who successfully mitigated the bias and those of Brummett et al. (2007) and of Poe et al. (2002) that failed to do so.10
In
their vote as consequential. Similarly,Herriges et al.(2010) explore the role of policy consequentiality (note, that this is not the same as strong consequentiality unless respondents believe there is an implied payment obligation) and find that WTP distributions are equal only for subjects that believe that the survey has some potential for shaping policy decisions. Whitehead et al.(2016) find that participatory sporting event behavior accurately predicts actual behavior at a middle level of respondent certainty, overpredicts actual behavior at a lower level of certainty, and underpredicts behavior at a higher level of certainty. Mitani and Flores(2013) explore consequentiality of stated preference choices by means of a laboratory experiment and find that the probability of provision of a public good has a positive effect on contributions. On the other hand,Oehlmann and Meyerhoff(2016) find no effects tied to inclusion/exclusion of a consequentiality script on elicited valuations. On the empirical modelling forefront, Czajkowski et al. (2015) show how to appropriately integrate subjective measures of latent beliefs about consequentiality in econometric models by developing a Hybrid Mixed Logit model.
10
addition, our cheap talk script was not designed neutral (as in Aadland and Caplan (2006) and Silva et al.(2011)) since we side with those who believe that the danger of hypothetical bias stems from inflated rather than deflated bids.
2.4
Reference dependent preferences
An additional challenge we face with this survey-experiment is the issue of reference-dependent preferences. In the presence of information asymmetry, reference points may be formulated differently for each consumer and thus, heterogeneity in valuations may not only reflect taste heterogeneity. In our context, for example, for the share of consumers aware of labour exploitation in farms, the current endowment corresponds to products whose production line entails undesirable practices. As such, the availability of certified alternatives is seen as an opportunity to upgrade the (extrinsic) quality of goods they consume, at a cost equal to the price premium of such alternatives. Clearly, this premium is better framed as their willingness-to-pay (WTP), which is defined as the maximum amount a consumer would be willing to pay in return for an increase (or upgrade) in his consumption for a good. This is the valuation measure used in most studies eliciting homegrown values (e.g.,
Bateman et al., 2000). On the other hand, there are uninformed consumers who think that currently available goods are produced using fair labour practices and thus, according to their (wrong) perception, the introduction of a certification system would induce an extra-cost for goods which are the same with the ones they are already consuming. As a result, their valuation is better framed as an ‘Equivalent loss’ (EL), defined as the maximum amount a consumer would be willing to pay in place of a reduction (or downgrade) in her consumption of a good.11
Under Hicksian preferences, these two valuation measures should be equal to each other (EL=WTP), since ordering of consumption bundles is independent of individual’s endowment. However, if preferences are formed as in Tversky and Kahneman’s (1992) reference-dependent theory, this distinction is important. For this reason and to better approximate the average welfare of fair labour labels, we use both WTP and EL questions on a between-subjects basis.
The next section describes the experimental design we adopt to test the hypotheses described above.
11
3
Experimental design and questionnaire development
To elicit valuations for the fair labour certification system, we chose a pack of 500gr of strawberries as our product of interest. This was our chosen product for a number of reasons. First, we needed a product which is widely consumed and would appeal to most consumers. Second, we wanted a product that can be sold in packages that could carry a labeling certification system; strawberries can and are often sold in a packaged form. Third, the production process of strawberries is a (manual) labour intensive process (labour contributes to 45-50% of total cost of strawberries (Poinssot, 2013)).
All subjects were first informed about the fair labour certification system. Because there was the chance that subjects were familiar with a ‘fair trade’ label which could confound their perception of a ‘fair labour’ label, we wanted to make sure that all subjects would be actually valuing a ‘fair labour’ label by providing them a script with relevant information about fair labour labeling (the script can be found in Appendix A.1).
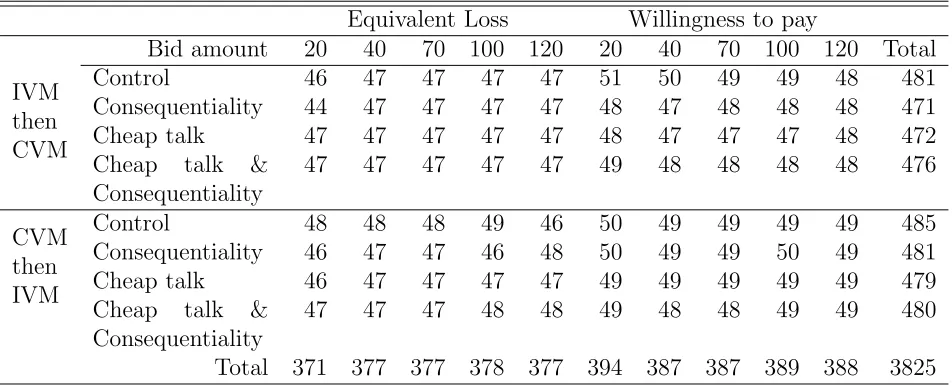
To answer the methodological issues we raised in the previous section, we adopted a de-sign with elements of a within- as well as a between-subjects dede-sign (Charness et al.,2012). For the between-subjects design, we adopted a 4×2 design where we vary the scripts ac-companying the valuation questions (control (no scripts) vs. cheap talk vs. consequentiality vs. cheap talk & consequentiality) as well as the elicited valuation measure (equivalent loss vs. willingness to pay). The five bid amounts used for the Discrete Choice format (20 cents vs. 40 cents vs. 70 cents vs. 100 cents vs. 120 cents) were selected based on projected historical prices of strawberries as well as feedback we received from the pilot survey (see AppendixA.3for a discussion of selection of bid amounts). The bid amounts were varied on a between subject basis so that each subject was asked for his/her valuation at only one bid amount. Table 1 shows our experimental design and the per treatment number of subjects. Valuations were elicited using the CVM as well as the IVM on a within subjects basis. The order was counterbalanced.
The cheap talk script was compiled from several sources as well as our own previous work (e.g., Bulte et al., 2005; Lusk, 2003) and reads as follows:
“In a minute you’ll be asked whether you are willing to pay a certain amount for strawberries.
This question will be hypothetical, that is, you will not actually have to pay. In general, people experience difficulties in answering hypothetical questions. They often state they are willing to pay an amount larger than the amount they are willing to pay in reality.
Table 1: Experimental design
Equivalent Loss Willingness to pay
Bid amount 20 40 70 100 120 20 40 70 100 120 Total
IVM then CVM
Control 46 47 47 47 47 51 50 49 49 48 481
Consequentiality 44 47 47 47 47 48 47 48 48 48 471
Cheap talk 47 47 47 47 47 48 47 47 47 48 472
Cheap talk & Consequentiality
47 47 47 47 47 49 48 48 48 48 476
CVM then IVM
Control 48 48 48 49 46 50 49 49 49 49 485
Consequentiality 46 47 47 46 48 50 49 49 50 49 481
Cheap talk 46 47 47 47 47 49 49 49 49 49 479
Cheap talk & Consequentiality
47 47 47 48 48 49 48 48 49 49 480
Total 371 377 377 378 377 394 387 387 389 388 3825
Notes: CVM stands for Contingent valuation; IVM stands for Inferred Valuation.
make the payment, they also consider that this money won’t be available for other purchases. Therefore, when the question is hypothetical, it is easier to exaggerate their response.
Before answering the willingness to pay question, try to think whether you are really willing to pay this amount for strawberries and that this amount will no longer be available for other purchases.”
The consequentiality script was adopted from Vossler and Watson (2013) and Vossler and Evans (2009) and reads as follows:
“We would like to inform you that the survey results will become available to producers, traders and retailers of agricultural products as well as to the wider general public of consumers. This means that this survey could affect the decision of producers, traders and retailers to adopt a Fair labour certification system for strawberries as well as the average price of strawberries.”
After the script(s) was(were) read, the valuation questions followed. In the control (no script) treatment, the valuation treatments followed right after information about the fair labour label was given. The willingness to pay valuation measure was framed as:
“Assume you are given a pack of half a kilo of conventional strawberries without any certification [show picture 2]. Would you be willing to pay XX cents so that you can exchange it with a similar pack of strawberries certified with a fair labour label [show picture 3]?”12
12
Conversely, the equivalent loss measure was framed as:
“Assume you are given a pack of half a kilo of strawberries certified with a fair labour label [show picture 3]. Would you be willing to pay XX cents so that you can avoid exchanging it with a pack of conventional strawberries without any certification? [show picture 2]”
Following the literature on certainty scales (Champ et al., 1997; Morrison and Brown,
2009), every CVM discrete choice question was followed by a question asking respondents to state how certain they were about their response on a 10-point scale anchored with the labels “Not certain at all” and “Very certain” .
Similar to the CVM questions, the IVM questions were formatted to elicit the willingness to pay measure:
“Assume that an average consumer is given a pack of half a kilo of conventional strawberries without any certification [show picture 2]. Do you think s/he would be willing to pay XX cents so that s/he can exchange it with a similar pack of strawberries certified with a fair labour label [show picture 3]?”
or the equivalent loss valuation measure:13
“Assume that an average consumer is given a pack of half a kilo of strawberries certified with a fair labour label [show picture 3]. Do you think s/he would be willing to pay XX cents so that s/he can avoid exchanging it with a pack of conventional strawberries without any certification? [show picture 2]”
A consequentiality question was also included to allow us to test for differences in re-sponses between respondents with different consequentiality perceptions of the survey. The
13
question was adopted fromVossler and Watson(2013) andVossler et al.(2012). Participants had to indicate the indirect consequences of the survey on a five point likert scale anchored by “not at all” and “very much”. The question was framed as:
“To what extent do you believe that your answers in this survey will be taken into account by producers, traders and retailers?”
The questionnaire also elicited respondents’ beliefs about the likelihood of hypothetical bias and social desirability bias (using the social desirability scale (SDS) of St¨ober (2001)). Recently, research in the area of non-market valuation has identified political affiliation and means of provision of the good; i.e., privately or collectively, as a determinant of willing-ness to pay for public goods (e.g., Dupont and Bateman, 2012). This mainly originates from a body of research that has found significant differences in the degree of concern for environmental goods expressed by individuals with different political affiliations. While our valuation exercise does not concern a public good, aspects of the fair labour label may ap-peal to political ideology; e.g., the minimum wage provision. Therefore, a political ideology question was included, which we adopted from the European Social Survey. A set of demo-graphic questions on age, gender, education, household size and perceived income position of the household was also asked as well as questions related to respondents’ price sensitivity with respect to grocery shopping and purchase frequency of strawberries.
4
Data collection methods
A pilot questionnaire was pre-tested in February-March 2014 in the city of Athens with 160 subjects, after which several adjustments were made. The full scale survey was then launched on April 1, 2014 and questionnaires were filled in until June 11, 2014. The period of data collection was predominantly dictated by the fact that strawberries are mainly traded during April, May and early June. Consumers were randomly intercepted in front of the main entrance of various supermarkets. In all, 11,510 subjects were intercepted in the cities of Athens and Ioannina and 3,825 agreed to take part in the survey resulting in a cooperation rate of 33.23%. Of course, several subjects walked out during an interview or opted not to respond to certain questions, which further reduced the available number of subjects for statistical analysis.
females (Mediamark Research and Intelligence, 2009). Therefore, the gender composition of our sample is not representative of the population of the two cities but it might better represent the grocery shopping population. Since we also asked respondents to report on the age and gender composition of their household, we can also compare the demographic profile of respondents’ households with that of the 2001 census (which is the latest available census for which basic demographic information are available). The comparison (see Table2) shows that discrepancies with the 2001 census are small.
Table 2: Comparison of gender and age groups between survey respondents, their household members and the 2001 census (percentages)
Males 0-9 10-19 20-29 30-39 40-49 50-59 60-69 ≥70 Respondents 33.64 0.00 3.47 24.07 22.37 23.50 17.29 7.13 2.18 Households 48.24 8.22 11.89 20.77 15.39 16.61 16.96 7.05 3.03 Census 48.45 9.22 11.46 16.37 16.06 14.54 11.93 10.45 9.96
5
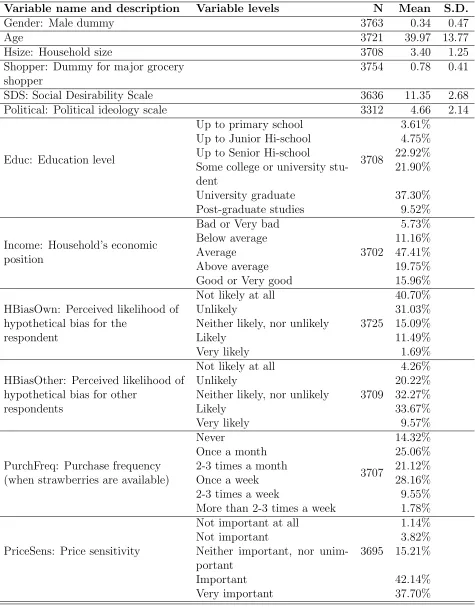
Data analysis and results
As in every experiment, it is critical to explore whether randomization to treatment was successful by testing if the observable characteristics are balanced across the between subjects treatments. Table 3 shows the basic descriptive statistics for a set of observable characteristics. With respect to demographic variables, there is no significant difference between treatments for gender (Pearson’s χ2 = 5.132, p-value=0.644), education (Pear-son’s χ2 = 20.168, p-value=0.979), income (Pearson’s χ2 = 39.326, p-value=0.076), age (Kruskal-Wallis χ2
= 5.599, p-value=0.587) and household size (Kruskal-Wallis χ2
= 3.341, p-value=0.852).
We also find no difference between treatments with respect to the Social Desirability score (Kruskal-Wallis χ2
= 6.128, p-value=0.525), political ideology (Kruskal-Wallis χ2
= 8.036, p-value=0.329), purchase frequency of strawberries (Pearson’s χ2
= 30.800, p-value=0.671), price sensitivity in purchasing decisions (Pearson’s χ2
= 22.302, p-value=0.767), perceived likelihood of hypothetical bias for the respondent (Pearson’s χ2
= 31.952, p-value=0.276) and perceived likelihood of hypothetical bias for other respondents (Pearson’s χ2
Table 3: Descriptives statistics of subjects’ observable characteristics
Variable name and description Variable levels N Mean S.D.
Gender: Male dummy 3763 0.34 0.47
Age 3721 39.97 13.77
Hsize: Household size 3708 3.40 1.25
Shopper: Dummy for major grocery shopper
3754 0.78 0.41
SDS: Social Desirability Scale 3636 11.35 2.68
Political: Political ideology scale 3312 4.66 2.14
Educ: Education level
Up to primary school
3708
3.61%
Up to Junior Hi-school 4.75%
Up to Senior Hi-school 22.92%
Some college or university stu-dent
21.90%
University graduate 37.30%
Post-graduate studies 9.52%
Income: Household’s economic position
Bad or Very bad
3702
5.73%
Below average 11.16%
Average 47.41%
Above average 19.75%
Good or Very good 15.96%
HBiasOwn: Perceived likelihood of hypothetical bias for the
respondent
Not likely at all
3725
40.70%
Unlikely 31.03%
Neither likely, nor unlikely 15.09%
Likely 11.49%
Very likely 1.69%
HBiasOther: Perceived likelihood of hypothetical bias for other
respondents
Not likely at all
3709
4.26%
Unlikely 20.22%
Neither likely, nor unlikely 32.27%
Likely 33.67%
Very likely 9.57%
PurchFreq: Purchase frequency (when strawberries are available)
Never
3707
14.32%
Once a month 25.06%
2-3 times a month 21.12%
Once a week 28.16%
2-3 times a week 9.55%
More than 2-3 times a week 1.78%
PriceSens: Price sensitivity
Not important at all
3695
1.14%
Not important 3.82%
Neither important, nor unim-portant
15.21%
Important 42.14%
Very important 37.70%
5.1
Descriptive data analysis
Before we proceed with the econometric analysis, we can gain interesting insights by looking at the raw data. Figure 1 graphs the percentage of Yes/No responses elicited with the CVM in the discrete choice question for each of the four script treatments. Two ob-servations are noteworthy. First, it appears that in all treatments, the elicited values are responsive to prices (bid amounts); we observe a decline of ‘Yes’ responses when the bid amount increases. The 40 cents bid yields statistically significantly lower proportion of ‘Yes’ responses as compared to the 20 cent bid (p-value<0.001); the 70 cent bid yields significantly lower responses than the 40 cent bid (p-value=0.001); the 100 cent bid is also lower and sta-tistically different than the 70 cent bid (p-value=0.015) while the 120 cent bid does not differ with respect to the 100 cent bid (p-value=0.829). In addition, a significant percentage of subjects states a high value for the fair labour certification label even when the bid is up to 120 cents. This is interesting since the amount of 120 cents represents a 171% increase in the price of strawberries (with respect to a price of 70 cents/500 gr). AppendixA.5also lists probit estimates in Table A2 with price amounts as the independent variables (70 cents is the base level), which shows significant price sensitivity for the CVM format. For the IVM format price sensititivity halts after the amount of 70 cents which means that although the IVM may be mitigating one kind of bias, data could still suffer from other kinds of biases (Morkbak et al., 2010).
Second, it appears that the different scripts are not effective in changing response patterns with respect to the control (no script) treatment. This is confirmed by proportion tests where we find that the proportion of ‘Yes’ responses in the Control treatment is not significantly different from the Consequentiality script treatment (p-value=0.225); or the Cheap talk script treatment (p-value=0.720); or the Cheap talk & Consequentiality script treatment (p-value=0.082). We reconfirm these findings in the conditional analysis below and so to save space we’ll confine attention to these results in Appendix A.4.
Figure 1: Percentage of Yes/No responses in the CVM per treatment
What is even more interesting is that the IVM seems to work as advertised. Figure 2
shows that for all bid amounts, the IVM yields a significantly lower proportion of ‘Yes’ responses when compared with the CVM shown in Figure 1. Proportion tests show that differences are highly significant for all bid amounts (p-values<0.001 in all cases). The difference in the proportion of ‘Yes’ is larger than 30% for all bid amounts. This is an indication that the IVM may be more valid for predicting market outcomes.
Figures 3 and 4 compare the elicited value measures (Equivalent loss vs. Willingness to pay) for the CVM and the IVM, respectively. It is obvious that since the proportion of ‘Yes’ responses is higher for WTP than EL, then it is implied that values elicited under WTP are larger than values elicited under EL. Proportions tests confirm the insight that the proportion of ‘Yes’ for WTP is larger than EL under the CVM (p-value=0.017) and under the IVM (p-value<0.001).
5.2
Econometric analysis
To check whether the results obtained above hold under conditional analysis, we esti-mated interval regression models with clustered standard errors at the individual level to account for the fact that each person provided responses under both CVM and IVM.14
14
Figure 2: Percentage of Yes/No responses in the IVM per treatment
[image:19.612.151.462.435.658.2]Figure 4: Percentage of Yes/No responses in the IVM per value measure
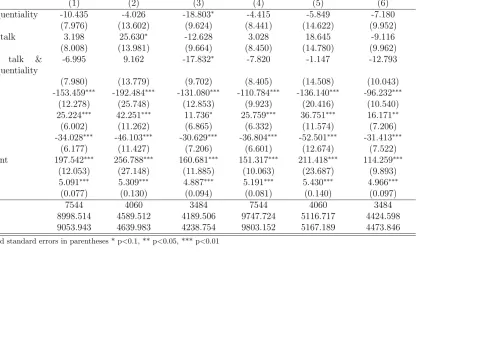
Table 4 shows the coefficient estimates from several specifications. Model (1) is our basic specification where only the treatment variables are included in the regression. We confirm that none of the scripts (Cheap talk, Consequentiality or their combination) has any effect on elicited valuations.15
We provide a more detailed discussion about the script treatment effects in Appendix A.4.
On the other hand, the IVM dummy is highly significant indicating that subjects un-der the IVM are stating lower valuations, which is likely an indication that this method successfully mitigates social desirability and hypothetical bias. The WTP dummy is also highly significant indicating that elicited valuations are higher when the valuation question is framed as a WTP question rather than as an EL question. Our result supports the Tver-sky and Kahneman’s (1991) ‘no loss in buying’ hypothesis which states that buyers do not value the money they give up in a transaction as a loss. To understand why, one needs to consider that if agents are loss averse and the money given for an upgrade is perceived as a loss, then when the upgrade per se is framed as loss avoidance, WTP cannot be higher
variance of WTP is directly estimated (Hanemann and Kanninen,2001).
15
than EL.16
Another possible explanation is that the framing of the EL and WTP questions induced expectations that were opposite to current endowments; that is, subjects in the WTP treatment expected to upgrade while those in the EL treatment expected to down-grade. This latter explanation, combined with the model ofK˝oszegi and Rabin(2006) where expectations, and not the status-quo, act as endowments, would cause WTP to be higher than EL. Finally, there is evidence of significant order effects indicating that when the IVM question was asked first, then subjects tended to align their response in the CVM question. This could be due to the fact that answering the IVM question first and the CVM second, made subjects think about their own biases.
In an effort to improve the credibility of values elicited with hypothetical methods, cer-tainty corrections in the form of follow up questions after value elicitation questions have often been used. The process involves recoding uncertain ‘Yes’ responses as ‘No’ responses. The practical difficulty that arises, however, is the proper determination of the threshold value below which responses should be considered as uncertain. In studies for which both hypothetical and real valuations have been collected, there is a benchmark criterion that can be used. For example, in Champ et al. (1997) and Blumenschein et al. (2001) any person with a response of 9 or lower was classified as ‘uncertain’ and their WTP values were recoded accordingly. The cut-off of 9 was selected because this threshold produced a mean willing-ness to pay that was equivalent to actual willingwilling-ness to pay. InMorrison and Brown(2009), the cut-off was set at 7 because this value aligned hypothetical values with real values. For similar reasons the threshold was set to 7 inEthier et al. (2000) and Poe et al. (2002).
Given that in our study we did not elicit real valuations due to the hypothetical nature of the product, we utilized an idea discussed in Beck et al. (2013) that in order to decide if one model with a certainty correction is ‘better’ than another model with a different certainty correction, the researcher could use model fit statistics to arrive at a conclusion. The assumption behind this idea is that the model that better fits the data, is behaviorally representative of the decision making process. Therefore, we estimated interval regression models with thresholds varying from 6 to 9 and then calculated information criteria like Akaike’s IC and Bayesian IC. Table A4 in Appendix A.5 shows the estimated coefficients from these models and their respective IC. It is obvious that when compared to the basic model with no correction, a model with a threshold for certainty at a value of 8 is the best fitting model.
Given this, we recoded the ‘Yes’ responses in the CVM question using a rating of 8 in the certainty question as the cut-off. Column (2) in Table 4 shows the results. None of
16
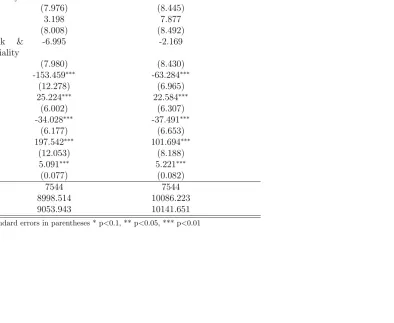
Table 4: Interval regression estimates
Without certainty correction With certainty correction
(1) (2)
Consequentiality -10.435 -2.806
(7.976) (8.445)
Cheap talk 3.198 7.877
(8.008) (8.492)
Cheap talk & Consequentiality
-6.995 -2.169
(7.980) (8.430)
IVM -153.459∗∗∗ -63.284∗∗∗
(12.278) (6.965)
WTP 25.224∗∗∗ 22.584∗∗∗
(6.002) (6.307)
Order -34.028∗∗∗ -37.491∗∗∗
(6.177) (6.653)
Constant 197.542∗∗∗ 101.694∗∗∗
(12.053) (8.188)
ln(σ) 5.091∗∗∗ 5.221∗∗∗
(0.077) (0.082)
N 7544 7544
AIC 8998.514 10086.223
BIC 9053.943 10141.651
Clustered standard errors in parentheses * p<0.1, ** p<0.05, *** p<0.01
our conclusions changes. The only difference we observe with the addition of demographics (estimates are shown in TableA3 in the Appendix A.5) is that for the inconsequential sub-sample, framing of the valuation question does not matter; i.e., we observe that willingness to pay equals equivalent loss.
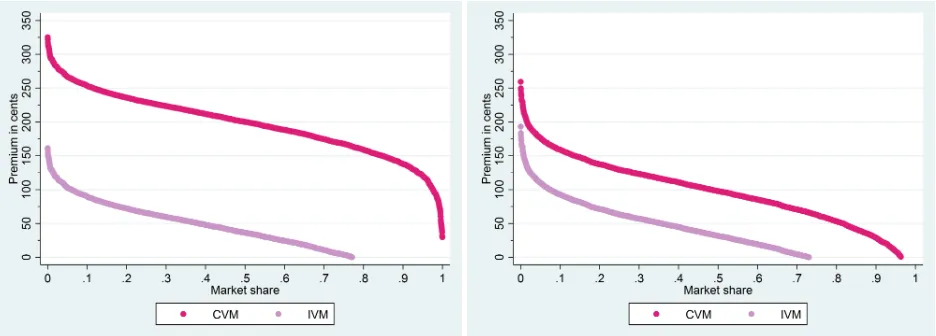
We can then proceed in graphing the aggregate demand curves for strawberries with fair labour certification. Figures5aand5bdo exactly that for valuations elicited with CVM and IVM.17
Given that IVM mitigates social desirability bias and the importance of certainty in elicited valuations, it would be advisable for producers and retailers to base their marketing decisions on the IVM curve of Figure 5b. Each point on this curve indicates the percentage of respondents that would buy half a kilo of strawberries with fair labour certification at the premium projected on the Y axis. The fact that the IVM curve intersects the X axis indicates that a percentage of consumers would not buy strawberries with fair labour certification even when these are offered at no premium at all.
(a) Derived from model (1) in TableA3(w/o cer-tainty correction)
[image:23.612.75.543.315.483.2](b) Derived from model (4) in Table A3 (w/ cer-tainty correction)
Figure 5: Aggregate demand curves for the CVM and IVM
17
6
Conclusions and discussion
There have been increasing calls around the world for urgent action to tackle widespread abuse of migrant workers in the agri-food sector. In addition, the 2030 Agenda for Sus-tainable Development, clearly states the promotion of full and productive employment and decent work for all, as one of its main goals (Goal 8).18
This paper sought to contribute to the debate regarding the controversy about the trade-offs between fair working conditions and the competitiveness of local agricultural products. To do so, we used a Contingent Val-uation survey designed to uncover the underlying preferences of Greek consumers towards a food labeling system that certifies fair working conditions for the workers employed at all production stages of agricultural products. In addition to this important empirical objective, we also examined several methodological issues; i.e, how we can mitigate hypothetical bias, social desirability bias, and lack of consequentiality. We also examined predictions of refer-ence dependent theory by testing whether framing the valuation question as an ‘Equivalent Loss’ (EL) differs from the classical ‘Willingness-to-pay’ elicitation.
Given the widely reported tendency for respondents to overstate their WTP in stated preferences studies, it seems reasonable to suggest that the IVM was more successful than using a short cheap talk script in mitigating social desirability bias. However, none of the scripts we employed (i.e., cheap talk, consequentiality and their combination) had any effect on elicited valuations. For the consequentiality script, this is surprising given that it has emerged as an important addition to standard CVM studies (Vossler and Evans, 2009;
Vossler and Watson, 2013). For the cheap talk script, on the other hand, our finding is not uncommon given the mixed results obtained in the literature. However, we do not wish to downplay a well established strand of the literature which has identified the effectiveness of cheap talk scripts in mitigating hypothetical bias (e.g., Lusk, 2003; Morrison and Brown,
2009; Ozdemir et al.¨ , 2009). One way to interpret our null result from the evaluation of these two scripts is that using scripts from previous studies is not a panacea that will work in every single study.
One of the reviewers of our paper offers another explanation for the ineffectiveness of the consequentiality script. S/he advances the argument that in other consequentiality studies there has been a clearly defined institution responsible for implementing certain
manage-18
ment actions of laws. However, in our case there is no single institution that implements changes because the set of producers, traders and retailers is a very large one. As such, the consequentiality script might lack credibility and this could explain the ineffectiveness of the consequentiality script. The reviewer correctly notes that the context of the script we used is different from, for example, that ofVossler and Evans (2009) in which there was an actual referendum with binding consequences where they noted to voters that the experimenters would use their votes ‘. . . as advice on whether or not to pass the referendum’. However, for the survey to be consequential, it does not have to be that all producers should coordinate in producing fair labour labelled products or that the law mandates an action (we will discuss momentarily why the fair labour label should be looked at as a voluntary scheme). We could plausibly assume that if agents are profit maximizers and they find that they can make more money by certifying their products as fair labour products, then they would be better off using a fair labour label. That is, the survey could be seen as consequential if market forces could drive just a small part of the supply chain to demand a fair labour product due to consumer demand.
of preferences. We agree with Oehlmann and Meyerhoff(2016) that more research is needed to further test the conditions of the effectiveness of consequentiality scripts in reducing hy-pothetical bias in different contexts.
Our results also show that values elicited under WTP are larger than values elicited under EL, which supports Tversky and Kahneman’s (1991) ‘no loss in buying’ hypothesis; i.e., that buyers do not consider the money they give up in a transaction as a loss orK˝oszegi and Rabin’s (2006) as a model of expectation-based preferences, especially if our framing has reversed the perception of the status-quo. When social desirability is taken out of our estimates and we correct for uncertainty, we find that consumers are willing to pay an average premium of 53 cents per 500 gr, 95% CI [43.9, 62.3], of strawberries with fair labour certification19
, which is equivalent to 72.6% of the average realized mode price for April-May 2014 (which was ate1.46/Kg). This can be valuable information for producers and retailers
that seek to differentiate their products and who are wondering whether costs associated with product differentiation can be recouped from potential customers.
The fair labour label should not be looked at as a scheme that would force all farmers to offer better working conditions and hire only green card holders. We believe that a mandatory scheme would not be viable given that a law mandating the hiring of only green card holders could not always be enforced. In addition, enforcement of a labelling scheme could have all the unintended consequences that states like Georgia in the United States experienced after the mandatory introduction of E-verify. This drove illegal immigrants out of the state with devastating consequences for farmers. A voluntary scheme, on the other hand, would create the right incentives for some producers to differentiate their products, sell these at a higher premium, and avoid a market where only ‘lemons’ are sold (Akerlof,1970). In addition, consumers are benefited if both types of products exist in the market since some consumers may not afford the price premiums that fair labour products would demand in order to be available in the market. This is for the same reason that not all consumers can afford fair trade products. For this segment of the market, a mandatory labelling scheme would likely create undesirable substitutions between local (subject to mandatory labelling) and imported (not subject to mandatory labelling) food products.
All in all, our study provides the first economic estimates in the literature of premiums associated with fair labour certification and shows that while fair labour certification is a road not yet taken, it might carry significant benefits for crop labourers, producers and consumers. The positive premiums that our respondents are willing to pay, suggest that people are aware of fair labour issues and value the better treatment of workers in the agricultural sector.
19
References
Aadland, D. and A. J. Caplan (2003). Willingness to Pay for Curbside Recycling with Detection and Mitigation of Hypothetical Bias. American Journal of Agricultural Eco-nomics 85(2), 492–502.
Aadland, D. and A. J. Caplan (2006). Cheap talk reconsidered: New evidence from CVM.
Journal of Economic Behavior & Organization 60(4), 562–578.
Akerlof, G. A. (1970). The market for ‘lemons’: Quality uncertainty and the market mech-anism. The Quarterly Journal of Economics 84(3), 488–500.
Arrow, K., R. Solow, P. R. Portney, E. E. Leamer, R. Radner, and H. Schuman (1993). Report of the NOAA panel of contingent valuation. Federal Register 58, 4601–4614.
Bateman, I. J., I. H. Langford, A. Munro, C. Starmer, and R. Sugden (2000). Estimating four Hicksian welfare measures for a public good: A contingent valuation investigation.
Land Economics 76(3), 355–373.
Beck, M. J., J. M. Rose, and D. A. Hensher (2013). Consistently inconsistent: The role of certainty, acceptability and scale in choice. Transportation Research Part E: Logistics and Transportation Review 56, 81–93.
Blumenschein, K., G. C. Blomquist, M. Johannesson, N. Horn, and P. Freeman (2007). Eliciting willingness to pay without bias: Evidence from a field experiment. The Economic Journal 118(525), 114–137.
Blumenschein, K., M. Johannesson, K. K. Yokoyama, and P. Freeman (2001). Hypothetical versus real willingness to pay in the health care sector: Results from a field experiment.
Journal of Health Economics 20, 441–457.
Bohn, S., M. Lofstrom, and S. Raphael (2015). Do e-verify mandates improve labor mar-ket outcomes of low-skilled native and legal immigrant workers? Southern Economic Journal 81(4), 960–979.
Brown, T. C., I. Ajzen, and D. Hrubes (2003). Further tests of entreaties to avoid hypothet-ical bias in referendum contingent valuation. Journal of Environmental Economics and Management 46(2), 353–361.
Bulte, E., S. Gerking, J. A. List, and A. de Zeeuw (2005). The effect of varying the causes of environmental problems on stated WTP values: Evidence from a field study. Journal of Environmental Economics and Management 49(2), 330–342.
Buzby, J. C., J. A. Fox, R. C. Ready, and S. R. Crutchfield (1998). Measuring consumer ben-efits of food safety risk reductions. Journal of Agricultural and Applied Economics 30(1), 69–82.
Cameron, T. A. (1988). A new paradigm for valuing non-market goods using referendum data: Maximum likelihood estimation by censored logistic regression. Journal of Environ-mental Economics and Management 15(3), 355–379.
Cameron, T. A. and M. D. James (1987). Efficient estimation methods for “closed-ended” contingent valuation surveys. The Review of Economics and Statistics 69(2), 269–276.
Carson, R. T. (2012). Contingent valuation: A practical alternative when prices aren’t available. Journal of Economic Perspectives 26(4), 27–42.
Carson, R. T., N. E. Flores, and N. F. Meade (2001). Contingent valuation: Controversies and evidence. Environmental and Resource Economics 19(2), 173–210.
Carson, R. T. and T. Groves (2007). Incentive and informational properties of preference questions. Environmental and Resource Economics 37(1), 181–210.
Carson, R. T., T. Groves, and J. A. List (2014). Consequentiality: A theoretical and experi-mental exploration of a single binary choice. Journal of the Association of Environmental and Resource Economists 1(1), 171–207.
Carson, R. T., T. Groves, and M. J. Machina (1997). Stated preference questions: Con-text and optimal response. Paper presented at the National science foundation preference elicitation symposium, University of California, Berkeley.
Champ, P. A., R. C. Bishop, T. C. Brown, and D. W. McCollum (1997). Using dona-tion mechanisms to value nonuse benefits from public goods. Journal of Environmental Economics and Management 33(2), 151–162.
Champ, P. A., R. Moore, and R. C. Bishop (2009). A comparison of approaches to mitigate hypothetical bias.
Corsi, A. (2007). Ambiguity of measured WTP for quality improvements when quantity is unconstrained: A note. European Review of Agricultural Economics 34(4), 501–515.
Cummings, R. G., G. W. Harrison, and L. L. Osborne (1995). Can the bias of contingent valuation be reduced? Evidence from the laboratory. College of Business Administration, University of South Carolina, Economics Working Paper B-95-03 3.
Cummings, R. G. and L. O. Taylor (1999). Unbiased value estimates for environmental goods: a cheap talk design for the contingent valuation method. The American Economic Review 89(3), 649–665.
Czajkowski, M., C. A. Vossler, W. Budzi´nski, A. Wi´sniewska, and E. Zawojska (2015). Addressing empirical challenges related to the incentive compatibility of stated preference methods.University of Warsaw, Faculty of Economic Sciences working paper No. 31/2015 (179).
Dragusanu, R., D. Giovannucci, and N. Nunn (2014). The economics of fair trade. Journal of Economic Perspectives 28(3), 217–236.
Dummett, M. and R. Farquharson (1961). Stability in voting. Econometrica 29(1), 33–43.
Dupont, D. P. and I. J. Bateman (2012). Political affiliation and willingness to pay: An examination of the nature of benefits and means of provision.Ecological Economics 75(0), 43–51.
Ethier, R. G., G. L. Poe, W. D. Schulze, and J. Clark (2000). A comparison of hypothetical phone and mail contingent valuation responses for green-pricing electricity programs.Land Economics 76(1), 54–67.
Eurostat (2016). Population on 1 January by five year age group, sex and citizen-ship. Available at http://appsso.eurostat.ec.europa.eu/nui/show.do?dataset= migr_pop1ctz&lang=en(Last accessed on August 3, 2016).
Frederick, S. (2012). Overestimating others willingness to pay. Journal of Consumer Re-search 39(1), 1–21.
Gibbard, A. (1973). Manipulation of voting schemes: A general result. Econometrica 41(4), 587–601.
Haab, T. C., M. G. Interis, D. R. Petrolia, and J. C. Whitehead (2013). From hopeless to curious? Thoughts on Hausman’s dubious to hopeless critique of contingent valuation.
Hanemann, M. and B. Kanninen (2001). The Statistical Analysis of Discrete-Response CV Data. In Valuing environmental preferences: Theory and practice of the contingent valuation method in the US, EU, and developing countries, pp. 302.
Herriges, J., C. Kling, C.-C. Liu, and J. Tobias (2010). What are the consequences of consequentiality? Journal of Environmental Economics and Management 59(1), 67–81.
Howard, P. H. and P. Allen (2006). Beyond organic: Consumer interest in new labelling schemes in the central coast of California. International Journal of Consumer Stud-ies 30(5), 439–451.
Howard, P. H. and P. Allen (2010). Beyond organic and fair trade? An analysis of ecolabel preferences in the united states. Rural Sociology 75(2), 244–269.
Hustvedt, G. and J. C. Bernard (2010). Effects of social responsibility labelling and brand on willingness to pay for apparel.International Journal of Consumer Studies 34(6), 619–626.
Kasimis, C. (2008). Survival and expansion: migrants in Greek rural regions. Population, Space and Place 14(6), 511–524.
Kasimis, C. and A. G. Papadopoulos (2005). The multifunctional role of migrants in the Greek countryside: implications for the rural economy and society. Journal of Ethnic and Migration Studies 31(1), 99–127.
Kasimis, C. and A. G. Papadopoulos (2013). Rural transformations and family farming in contemporary Greece. In D. Ortiz-Miranda, A. Moragues-Faus, and E. Arnalte-Alegre (Eds.),Agriculture in Mediterranean Europe: Between Old and New Paradigms, pp. 263– 293.
Kasimis, C., A. G. Papadopoulos, and E. Zacopoulou (2003). Migrants in rural Greece.
Sociologia Ruralis 43(2), 167–184.
K˝oszegi, B. and M. Rabin (2006). A model of reference-dependent preferences.The Quarterly Journal of Economics 121(4), 1133–1165.
Kling, C. L., D. J. Phaneuf, and J. Zhao (2012). From Exxon to BP: Has some number become better than no number? Journal of Economic Perspectives 26(4), 3–26.
Levitt, S. D. and J. A. List (2007). What do laboratory experiments measuring social preferences reveal about the real world? Journal of Economic Perspectives 21(2), 153– 174.
List, J. A. (2001). Do explicit warnings eliminate the hypothetical bias in elicitation proce-dures? Evidence from field auctions for sportscards. American Economic Review 91(5), 1498–1507.
List, J. A. and M. K. Price (2013). Using field experiments in environmental and resource economics. NBER Working Paper No. 19289.
Loewenstein, G. and D. Adler (1995). A bias in the prediction of tastes. The Economic Journal 105(431), 929–937.
Loomis, J., T. Brown, B. Lucero, and G. Peterson (1996). Improving validity experiments of contingent valuation methods: Results of efforts to reduce the disparity of hypothetical and actual willingness to pay. Land Economics, 450–461.
Lusk, J. L. (2003). Effects of cheap talk on consumer willingness-to-pay for golden rice.
American Journal of Agricultural Economics 85(4), 840–856.
Lusk, J. L. and B. F. Norwood (2009a). Bridging the gap between laboratory experiments and naturally occurring markets: An inferred valuation method.Journal of Environmental Economic and Management 58(2), 236–250.
Lusk, J. L. and B. F. Norwood (2009b). An inferred valuation method. Land Eco-nomics 85(3), 500–514.
Mcardle, M. (2012). Georgia’s harsh immigration law costs millions in unharvested crops.
The Atlantic. Available athttp: // www. theatlantic. com/ business/ archive/ 2011/ 06/ georgias-harsh-immigration-law-costs-millions-in-unharvested-crops/ 240774/ (last accessed August 3, 2016).
Mediamark Research and Intelligence (2009). Despite decades of gains in the workforce, women still the predominant household shoppers.http://prn.to/2anzpuO(Last accessed on August 05, 2016).
Morkbak, M. R., T. Christensen, and D. Gyrd-Hansen (2010). Choke price bias in choice experiments. Environmental and Resource Economics 45(4), 537–551.
Morrison, M. and T. C. Brown (2009). Testing the effectiveness of certainty scales, cheap talk, and dissonance-minimization in reducing hypothetical bias in contingent valuation studies. Environmental and Resource Economics 44(3), 307–326.
Murphy, J. J., T. Stevens, and D. Weatherhead (2005). Is cheap talk effective at elimi-nating hypothetical bias in a provision point mechanism? Environmental and Resource Economics 30(3), 327–343.
Oehlmann, M. and J. Meyerhoff (2016). Stated preferences towards renewable energy al-ternatives in Germany - do the consequentiality of the survey and trust in institutions matter? Journal of Environmental Economics and Policy, 1–16.
¨
Ozdemir, S., F. R. Johnson, and A. B. Hauber (2009). Hypothetical bias, cheap talk, and stated willingness to pay for health care. Journal of Health Economics 28(4), 894–901.
Poe, G. L., J. E. Clark, D. Rondeau, and W. D. Schulze (2002). Provision point mecha-nisms and field validity tests of contingent valuation. Environmental and Resource Eco-nomics 23(1), 105–131.
Poe, G. L. and C. A. Vossler (2011). Consequentiality and contingent values: An emerging paradigm. In J. Bennett (Ed.),The international handbook on non-market environmental valuation, pp. 122–141. Cheltenham, UK: Edward Elgar Publishing Limited.
Poinssot, A. (2013, June). The migrant workers trapped in slave-like conditions in Greece. Available at http://www.mediapart.fr/journal/international/230613/ migrant-workers-trapped-slave-conditions-greece (Last accessed on August 5, 2016).
Powell, B. (2012). The law of unintended consequences: Georgia’s immigration law back-fires. Forbes. Available at http: // www. forbes. com/ sites/ realspin/ 2012/ 05/ 17/ the-law-of-unintended-consequences-georgias-immigration-law-backfires/ #355eb7b0404a (last accessed August 3, 2016).
Pronin, E. (2007). Perception and misperception of bias in human judgment. Trends in Cognitive Sciences 11(1), 37–43.
Rheinberger, C. and F. Schl¨apfer (2015). Its the cost credibility, stupid! A comment on “Consequentiality: A theoretical and experimental exploration of a single binary choice”.
Toulouse School of Economics Working Paper n. 15-573.
Satterthwaite, M. A. (1975). Strategy-proofness and Arrow’s conditions: Existence and correspondence theorems for voting procedures and social welfare functions. Journal of Economic Theory 10(2), 187–217.
Silva, A., R. M. Nayga Jr, B. L. Campbell, and J. L. Park (2011). Revisiting cheap talk with new evidence from a field experiment. Journal of Agricultural and Resource Economics, 280–291.
St¨ober, J. (2001). The social desirability scale-17 (sds-17): Convergent validity, discriminant validity, and relationship with age. European Journal of Psychological Assessment 17(3), 222–232.
Svensson, L.-G. and A. Reffgen (2014). The proof of the Gibbard-Satterthwaite theorem revisited. Journal of Mathematical Economics 55(0), 11–14.
Tversky, A. and D. Kahneman (1991). Loss aversion in riskless choice: A reference-dependent model. The Quarterly Journal of Economics 106(4), 1039–1061.
Tversky, A. and D. Kahneman (1992). Advances in prospect theory: Cumulative represen-tation of uncertainty. Journal of Risk and Uncertainty 5(4), 297–323.
van Boven, L., D. Dunning, and G. Loewenstein (2000). Egocentric empathy gaps between owners and buyers: Misperceptions of the endowment effect. Journal of Personality and Social Psychology 79(1), 66–76.
van Boven, L., G. Loewenstein, and D. Dunning (2003). Mispredicting the endowment effect: Underestimation of owners selling prices by buyers agents. Journal of Economic Behavior & Organization 51(3), 351–365.
Vossler, C. A., M. Doyon, and D. Rondeau (2012). Truth in consequentiality: Theory and field evidence on discrete choice experiments. American Economic Journal: Microeco-nomics 4(4), 145–71.
Vossler, C. A. and S. B. Watson (2013). Understanding the consequences of consequentiality: Testing the validity of stated preferences in the field. Journal of Economic Behavior & Organization 86, 137 147.
Whitehead, J. C., M. S. Weddell, and P. A. Groothuis (2016). Mitigating hypothetical bias in stated preference data: Evidence from sports tourism. Economic Inquiry 54(1), 605–611.
A
Appendix
A.1
Questionnaire scripts
Information for the fair labor informational script was compiled from three relevant to the fair labor label websites: an auditing non-profit organization that formally measures and accredits best employment practices (http://www.fairworkingconditions.ie), the fair labor association (http://www.fairlabor.org) and the Food Alliance certification pro-gramme (http://foodalliance.org). The script read like this:
“The Fair Labor label [show picture 1]20
can be certified by various organi-zations like the Fair Working Conditions.ie which is a non-profit international organization that aims in recognizing and improving employment conditions. Such a label ensures that the product is produced in a business farm that strictly follows the standards set by the International Labour Organisation (ILO). These standards concern the maximum number of working hours per week, the legal compensation and labor benefits required by state law for each activity sector as well as workers’ hygiene conditions in their working place. In addition, the standards prohibit child labor and bind the employer for no discrimination on the basis of race, nationality, or any other criteria.”
A.2
Pictures
20
Picture 2
A.3
Selection of bid amounts
To select the bid amounts for the discrete choice valuation question, we first examined historical data for strawberries from the Athens Central Market Organization S.A. which is one of the major markets for vegetable and meat wholesalers in Greece.21
The historical data show that the bulk of strawberry sales takes place between April and May (smaller quantities of strawberries are also traded in February, March and June) which also determined the data collection period of our survey-experiment. A simple linear projection of strawberry prices with data from April 2008 to May 2013, projected an average mode price for April-May 2014 at e1.458/Kg. This is remarkably close to the realized average mode price for
April-May 2014 at e1.465/Kg. Given that our valuation product was selected to be a pack of
500gr of strawberries (corresponding projected price ise0.73/500 gr) and that the valuation
question concerned an upgrade (or downgrade, depending on the elicited valuation measure), we decided that our price range would center arounde0.70 taking also into account feedback
from a pilot survey. Therefore, the full price range was selected as: 20 cents, 40 cents, 70 cents, 100 cents and 120 cents.
A.4
Cheap talk and consequentiality treatment effects
An explanation about why the consequentiality script does not appear to have a signifi-cant treatment effect can be provided by regressing the treatment dummies on the five point Likert consequentiality question by means of an ordered probit model. None, of the treat-ment dummies has any effect on the perceived consequentiality of the survey which is to be interpreted that the consequentiality script failed to change subjects’ beliefs about whether their answers in the survey could potentially affect the decision of producers and retailers to adopt fair labour practices.
As we have discussed in previous sections, recent literature has argued that consequen-tiality is ne