Munich Personal RePEc Archive
Debt concentration of European Firms
Giannetti, Caterina
Luiss School of European Political Economy
12 March 2015
Online at
https://mpra.ub.uni-muenchen.de/63002/
Debt concentration of European Firms
Caterina Giannetti1
12th March 2015
Abstract
This paper investigates the level of debt specialization across European firms relying on a cross-country comparable sample of manufacturing firms. We find that a number of firm characteristics – such as firm size and age – help predict the firm composition of the various types of debts (i.e. debt specialization) but not the level of each debt share. In particular, we observe that small and young firms have a more concentrated debt structure (i.e. they rely on few types of debt). However, these relationships are not linear and seem to be U-shaped. We also find that Spanish firms have the most diversified debt structure, and that diversified firms are less likely to experience a severe reduction in turnover.
Keywords: Debt specialization, European firms, Firm financing
JEL Classification: F20; G32.
1Luiss School of European Political Economy (SEP).Address: Via di Villa Emiliani 14, 00197 Rome, Italy. Tel:
+39-06-85225712.Fax:+39-06-85225056.Email:: cgiannetti@luiss.it
1
Introduction
Traditionally bank loans constitute the main source of debt financing for the majority of Euro-pean firms. As the recent financial crisis has shown, EuroEuro-pean firms are thus more vulnerable when bank lending tightens. A well developed bond market may therefore represent an alter-native source of funding for the real economy when credit squeezes. If a firm can easily access external capital markets and/or switch to alternative sources of funding, the risk of being af-fected by a negative shocks experienced by its bank-loan providers is notably reduced (see Aoki and Nikolov (2012); De Fiore and Uhlig (2012)).
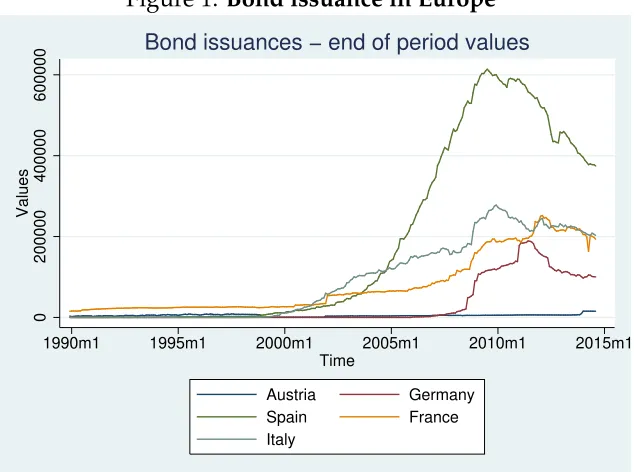
Indeed, in the recent years, debt capital markets seem to be growing in Europe: issuance of non-financial corporations has boomed in Europe (see Figure (1)), and surpassed for the first time in the crisis year 2009 US issuances (see (Kaya et al., 2013)). Despite such an increase in bond issuances, bonds may remain a fairly exclusive funding instrument (see, for example, De-nis and Mihov (2003)). Thus, establishing whether this trend is governed by the users of capital or by the suppliers of capital has important policy implications and it has recently attracted the attention of several scholars (see, for example, Custódio et al. (2013)).
The majority of these studies, however, consider only a few types of debts (for example, bank-loans vs bonds, or short-term vs long-term bonds). In reality, firms rely on a variety of sources of funding. In this regard, the present paper contributes to this policy debate in three ways. First, we document the pattern of correlations between firm characteristics and debt structure across seven European countries (Austria, France, Germany, Hungary, Italy, Spain, and the United Kingdom). The second contribution of this paper is an analysis at a firm level of the determinant of debt specialization (i.e. of the use of various types of debt), along with an attempt to identify which part of it is driven by demand factors. The third contribution is to provide evidence on the (causal) relationship between firm debt concentration and firm turnover reduction.
Figure 1: Bond issuance in Europe
0
200000
400000
600000
Values
1990m1 1995m1 2000m1 2005m1 2010m1 2015m1
Time
Austria Germany
Spain France
Italy
Bond issuances − end of period values
Source: Bank of Italy
our sample.
This paper is also related to the growing literature studying the capital structure variation and the determinant of debt maturity structure, also known as “granularity of corporate debt.” It is well known that short-term debt have several disadvantages. For firms without access to other funds to meet debt repayments, short-term debt can for example lead to early firm liquidation (see Diamond (1991)). However, a recent strand of the literature suggests that firms manage multiple bond issues with different times maturities to mitigate rollover risk and debt overhang (Choi et al. (2013); Diamond and He (2014)). For example, Choi et al. (2013) show that it is less costly for a firm to be exposed to small rollover risks at two points in time rather than being exposed to a large rollover risk at one point in time. They also document a substantial variation in debt granularity among firms. That is, a large number of firms have a highly dispersed maturity structures, while others have a low dispersed maturity structure. They finally document that firm debt becomes more granular during economic downturns (when rollover risks are higher). We contribute to this debate by considering various types of debt with different maturities.
seem to be U-shaped. We also observe that more opaque firms have a less concentrated struc-ture. Among these group of European countries, Spanish and German firms have the most diversified debt structure.
We then investigate the determinant of each debt share. Interestingly we find that, apart from each country characteristics, only a few (but distinct group) of firm characteristics help explain the level of each debt share. In particular, being listed on the stock-market now seems to explain the share of short and long-term bank debt, whereas doing R&D (i.e. our proxy for more opaque firms) does not affect any type of debt share. Always controlling for financial constrained firms, we also find again that firms in Italy, Spain and Hungary rely on a greater share of short-term bank loans. We conclude that firm age and size seem to significantly affect the way firms combine the different types of debt but not the level of each debt share, while being listed in the stock market seems to only affect the level of the share of bank debt (both short-term and long-term). Spanish and German firms have the most diversified debt structure. Further, we investigate whether the different level of debt concentration of European firms is a result of supply or demand-side factors. To do that, we compare in each country financially constrained firms with non-financially constrained firms (to control for the supply effect of bank loans) versus the same difference for firms located in Germany (to control for the demand effect in the securities market). We find that firms located in Spain chose to rely on the most diversified debt structure, though the effect is not economically sizeable.
Finally, we study the relationship between firm debt concentration and turnover reduction. Relying on IV-setting, we find that firms with a more diversified debt structure are less likely to experience a severe reduction in turnover.
The remainder of the paper is structured as follows: Section 2 introduces the dataset used in the current study and analyze the debt structure in each European countries. Section 3 relies on multivariate regressions to relate firm characteristics to debt specialization of firm, while Section 5 investigates the demand and supply-side factors of debt specialization on firms. Sec-tion 6 studies the relaSec-tionship between firm debt concentraSec-tion and turnover reducSec-tion. Finally, Section 6 summarizes and concludes our argument.
2
Data description.
In this paper, we rely on the recently released EFIGE dataset collected within the project
“Euro-pean Firms In a Global Economy: internal policies for external competitiveness”.1 The dataset
covers a representative and cross-country comparable sample of manufacturing firms across seven European countries: Austria, France, Germany, Hungary, Italy, Spain, the UK. The data are fully comparable across countries, since it is derived from responses to the same question-naire. The sampling design follows a stratification by industry, region and firm size structure. To allow adequate statistical inference appropriate sample weights will then be used in the
following analysis.
The EFIGE survey includes a wide range of questions which allow us to build both quali-tative and quantiquali-tative variables on firms’ characteristics and activities (e.g. proprietary struc-ture of the firm; R&D investment, internationalization). Some of these questions refer to 2008, whereas others ask for information related to 2009 compared to years 2008/2007 (see Table (1) and (3)) for a full description of the firm characteristics we will use). This dataset provides more than just balance-sheet information and enables us to address important issues related to the firm financing. Specifically, in relation to firm debt structure, the dataset allows us to collect the share of bank-loans and securities – both short-term and long-term – along with the share of other financial instruments (see Table (2)). In particular, the dataset also allow us to have in-formation on financial constrained firms, as firms are directly asked whether they applied for a bank loan, and if so, if their demand was successful or rejected. We can also clearly distinguish between listed and non-listed firms (see again Table (3)). These variables are important since they allow us to clearly distinguish between different hypotheses for debt specialization.
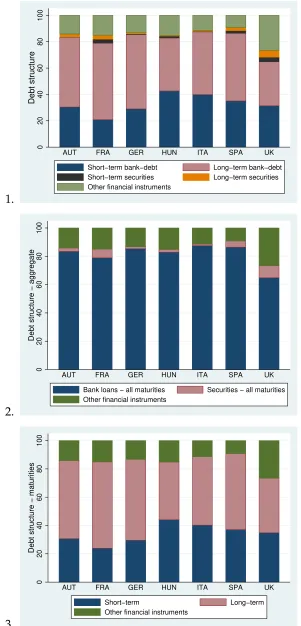
The EFIGE dataset shows some interesting phenomena concerning the sources of funding of European firms. Some of them are well known phenomena. Specifically, if we analyze firm debt structure, we can see that in bank-based countries (Italy, Spain and Austria) the share of bank debt is quite high, whereas in market-based countries (United Kingdom and France) the share of debt securities is much larger (see the value of these shares in panel 1 and 2 of Figure (2)). However, we can also observe that the share of short-term bank loans and securities is higher in Spain, Hungary and Italy compared to Germany, whereas the share of long-term bank loans is lower. In Spain, however, firms can rely on a larger share of long-term securities. In addition, in all these countries, the shares of debt securities remain fairly low (see panel 2 of Figure ((2)). Moreover, if we consider all types of debts together according to their maturities (see panel 3 of Figure (2)), we can see that in Hungary and Italy there is a higher share of short-term debt.
The EFIGE dataset also highlights other interesting phenomena. In particular, we can ob-serve that German firms have a more diversified debt structure compared to other European firms. However, to see this latter phenomena, we need to summarize the information about the debt structure of each firm at the end of year into a synthetic indicator (for a similar study in the US see Colla et al. (2013)). That is, we need to combine into a single indicator the in-formation on the relative amount of bank debt vs corporate securities - both short-term and long-term (see again Figure (2)). This will be the scope of the next section, where we chose to rely on the traditional Herfindhal-Hirschmann Index (in the following HHI) as our measure of debt-concentration.
3
Determinants of firms debt concentration.
Figure 2:
Debt structure of European firms (2008)
1.
0
20
40
60
80
100
Debt structure
AUT FRA GER HUN ITA SPA UK
Short−term bank−debt Long−term bank−debt Short−term securities Long−term securities Other financial instruments
2.
0
20
40
60
80
100
Debt structure − aggregate
AUT FRA GER HUN ITA SPA UK
Bank loans − all maturities Securities − all maturities Other financial instruments
3.
0
20
40
60
80
100
Debt structure − maturities
AUT FRA GER HUN ITA SPA UK
Short−term Long−term
Other financial instruments
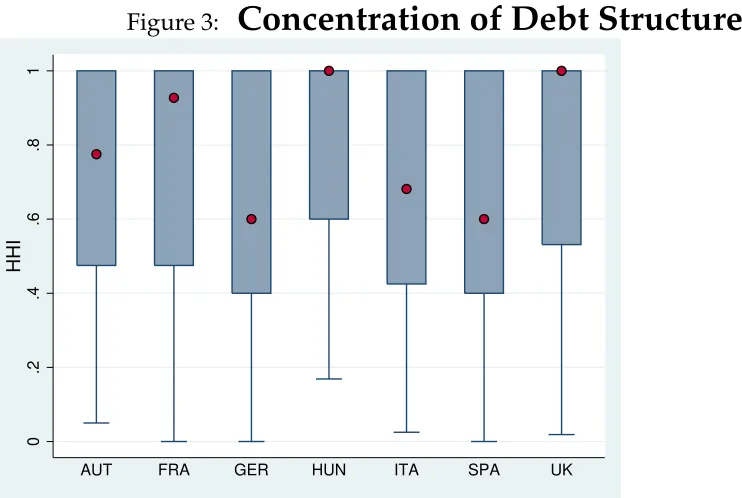
Figure 3:
Concentration of Debt Structure (HHI)
0
.2
.4
.6
.8
1
HHI
AUT FRA GER HUN ITA SPA UK
Note: The HHI index is constructed as the (squared) sum of each debt share in 2009. It assumes the maximum value of one when there is only one source of funding, and the minimum value of zero when the debt is equally divided among all sources. The graph represents the (weighted) distribution for each country of the HHI index over the firms in the sample. The red circle represents the median level.
HH I=[(short−term bank loans)2+ (long−term bank loans)2+ (short−term securities)2+ (long−term securities)2+ (other f inancial instruments)2]−1/5
1−1/5
The index assumes the maximum value of one when there is only one source of funding, and thus the maximum degree of debt specialization. The index assumes instead the value of zero when the firm equally divides the debt across all sources of funding. Relying on EFIGE-data we computed this index for each firms in the sample and averaged it across countries (using the appropriate weights to account for the probability of each firm of being sampled). As Figure (3) shows, the value of the HHI is quite high in all European countries, with the median level being to the maximum in some of them, suggesting that European firms do not tend to diversify their debt. Firms located in Germany and Spain seem to have the most diversified structure among these group of countries.
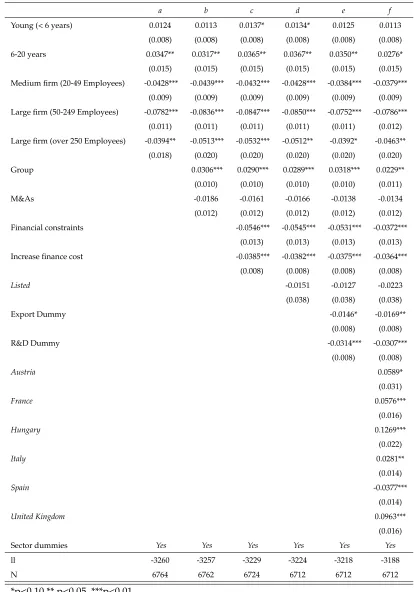
In column (a) we start with a dummy for each age class of the firms. The base category are firms older than 20 years old. We can observe that firms aged between 6-20 years old have a higher concentrated debt structure (+3.5%), while young firms (less than 6 years old) seem also to have a slightly higher concentrated structure (+1%), though the coefficient is not sta-tistically significant. There seems to be thus a U-inverse relationship between firm age and debt concentration. We then examine the structure of debt concentration across firms of dif-ferent size. In column (b) we thus add a dummy for each size class (in terms of number of employees). The base category are small firms (with 10-19 employees). As the coefficient on each category is negative, the grower the firms, the lower will be the concentration index. As it has been highlighted several times in the literature (Berger and F Udell (1998)), small firms cannot rely on several sources of funding as for them the (fixed) costs to access to capital mar-kets are higher. This relationship, however, is not linear, and there seems to be a U-relationship between firm size and debt concentration: medium size firms (20-49 employees) have a debt concentration 4% less concentrated, large firms (50-249 employees) 8% less concentrated, and very large firms (over 250 employees) 4% less concentrate. This latter result is consistent with a theoretical model in which banks offer more flexibility than market lenders when the firm is in distress but – outside of financial distress – bank lending have higher intermediation costs than markets (see Crouzet (2014), Bolton and Scharfstein (1996)): when the cost of lending of banks relative to those of markets increases substantially, medium-sized firms switch to a more market-financed debt structure (i.e. a higher concentration debt index).
In column (c) we add a dummy for firms belonging to a group (Group) and that have been
involved in mergers and acquisition deals (M&As). Only being part of a group seems to
posi-tively and significantly affect firm debt structure (+3%).
In column (d) we add a dummy equal to one for firms that declared to have been financial
constrained (Financial constraints) and experienced an increase in the cost of bank lending (
In-crease finance cost) in 2009. As one would expect, these variables have a negative effect, which is statically and economically significant (about 5% less concentrated), on debt concentration. Firms that were not (fully or partially) granted bank loans, either successfully looked for alter-native sources of funding or did not reach the desired amount of credit, resulting in a lower value of the HHI index. To investigate whether information asymmetries are responsible for different debt concentration, we then add a dummy equal to one for firms involved in R&D
activities (R&D) - as a proxies for firm opaqueness, and a dummy for firm operating outside
the domestic market (Export). Even in this case, these variables have a negative impact on debt
concentration. This result is robust if we replace the R&D dummy with its percentage of
firm-turnover, and contrasts with Colla et al. (2013).2 In column (e), we add a dummy for listed
firms. Though as expected the coefficient is negative (i.e. listed firms are expected to rely on more source of funding by having easier access to bond markets), it is not statically significant.
2To control if R&D is capturing firm growth opportunities, we also added the share of reduction in turnover
Finally, in column (f) we add a dummy for each country in our dataset to account for all the (unobservable) macroeconomic conditions which may affect debt concentration in year 2009 (such as short-term rate, inflation or default spread, see (Erel et al. (2012))). The base category are firms located in Germany. In all countries but Spain, firms have a higher concentration debt index compared to firms located in Germany. For example, Hungarian firms have a debt struc-ture that is about 13% more concentrated than German firms. This analysis of the Efige-data seems thus to suggest that German and Spanish firms have the most diversified debt structure in Europe.
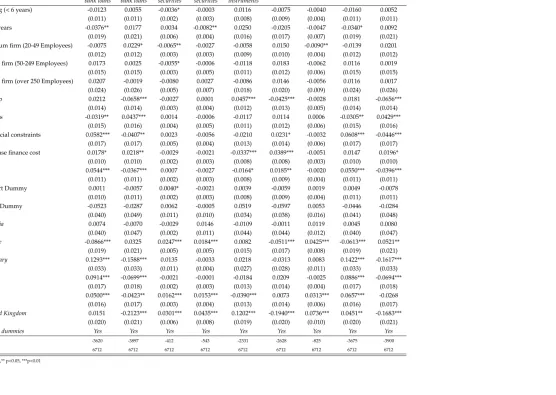
In Table (6) we now study the determinants of each debt component (i.e. a single regression for each share of debt) relying on the same firm characteristics used to study firm debt concen-tration. Interestingly, though firm-size seems to explain the share short-term bank loans and long term securities, the U-relationship has disappeared. Moreover, also the U-inverse relation-ship with firm age has disappeared. Strikingly, the coefficient on the dummy for listed firms now significantly affects the share of short-term and long-term term bank debt (consequently also driving the behaviour of short-term and long-term debt in general), whereas the coefficient of the R&D dummy is not anymore significant. Being part of group, now seems to affect the share of bank loans, while M&As deals decrease the share of short-term bank loans and increase the share of long-term bank loans.
The country dummies are still significant indicating that – in line with what we observed in figure (2) – in Spain, Italy and Hungary the share of short-term bank loan is significant larger (5%, 9% and 13%) than in Germany (the base category), though in Spain the share of securities (both short and long-term) is larger (about 1.5%). This result is important as we are including a dummy for financially constrained firms, which positively affects the share of short-term bank loans and negatively the share of long-term bank loans.
To summarize, these results combined with those on debt concentration suggest that firm size and age affect the composition of firm debt structure but not the single share of debt, which is mainly driven by country characteristics. In particular, small and large firms have a more con-centrated debt structure. Somehow counterintuively – being listed in the stock market seems also to affect the share of bank loans. These results hold controlling for a number of other firm characteristics and unobservable sector characteristics. Germans and Spanish firms have the most diversified structure, though Spanish firms seem to rely more on rhos-term type of debt.
3.1
Robustness checks: model specification
specified as the squared of predict values never turned out to be significant.
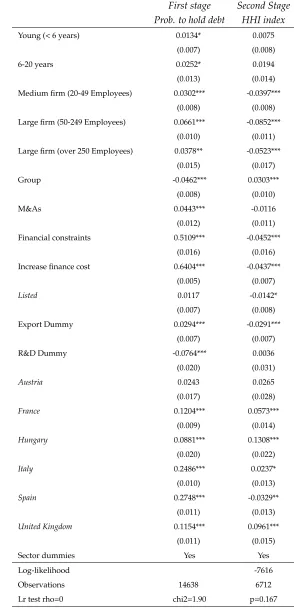
We then check whether there are problems of firm selection into debt. In fact, the HHI index can computed only for those firms who hold a positive amount of debt. As such, the drawback is that we are studying the selected group of firms in our sample who hold a positive amount of debt. If firms made this decision randomly, we could ignore that not all HHI indexes are observed. Such an assumption of random selection, however, is unlikely to be true. We try to account for this, by estimating an Heckman selection model, which allow to control for firms
selection into debt.3 Results are reported in Table (5). Identification relies on functional form as
we do not have any exclusionary restriction to rely on. First of all, it is important to notice that almost all the previous results are robust (compare the second stage of Table (5) with column
f of Table (3)). The only exception is the coefficient on the R&D dummy which is now not
statistically significant. As such, we can be confident that our previous results are robust to firm selection into debt. Secondly, it is important to notice that firm size has a positive (and thus opposite) effect on firm decision to hold debts (see the first stage of Table (5)). This result is consistent with previous studies (see, for example, Faulkender and Petersen (2006); JS Ramalho and da Silva (2009)), which suggest that the presence of (fixed) transaction costs in the issuance of debt may induce smaller firms to rely less on external finance but – conditional on having debt – they tend to have more debt (in our case, they are less diversified). Finally, the test for
independence between the two equations (see the test for ρ = 0 at the bottom of Table (5))
suggests that there is no correlation.
Motivated by these results, and by the fact that we cannot rely on any exclusionary restric-tion, we then estimate a two-part model for each firm debt share to check the model
specifica-tion for these shares (i.e. a Heckman model with ρ = 0). More precisely, we rely on a binary
choice model to explain the probability of a firm raising debt along with a fractional regression model to explain the relative amount of debt. Similar to the Heckman model, this specification allow us to consider that factors that determine whether a firm issues a debt or not could be
different from those that determine how much debt is issued.4 Results are reported in Table (7).
Even in this case, results are consistent with those achieved in Table (6), which only considered the subsample of firms which have a positive amount of debt. In particular, again firm-size seems only to explain the share short-term bank loans, while the U-inverse relationship with firm age has disappeared. In addition, in line with the first-stage of the Heckman selection model, firm size has an opposite effect on firm decision to hold (bank) debt. The coefficient on the dummy for listed firms is again statistically significant for the share of short-term (positive) and long-term (negative) term bank debt, whereas the coefficient of the R&D dummy is almost never significant.
To summarize, the robustness analyses we have just conducted suggest that the results of Section 3 are robust to model specification and firm selection into debt.
3Another different (though related question) would be then to examine those firms who do not have any
posi-tive amount of debt (i.e. zero-leverage firms, see Strebulaev and Yang (2013)).
3.2
Robustness checks: additional drivers
The use of country fixed-effects in our fractional logit specification cannot explain the entire dif-ferences over country groups. It is thus insightful to examine other country-specific factors that might affect our results. First of all, some countries are usually characterized by relationship lending, i.e. banks have acquired over time an informational privilege on firms, which should make bank loans for some firms more attractive than bond markets. To account for that, we include in column (f) of Table (4) variables measuring (at a firm level) the share and the length of the relationship with the main bank (i.e. well known proxies for relationship lending, see for example (Elsas (2005))). Results not reported (but available upon request) indicate that our previous results did not change, though the length of the relationship turned out to be positive and significant (i.e. stronger bank-firm ties are associated with a less diversified debt structure). However, the economic effect of these variable is very low, being below 0.2%.
Another important difference across countries, which may affect the level of firm debt con-centration, is the level of ownership concentration and the market for corporate control (see, for example, Rajan and Zingales (1995)). Since we have already controlled for M&As in Table (3), we now additionally consider the share of the main shareholder as well as his type (i.e. family owned, public entity, holding firm). Neither of these variables, however, is significant or significantly affect our results (results are not reported).
We additional consider a measure industry’s dependence on external finance. In the ques-tionnaire, firms are directly asked the extent to which the industry they work in relies on exter-nal sources of finance. Even this measure does not affect our results. We fiexter-nally control whether our firms has issued equity to face their financing needs in the period considered. Our results are robust to this final control.
4
Demand vs Supply-side effects.
on the drivers of debt concentration at firm level. In fact, the variable “Financial constraints” is an indicator of the availability of bank loans at firm level (i.e. an indication for the supply of bank loans), whereas Germany is the strongest economy in Europe with the lowest government bond yields (i.e. an indication for the highest demand for corporate bonds). What is left should be the role of the firm demand for various types of debts.
The results from this exercise are reported in Tab (8). From this table is interesting to notice that the difference in margins is negative and marginally (both economically and statistically) significant when we compare firms located in Spain with those located in Germany. That is, the difference in the concentration debt index between financially and non-financially constrained firms is smaller in Spain than in Germany. That means that financially constrained firms in Spain rely on broader sources of funding than financially constrained firms located in Germany, both in comparison with their respective non-financially constrained firms. In all the other countries, this difference is instead positive, meaning that financially constrained firms have a more concentrated debt structure. The overall impact, however, is marginal.
In line with the evidence reported above (see again figure 1), these results point to a different behaviour of Spanish firms and a possible substitution of banks loans by corporate bonds in this country. These results are also consistent with the evidence provided by Giovannini et al. (2015), which report different time pattern for the demand for loans by European firms. In particular, they show that in Spain banks tightened their credit standards at exactly the same time as firms’ demand for loans dropped, while in Italy and France the tightening of credit standards led the drop in demands for loans by two quarters.
5
Debt structure and performance.
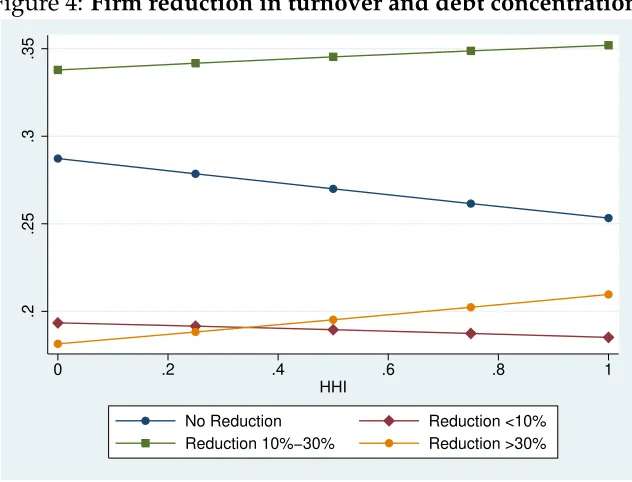
Figure 4:Firm reduction in turnover and debt concentration
.2
.25
.3
.35
0 .2 .4 .6 .8 1
HHI
No Reduction Reduction <10%
Reduction 10%−30% Reduction >30%
The figure reports the predict probabilities based on Table (9) for each class of firm reduction in turnover according to different values of the debt concentration index HHI.
financially constrained firms are also more likely to experience important reduction in turnover (+8%).
Given the cross-sectional nature of our data, however, the actual causality direction is hard to disentangle. In the following, we thus aim to conduct a casual analysis exploiting the entire sample of firms and the cross-country variation in financial integration. We proceed in three steps. First of all, we utilize the values of the dummies for each country and sector in Table (4) to construct an index of country debt specialization which varies across countries and sec-tor (a procedure similar to the one used by Guiso et al. (2004) to develop an index of financial development). According to this index (see Table (10)), we observe the lowest level of debt con-centration in Spain and in Germany. In the second step, we use this indicator of country debt specialization as an explanatory variable in the regressions for firm turnover but this time ex-ploiting the entire sample of firms (i.e. including also those firms without any positive amount of debt). The exogeneity of this indicator can be assumed here since the group of firms who hold debt do not coincide completely with the group of firms that have been used to construct the measure for each country level of debt specialization. However, in this setting (and especially in the third step) the use of country dummies is problematic. We therefore remove countries dum-mies but control for other country-level macro-economic characteristics by including country
gdp per capita in 2007. Results suggest (see columna, b, c, din Table (11)) that firms in country
coun-try debt-specialization. Specifically, we construct an exogenous indicator of councoun-try financial integration in the spirit of Kalemli-Ozcan et al. (2010, 2013). Differently from them, however,
we rely on the most important financial directives only (that is, theprospectus, market-abuse, and
take-over bidsdirectives see Enriques and Gatti (2008)),5and we also need to synthesize the in-formation on financial integration into a single cross-country indicator (whereas they have a time-varying instrument). We thus compute the country indicator of financial integration as the total number of quarters up to (the last quarters of the) year 2007 that each country has had
in place each directive. For example, for Germany that has implemented theprospectus directive
in the third quarter of year 2005, the take-over bids directive in the third quarter of year 2006,
and the market-abuse directive in the last quarter of 2004, the instrument assumes the value of 26=9+5+12. The assumption is that the higher the total number of quarters, the higher the financial integration in the country, and consequently, the higher are the opportunities for firms to diversify their sources of funding. As this index varies at country-level, we need again to re-move country-dummies and include an indicator for country macro-economic conditions (i.e. gpd per capita in 2007). Indeed the first-stage regressions (not reported) suggest that a country level of financial integration is significantly and negatively associated with a country level of debt specialization. That is, the higher the country-financial integration, the lower the coun-try debt specialization. Results for the second-stage are reported in Table (11) in IV-columns. These results are mainly consistent with those emerged in the second step: firms in countries with high level of debt specialization are less likely to experience no reduction in firms turnover (-47%), and are more likely to experience important reduction (+40% for reduction between 10-30%).
6
Discussion and Conclusions.
During the financial crisis of 2007-09, European banks were concerned about their counterpart exposure to the US sub-prime market and began to hoard liquidity. In order to repair their balance sheets and leverage, they thus started to progressively tightening credit conditions. As a consequence, in such period of reduced bank credit availability, European firms also started shifting the composition of their debt from bank loans towards debt securities. The way in which bank loans has been replaced with other sources of funding has differed across countries and was related to factors that vary across Member States, such as the role of small firms in the economy, their access to market financing, the importance of the linkages between banks and firms. Everywhere, however, the development of a financial system that is less resilient on banks and offers a broader range of financing alternatives is seen as desirable.
To shed some lights on the determinants of firm debt structure and on the level of debt specialization, in this paper we take advantage of a cross-country comparable sample of
manu-5We do not consider the transparency directive as there is no variation in the implementation time across
facturing European firms. Our results suggest that firm age and size seem to significantly affect the way each firm combines the different types of debt but not the level of each debt share, while being listed in the stock market seems to only affect the level of the share of bank debt (both short-term and long-term). We also observe that firms located in Spain chose to rely on the most diversified debt structure, though the effect which is driven by firm’s choice is not economically sizeable. Spanish firms also tends to rely more on short-term type of (bank) debt. These results thus suggest there is a process of disintermediation in Spain, as Spanish firms had historically relied on bank lending more than their peers in other countries.
References
Altomonte, C., Aquilante, T., Oct. 2012. The EU-EFIGE/Bruegel-Unicredit dataset. Working Papers 753, Bruegel.
Aoki, K., Nikolov, K., 2012. Financial disintermediation and financial fragility. Tech. rep., Mimeo.
Berger, A., F Udell, G., 1998. The economics of small business finance: The roles of private equity and debt markets in the financial growth cycle. Journal of Banking & Finance 22 (6), 613–673.
Bolton, P., Scharfstein, D. S., 1996. Optimal debt structure and the number of creditors. Journal of Political Economy, 1–25.
Choi, J., Hackbarth, D., Zechner, J., 2013. Granularity of corporate debt. Tech. rep., CFS Working Paper.
Colla, P., Ippolito, F., Li, K., 2013. Debt specialization. The Journal of Finance 68 (5), 2117–2141.
Crouzet, N., 2014. Corporate debt structure and the macroeconomy. In: Annual Meeting of the American Economic Association, Philadelphia. pp. 3–5.
Custódio, C., Ferreira, M. A., Laureano, L., 2013. Why are us firms using more short-term debt? Journal of Financial Economics 108 (1), 182–212.
De Fiore, F., Uhlig, H., 2012. Corporate debt structure and the financial crisis. In: 2012 Meeting Papers. No. 429.
Denis, D. J., Mihov, V. T., 2003. The choice among bank debt, non-bank private debt, and public debt: evidence from new corporate borrowings. Journal of financial Economics 70 (1), 3–28.
Diamond, D. W., 1991. Debt maturity structure and liquidity risk. The Quarterly Journal of Economics, 709–737.
Diamond, D. W., He, Z., 2014. A theory of debt maturity: the long and short of debt overhang. The Journal of Finance 69 (2), 719–762.
Elsas, R., 2005. Empirical determinants of relationship lending. Journal of Financial Intermedi-ation 14 (1), 32–57.
Enriques, L., Gatti, M., 2008. Is there a uniform eu securities law after the financial services action plan. Stan. JL Bus. & Fin. 14, 43.
Faulkender, M., Petersen, M. A., 2006. Does the source of capital affect capital structure? Review of financial studies 19 (1), 45–79.
Giovannini, A., Mayer, C., Micossi, S., di Noia, C., Onado, M., Pagano, M., Polo, A., 2015. Restarting european long-term investment finance. A green paper discussion document, CEPR.
Guiso, L., Sapienza, P., Zingales, L., 2004. Does local financial development matter? The Quar-terly Journal of Economics 119 (3), 929–969.
JS Ramalho, J., da Silva, J. V., 2009. A two-part fractional regression model for the financial leverage decisions of micro, small, medium and large firms. Quantitative Finance 9 (5), 621– 636.
Kalemli-Ozcan, S., Papaioannou, E., Peydró, J.-L., 2010. What lies beneath the euro’s effect on financial integration? currency risk, legal harmonization, or trade? Journal of International Economics 81 (1), 75–88.
Kalemli-Ozcan, S., Papaioannou, E., Peydró, J.-L., 2013. Financial regulation, financial global-ization, and the synchronization of economic activity. The Journal of Finance 68 (3), 1179– 1228.
Kaya, O., Meyer, T., Speyer, B., Hoffmann, R., 2013. Corporate bond issuance in europe. Deutsche Bank EU Monitor 31.
Papke, L. E., Wooldridge, J. M., 1996. Econometric Methods for Fractional Response Variables with an Application to 401(K) Plan Participation Rates. Journal of Applied Econometrics 11 (6), 619–32.
Rajan, R. G., Zingales, L., 1995. What do we know about capital structure? some evidence from international data. The Journal of Finance 50 (5), 1421–1460.
URL❤tt♣✿✴✴❞①✳❞♦✐✳♦r❣✴✶✵✳✶✶✶✶✴❥✳✶✺✹✵✲✻✷✻✶✳✶✾✾✺✳t❜✵✺✶✽✹✳①
Rauh, J. D., Sufi, A., 2010. Capital structure and debt structure. Review of Financial Studies, hhq095.
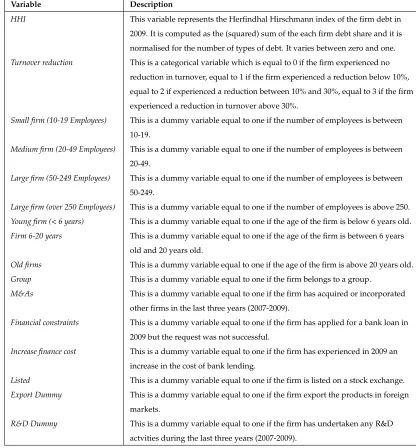
Table 1: VARIABLE DESCRIPTION
Variable Description
HHI This variable represents the Herfindhal Hirschmann index of the firm debt in 2009. It is computed as the (squared) sum of the each firm debt share and it is normalised for the number of types of debt. It varies between zero and one.
Turnover reduction This is a categorical variable which is equal to 0 if the firm experienced no reduction in turnover, equal to 1 if the firm experienced a reduction below 10%, equal to 2 if experienced a reduction between 10% and 30%, equal to 3 if the firm experienced a reduction in turnover above 30%.
Small firm (10-19 Employees) This is a dummy variable equal to one if the number of employees is between 10-19.
Medium firm (20-49 Employees) This is a dummy variable equal to one if the number of employees is between 20-49.
Large firm (50-249 Employees) This is a dummy variable equal to one if the number of employees is between 50-249.
Large firm (over 250 Employees) This is a dummy variable equal to one if the number of employees is above 250.
Young firm (< 6 years) This is a dummy variable equal to one if the age of the firm is below 6 years old.
Firm 6-20 years This is a dummy variable equal to one if the age of the firm is between 6 years old and 20 years old.
Old firms This is a dummy variable equal to one if the age of the firm is above 20 years old.
Group This is a dummy variable equal to one if the firm belongs to a group.
M&As This is a dummy variable equal to one if the firm has acquired or incorporated other firms in the last three years (2007-2009).
Financial constraints This is a dummy variable equal to one if the firm has applied for a bank loan in 2009 but the request was not successful.
Increase finance cost This is a dummy variable equal to one if the firm has experienced in 2009 an increase in the cost of bank lending.
Listed This is a dummy variable equal to one if the firm is listed on a stock exchange.
Export Dummy This is a dummy variable equal to one if the firm export the products in foreign markets.
Table 2: DEBTSTRUCTURE ACROSS EUROPEAN COUNTRIES
Austria France Germany Hungary Italy Spain United Kingdom
Variable Mean Std. Dev. Mean Std. Dev. Mean Std. Dev. Mean Std. Dev. Mean Std. Dev. Mean Std. Dev. Mean Std. Dev.
Short-term bank loans 0.305 0.345 0.209 0.32 0.29 0.332 0.426 0.425 0.399 0.377 0.351 0.334 0.314 0.395
Long-term bank loans 0.53 0.397 0.581 0.4 0.564 0.364 0.402 0.414 0.476 0.383 0.513 0.356 0.334 0.4
Short-term securities 0.003 0.022 0.03 0.127 0.005 0.036 0.015 0.12 0.003 0.042 0.021 0.097 0.035 0.15
Long-term securities 0.022 0.115 0.03 0.13 0.009 0.06 0.005 0.053 0.008 0.07 0.024 0.122 0.051 0.184
Other financial instruments 0.141 0.32 0.15 0.311 0.132 0.28 0.151 0.338 0.114 0.269 0.091 0.236 0.265 0.407
Bank loans (all maturities) 0.834 0.335 0.79 0.344 0.854 0.288 0.829 0.354 0.875 0.28 0.864 0.279 0.649 0.433
Securities (all maturities) 0.025 0.121 0.06 0.187 0.014 0.08 0.02 0.131 0.011 0.085 0.045 0.164 0.086 0.238
Short-term (all debt types) 0.307 0.345 0.239 0.333 0.295 0.331 0.441 0.427 0.402 0.377 0.371 0.338 0.349 0.403
Long-term (all debt types) 0.552 0.391 0.61 0.397 0.572 0.362 0.408 0.414 0.484 0.383 0.538 0.352 0.386 0.414
HHI index 0.729 0.291 0.746 0.288 0.681 0.289 0.811 0.254 0.708 0.282 0.643 0.282 0.777 0.28
All variables measure the share of each debt component in firm balance sheet at the end of year 2009. The (weighted) mean represents thus the share of each debt component in the population of firms.
Table 3: FIRM CHARACTERISTICS ACROSSEUROPEAN COUNTRIES
Austria France Germany Hungary Italy Spain United Kingdom
Variable Mean Std. Dev. Mean Std. Dev. Mean Std. Dev. Mean Std. Dev. Mean Std. Dev. Mean Std. Dev. Mean Std. Dev.
Small firm (10-19 Employees) 0.217 0.414 0.388 0.487 0.239 0.427 0.326 0.47 0.347 0.476 0.355 0.479 0.265 0.442
Medium firm (20-49 Employees) 0.49 0.502 0.38 0.486 0.466 0.499 0.408 0.492 0.512 0.5 0.467 0.499 0.424 0.495
Large firm (50-249 Employees) 0.236 0.426 0.187 0.39 0.251 0.434 0.218 0.414 0.125 0.33 0.158 0.365 0.266 0.442
Large firm (over 250 Employees) 0.058 0.234 0.046 0.209 0.045 0.206 0.048 0.214 0.016 0.126 0.02 0.139 0.044 0.206
Young firm (< 6 years) 0.242 0.43 0.274 0.446 0.349 0.477 0.788 0.409 0.342 0.475 0.436 0.496 0.343 0.475
Firm 6-20 years 0.12 0.326 0.075 0.264 0.07 0.256 0.129 0.335 0.068 0.252 0.066 0.248 0.098 0.298
Old firms (> 20 years) 0.638 0.482 0.65 0.477 0.58 0.494 0.083 0.277 0.589 0.492 0.498 0.5 0.558 0.497
Group 0.2 0.401 0.261 0.439 0.109 0.312 0.169 0.375 0.133 0.34 0.133 0.34 0.24 0.427
M&As 0.166 0.373 0.091 0.287 0.141 0.348 0.052 0.222 0.084 0.277 0.084 0.277 0.152 0.359
Financial constraints 0.042 0.201 0.047 0.212 0.061 0.24 0.051 0.221 0.122 0.328 0.128 0.334 0.011 0.106
Increase finance cost 0.402 0.492 0.31 0.463 0.381 0.486 0.672 0.471 0.455 0.498 0.52 0.5 0.44 0.497
Listed 0.033 0.18 0.013 0.115 0.012 0.11 0.003 0.053 0.004 0.063 0.007 0.084 0.03 0.172
Export Dummy 0.617 0.488 0.509 0.5 0.522 0.5 0.573 0.496 0.683 0.465 0.539 0.499 0.596 0.491
R&D Dummy 0.58 0.495 0.527 0.5 0.542 0.499 0.288 0.454 0.565 0.496 0.467 0.499 0.537 0.499
Turnover Reduction 1.164 1.038 1.434 1.083 1.166 1.071 1.567 1.067 1.509 1.069 1.733 1.044 1.246 1.061
All variables are dummies. The (weighted) mean represents thus the share of firms within each category in the population.
Table 4: DEBT CONCENTRATION OFEUROPEANFIRMS
The dependent variable is the HHI index. Since the HHI index is a fraction and varies between 0 and 1, the estimated model is a fractional regression.
a b c d e f
Young (< 6 years) 0.0124 0.0113 0.0137* 0.0134* 0.0125 0.0113 (0.008) (0.008) (0.008) (0.008) (0.008) (0.008) 6-20 years 0.0347** 0.0317** 0.0365** 0.0367** 0.0350** 0.0276* (0.015) (0.015) (0.015) (0.015) (0.015) (0.015) Medium firm (20-49 Employees) -0.0428*** -0.0439*** -0.0432*** -0.0428*** -0.0384*** -0.0379***
(0.009) (0.009) (0.009) (0.009) (0.009) (0.009) Large firm (50-249 Employees) -0.0782*** -0.0836*** -0.0847*** -0.0850*** -0.0752*** -0.0786***
(0.011) (0.011) (0.011) (0.011) (0.011) (0.012) Large firm (over 250 Employees) -0.0394** -0.0513*** -0.0532*** -0.0512** -0.0392* -0.0463**
(0.018) (0.020) (0.020) (0.020) (0.020) (0.020)
Group 0.0306*** 0.0290*** 0.0289*** 0.0318*** 0.0229**
(0.010) (0.010) (0.010) (0.010) (0.011)
M&As -0.0186 -0.0161 -0.0166 -0.0138 -0.0134
(0.012) (0.012) (0.012) (0.012) (0.012) Financial constraints -0.0546*** -0.0545*** -0.0531*** -0.0372***
(0.013) (0.013) (0.013) (0.013) Increase finance cost -0.0385*** -0.0382*** -0.0375*** -0.0364***
(0.008) (0.008) (0.008) (0.008)
Listed -0.0151 -0.0127 -0.0223
(0.038) (0.038) (0.038)
Export Dummy -0.0146* -0.0169**
(0.008) (0.008)
R&D Dummy -0.0314*** -0.0307***
(0.008) (0.008)
Austria 0.0589*
(0.031)
France 0.0576***
(0.016)
Hungary 0.1269***
(0.022)
Italy 0.0281**
(0.014)
Spain -0.0377***
(0.014)
United Kingdom 0.0963***
(0.016)
Sector dummies Yes Yes Yes Yes Yes Yes
ll -3260 -3257 -3229 -3224 -3218 -3188
N 6764 6762 6724 6712 6712 6712
*p<0.10,** p<0.05, ***p<0.01
Table 5: HECKMAN SELECTION MODEL FORHHI
The model consists of two equations. The first stage consists of a probit model for the probability of holding debt and relies on the entire sample of firms. The second stage consists of a linear regression for the HHI index relying only on the sample of firms holding a positive amount of debt.
First stage Second Stage Prob. to hold debt HHI index
Young (< 6 years) 0.0134* 0.0075
(0.007) (0.008)
6-20 years 0.0252* 0.0194
(0.013) (0.014) Medium firm (20-49 Employees) 0.0302*** -0.0397***
(0.008) (0.008) Large firm (50-249 Employees) 0.0661*** -0.0852***
(0.010) (0.011) Large firm (over 250 Employees) 0.0378** -0.0523***
(0.015) (0.017)
Group -0.0462*** 0.0303***
(0.008) (0.010)
M&As 0.0443*** -0.0116
(0.012) (0.011) Financial constraints 0.5109*** -0.0452***
(0.016) (0.016) Increase finance cost 0.6404*** -0.0437***
(0.005) (0.007)
Listed 0.0117 -0.0142*
(0.007) (0.008)
Export Dummy 0.0294*** -0.0291***
(0.007) (0.007)
R&D Dummy -0.0764*** 0.0036
(0.020) (0.031)
Austria 0.0243 0.0265
(0.017) (0.028)
France 0.1204*** 0.0573*** (0.009) (0.014)
Hungary 0.0881*** 0.1308*** (0.020) (0.022)
Italy 0.2486*** 0.0237*
(0.010) (0.013)
Spain 0.2748*** -0.0329**
(0.011) (0.013)
United Kingdom 0.1154*** 0.0961*** (0.011) (0.015)
Sector dummies Yes Yes
Log-likelihood -7616
Observations 14638 6712
Lr test rho=0 chi2=1.90 p=0.167
Table 6: DETERMINANTS OF EACH DEBT COMPONENT(SHARES)
The dependent variables are each debt component. Bank loans is the combined share of short-term and long-term bank loans, Securities is the combined share of short-term and long-term secutiries,
Short-term is the combined share of all types of short-term debts, and Long-term is the combined share of all types of long-term debts. The estimated model is a fractional regression.
Short-term Long-term Short-term Long-term Other finan. Bank loans Securities Short-term Long-term
bank loans bank loans securities securities instruments
Young (< 6 years) -0.0123 0.0055 -0.0036* -0.0003 0.0116 -0.0075 -0.0040 -0.0160 0.0052
(0.011) (0.011) (0.002) (0.003) (0.008) (0.009) (0.004) (0.011) (0.011)
6-20 years -0.0376** 0.0177 0.0034 -0.0082** 0.0250 -0.0205 -0.0047 -0.0340* 0.0092
(0.019) (0.021) (0.006) (0.004) (0.016) (0.017) (0.007) (0.019) (0.021)
Medium firm (20-49 Employees) -0.0075 0.0229* -0.0065** -0.0027 -0.0058 0.0150 -0.0090** -0.0139 0.0201
(0.012) (0.012) (0.003) (0.003) (0.009) (0.010) (0.004) (0.012) (0.012)
Large firm (50-249 Employees) 0.0173 0.0025 -0.0055* -0.0006 -0.0118 0.0183 -0.0062 0.0116 0.0019
(0.015) (0.015) (0.003) (0.005) (0.011) (0.012) (0.006) (0.015) (0.015)
Large firm (over 250 Employees) 0.0207 -0.0019 -0.0080 0.0027 -0.0086 0.0146 -0.0056 0.0116 0.0017
(0.024) (0.026) (0.005) (0.007) (0.018) (0.020) (0.009) (0.024) (0.026)
Group 0.0212 -0.0658*** -0.0027 0.0001 0.0457*** -0.0425*** -0.0028 0.0181 -0.0656***
(0.014) (0.014) (0.003) (0.004) (0.012) (0.013) (0.005) (0.014) (0.014)
M&As -0.0319** 0.0437*** 0.0014 -0.0006 -0.0117 0.0114 0.0006 -0.0305** 0.0429***
(0.015) (0.016) (0.004) (0.005) (0.011) (0.012) (0.006) (0.015) (0.016)
Financial constraints 0.0582*** -0.0407** 0.0023 -0.0056 -0.0210 0.0231* -0.0032 0.0608*** -0.0446***
(0.017) (0.017) (0.005) (0.004) (0.013) (0.014) (0.006) (0.017) (0.017)
Increase finance cost 0.0178* 0.0218** -0.0029 -0.0021 -0.0337*** 0.0389*** -0.0051 0.0147 0.0196*
(0.010) (0.010) (0.002) (0.003) (0.008) (0.008) (0.003) (0.010) (0.010)
Listed 0.0544*** -0.0367*** 0.0007 -0.0027 -0.0164* 0.0185** -0.0020 0.0550*** -0.0396***
(0.011) (0.011) (0.002) (0.003) (0.008) (0.009) (0.004) (0.011) (0.011)
Export Dummy 0.0011 -0.0057 0.0040* -0.0021 0.0039 -0.0059 0.0019 0.0049 -0.0078
(0.010) (0.011) (0.002) (0.003) (0.008) (0.009) (0.004) (0.011) (0.011)
R&D Dummy -0.0523 -0.0287 0.0062 -0.0005 0.0519 -0.0597 0.0053 -0.0446 -0.0284
(0.040) (0.049) (0.011) (0.010) (0.034) (0.038) (0.016) (0.041) (0.048)
Austria 0.0074 -0.0070 -0.0029 0.0146 -0.0109 -0.0011 0.0119 0.0045 0.0080
(0.040) (0.047) (0.002) (0.011) (0.044) (0.044) (0.012) (0.040) (0.047)
France -0.0866*** 0.0325 0.0247*** 0.0184*** 0.0082 -0.0511*** 0.0425*** -0.0613*** 0.0521**
(0.019) (0.021) (0.005) (0.005) (0.015) (0.017) (0.008) (0.019) (0.021)
Hungary 0.1293*** -0.1588*** 0.0135 -0.0033 0.0218 -0.0313 0.0083 0.1422*** -0.1617***
(0.033) (0.033) (0.011) (0.004) (0.027) (0.028) (0.011) (0.033) (0.033)
Italy 0.0914*** -0.0699*** -0.0021 -0.0001 -0.0184 0.0209 -0.0025 0.0886*** -0.0694***
(0.017) (0.018) (0.002) (0.003) (0.013) (0.014) (0.004) (0.017) (0.018)
Spain 0.0500*** -0.0423** 0.0162*** 0.0153*** -0.0390*** 0.0073 0.0313*** 0.0657*** -0.0268
(0.016) (0.017) (0.003) (0.004) (0.013) (0.014) (0.006) (0.016) (0.017)
United Kingdom 0.0151 -0.2123*** 0.0301*** 0.0435*** 0.1202*** -0.1940*** 0.0736*** 0.0451** -0.1683***
(0.020) (0.021) (0.006) (0.008) (0.019) (0.020) (0.010) (0.020) (0.021)
Sector dummies Yes Yes Yes Yes Yes Yes Yes Yes Yes
ll -3620 -3897 -412 -543 -2331 -2628 -825 -3675 -3900
N 6712 6712 6712 6712 6712 6712 6712 6712 6712
*p<0.10,** p<0.05, ***p<0.01
Table 7: DETERMINANTS OF EACH DEBT COMPONENT: TWO PART MODEL
The estimated model consists of two parts: (1) estimates the probability of holding debt relying on the entire sample of firm. The second part (2) estimate a fractional logit relying only on firm holding a
positive amount of debt. *p<0.10,** p<0.05, ***p<0.01
short bank (1) short bank (2) long bank (1) long bank (2) short secur (1) short secur (2) long_secur (1) long secur (2) others (1) others (2)
Young (< 6 years) 0.005 -0.004 0.009 0.012 -0.006** 0.004 -0.002 0.035 0.003 0.062***
(0.007) (0.011) (0.007) (0.010) (0.003) (0.031) (0.003) (0.040) (0.006) (0.019)
6-20 years -0.007 -0.010 0.023 0.018 -0.005 0.179** -0.007 0.039 0.013 0.048
(0.013) (0.022) (0.014) (0.020) (0.005) (0.083) (0.005) (0.076) (0.011) (0.033)
Medium firm (20-49 Employees) 0.039*** -0.039*** 0.047*** -0.017 -0.003 -0.063* -0.001 0.007 0.007 -0.037*
(0.008) (0.013) (0.008) (0.012) (0.003) (0.033) (0.003) (0.043) (0.006) (0.021)
Large firm (50-249 Employees) 0.098*** -0.048*** 0.086*** -0.054*** 0.001 -0.079* 0.007 -0.037 0.022*** -0.077***
(0.010) (0.016) (0.010) (0.014) (0.004) (0.041) (0.004) (0.052) (0.008) (0.027)
Large firm (over 250 Employees) 0.068*** -0.032 0.044*** -0.019 -0.010* 0.042 0.011 0.007 0.005 -0.046
(0.016) (0.026) (0.017) (0.024) (0.006) (0.103) (0.008) (0.082) (0.012) (0.052)
Group -0.035*** 0.025* -0.079*** -0.021 -0.008** 0.021 -0.008** 0.047 0.002 0.098***
(0.009) (0.015) (0.009) (0.014) (0.003) (0.046) (0.003) (0.057) (0.007) (0.025)
M&As 0.025** -0.046*** 0.053*** 0.021 0.003 -0.014 0.004 -0.021 0.017* -0.022
(0.012) (0.017) (0.012) (0.015) (0.005) (0.053) (0.004) (0.062) (0.009) (0.027)
Financial constraints 0.197*** 0.014 0.211*** -0.067*** 0.006 0.065 -0.000 -0.079 0.012 -0.068**
(0.026) (0.016) (0.030) (0.017) (0.006) (0.072) (0.006) (0.067) (0.012) (0.031)
Increase finance cost 0.405*** -0.022** 0.472*** -0.012 0.031*** -0.056* 0.032*** -0.050 0.130*** -0.102***
(0.010) (0.011) (0.010) (0.010) (0.004) (0.029) (0.004) (0.036) (0.009) (0.018)
Listed 0.036*** 0.031*** 0.010 -0.048*** 0.001 -0.002 -0.002 -0.019 -0.005 -0.030
(0.007) (0.012) (0.007) (0.011) (0.003) (0.031) (0.003) (0.041) (0.006) (0.019)
Export Dummy 0.034*** -0.022* 0.031*** -0.023** 0.004 0.066** 0.003 -0.044 0.011** -0.003
(0.007) (0.011) (0.007) (0.010) (0.003) (0.031) (0.003) (0.042) (0.005) (0.019)
R&D Dummy -0.074*** -0.041 -0.052** -0.080 0.011 -0.106 -0.001 -0.058 -0.002 -0.023
(0.021) (0.051) (0.025) (0.050) (0.012) (0.099) (0.009) (0.105) (0.017) (0.067)
Austria 0.021 0.056 0.032* 0.048 -0.001 -0.060 0.013* 0.135 -0.014 0.131
(0.019) (0.047) (0.019) (0.032) (0.004) (0.099) (0.007) (0.124) (0.012) (0.104)
France 0.029*** -0.006 0.127*** 0.026 0.034*** 0.111** 0.023*** 0.082 0.036*** 0.085**
(0.010) (0.024) (0.011) (0.019) (0.004) (0.044) (0.004) (0.061) (0.008) (0.034)
Hungary 0.082*** 0.222*** -0.006 0.000 0.000 0.799*** -0.002 0.171 0.026* 0.151**
(0.019) (0.036) (0.018) (0.033) (0.004) (0.036) (0.004) (0.157) (0.014) (0.062)
Italy 0.178*** 0.145*** 0.205*** -0.054*** 0.000 0.121** 0.008*** 0.078 0.052*** 0.014
(0.011) (0.019) (0.011) (0.016) (0.002) (0.061) (0.003) (0.066) (0.008) (0.029)
Spain 0.231*** 0.036* 0.240*** -0.053*** 0.033*** 0.072* 0.028*** 0.095* 0.054*** -0.105***
(0.012) (0.019) (0.012) (0.015) (0.004) (0.044) (0.004) (0.057) (0.008) (0.031)
United Kingdom 0.058*** 0.112*** 0.005 -0.055** 0.036*** 0.155*** 0.040*** 0.177*** 0.069*** 0.243***
(0.011) (0.024) (0.011) (0.022) (0.005) (0.055) (0.005) (0.059) (0.009) (0.031)
Sector dummies Yes Yes Yes Yes Yes Yes Yes Yes Yes Yes
ll -7039 -2324 -7383 -2668 -1534 -163 -1594 -188 -4732 -825
N 14638 4317 14638 5151 14617 362 14617 367 14638 1589
Table 8: CONTRAST MARGINS OF FINANCIALLY CONSTRAINED FIRMS ACROSS COUNTRIES
In this table we contrast the margins Table (4) for financially constrained firms (i.e. firms that asked bank credit but were not successfull) with those of non-financially constrained firms (i.e. firms that
either did not ask for more credit or successfully got more credit) with respect to the same difference for firms located in Germany.
Difference Std Errors P-value
Austria vs Germany .0039 .0027 0.151
France vs Germany .0049** .0019 0.011
Hungary vs Germany .0112*** .0043 0.009
Italy vs Germany .0021* .0011 0.054
Spain vs Germany -.0015* .0008 0.073
United Kingdom vs Germany .0076*** .0027 0.006
Table 9: DETERMINANTS OF TURNOVER REDUCTION
The estimated model is an ordinal logit using firms with a positive amount of debt. The dependent variable is equal to 0 if the firm experienced no reduction in the turnover, equal to 1 if the firm
experienced a reduction below 10%, equal to 2 if experienced a reduction between 10% and 30%, equal to 3 if the firm experienced a reduction in turnover above 30%.
No reduction Reduction<10% Reduction10%−30% Reduction>30%
HHI -0.0354*** -0.0092** 0.0142** 0.0304***
(0.014) (0.004) (0.006) (0.012)
Young (< 6 years) 0.0141* 0.0037* -0.0055* -0.0123*
(0.008) (0.002) (0.003) (0.007)
6-20 years 0.0671*** 0.0141*** -0.0298*** -0.0514***
(0.017) (0.003) (0.008) (0.012)
Medium firm (20-49 Employees) -0.0210** -0.0051** 0.0088** 0.0173**
(0.009) (0.002) (0.004) (0.007)
Large firm (50-249 Employees) -0.0429*** -0.0114*** 0.0168*** 0.0375***
(0.012) (0.003) (0.005) (0.011)
Large firm (over 250 Employees) -0.0379 -0.0099 0.0151* 0.0327
(0.024) (0.007) (0.009) (0.023)
Group -0.0167 -0.0045 0.0064 0.0148
(0.011) (0.003) (0.004) (0.010)
M&As 0.0415*** 0.0093*** -0.0181*** -0.0328***
(0.014) (0.003) (0.007) (0.010)
Financial constraints -0.0840*** -0.0292*** 0.0251*** 0.0881***
(0.011) (0.005) (0.002) (0.014)
Increase finance cost 0.0617 0.0121* -0.0281 -0.0457
(0.045) (0.006) (0.022) (0.029)
Listed -0.0736*** -0.0202*** 0.0296*** 0.0643***
(0.008) (0.002) (0.003) (0.007)
Export Dummy -0.0064 -0.0017 0.0026 0.0055
(0.008) (0.002) (0.003) (0.007)
R&D Dummy 0.0332*** 0.0087*** -0.0132*** -0.0287***
(0.008) (0.002) (0.003) (0.007)
Austria 0.0640 0.0115** -0.0315 -0.0440*
(0.043) (0.006) (0.022) (0.026)
France 0.0439** 0.0087** -0.0210** -0.0316**
(0.017) (0.003) (0.008) (0.012)
Hungary -0.0279 -0.0077 0.0114 0.0242
(0.025) (0.007) (0.010) (0.022)
Italy -0.0094 -0.0024 0.0041 0.0078
(0.013) (0.003) (0.006) (0.011)
Spain -0.0808*** -0.0277*** 0.0263*** 0.0821***
(0.013) (0.004) (0.005) (0.013)
United Kingdom 0.0784*** 0.0129*** -0.0392*** -0.0522***
(0.018) (0.003) (0.009) (0.012)
Sector dummies Yes Yes Yes Yes
ll -8462 -8462 -8462 -8462
N 6703 6703 6703 6703
*p<0.10,** p<0.05, ***p<0.01
Table 10: INDICATOR OF COUNTRY DEBT CONCENTRATION
Country Mean Min Max
Austria 0.738 0.710 0.771
France 0.760 0.724 0.855
Germany 0.679 0.648 0.717
Hungary 0.814 0.793 0.840
Italy 0.720 0.681 0.827
Spain 0.647 0.615 0.687
United Kingdom 0.786 0.753 0.872
Table 11: DETERMINANTS OF TURNOVER REDUCTION
The estimated model is an ordinal logit on the entire sample of firms. The dependent variable is equal to 0 if the firm experienced no reduction in the turnover, equal to 1 if the firm experienced a
reduction below 10%, equal to 2 if experienced a reduction between 10% and 30%, equal to 3 if the firm experienced a reduction in turnover above 30%. The country indicator of debt specialization is
computed as specified in Table (). The IV regressions instrument the country indicator of debt specialization with the financial integration indicator as explained in Section 5.
No reduction (a) No reduction -IV Reduction (b) Reduction -IV Reduction (c) Reduction-IV Reduction Reduction -IV <10% <10% 10%−30% 10%−30% >30% >30%
Country debt specialization -0.5628*** -0.4730** -0.1070*** 0.1949 0.2611*** 0.4423* 0.4086*** -0.1642
(0.109) (0.223) (0.021) (0.202) (0.051) (0.234) (0.079) (0.184)
Gdp per capita 2007 0.0207*** 0.0209*** 0.0039*** -0.0000 -0.0096*** -0.0120*** -0.0150*** -0.0089***
(0.001) (0.002) (0.000) (0.002) (0.001) (0.003) (0.001) (0.002)
Young (< 6 years) 0.0178*** 0.0253*** 0.0034*** 0.0096 -0.0083*** -0.0394*** -0.0130*** 0.0046
(0.006) (0.008) (0.001) (0.007) (0.003) (0.008) (0.005) (0.007)
6-20 years 0.0573*** 0.0937*** 0.0088*** -0.0327** -0.0280*** -0.0640*** -0.0382*** 0.0031
(0.013) (0.015) (0.001) (0.013) (0.007) (0.016) (0.008) (0.012)
Medium firm (20-49 Employees) -0.0032 0.0045 -0.0006 -0.0095 0.0015 0.0005 0.0023 0.0045
(0.007) (0.008) (0.001) (0.008) (0.003) (0.009) (0.005) (0.007)
Large firm (50-249 Employees) -0.0245*** -0.0299** -0.0050*** 0.0061 0.0111*** 0.0143 0.0184*** 0.0095
(0.009) (0.012) (0.002) (0.011) (0.004) (0.013) (0.007) (0.010)
Large firm (over 250 Employees) 0.0141 0.0135 0.0023 0.0157 -0.0068 -0.0126 -0.0096 -0.0166
(0.018) (0.023) (0.003) (0.020) (0.009) (0.024) (0.012) (0.019)
Group -0.0253*** -0.0392*** -0.0052*** 0.0037 0.0114*** 0.0236** 0.0191*** 0.0119
(0.008) (0.011) (0.002) (0.010) (0.004) (0.011) (0.006) (0.009)
M&As 0.0267** 0.0242* 0.0045*** 0.0002 -0.0128** 0.0023 -0.0184*** -0.0266**
(0.011) (0.013) (0.002) (0.012) (0.005) (0.014) (0.007) (0.011)
Financial constraints -0.0815*** -0.0713*** -0.0225*** -0.0031 0.0317*** -0.0325 0.0723*** 0.1069***
(0.013) (0.019) (0.005) (0.017) (0.004) (0.020) (0.014) (0.016)
Increase finance cost -0.0133 -0.0093 -0.0027 -0.0277 0.0060 0.0319 0.0100 0.0052
(0.023) (0.030) (0.005) (0.027) (0.010) (0.031) (0.018) (0.025)
Listed -0.0700*** -0.0673*** -0.0169*** -0.0226** 0.0304*** 0.0254** 0.0564*** 0.0644***
(0.007) (0.010) (0.002) (0.009) (0.003) (0.010) (0.006) (0.008)
Export Dummy -0.0287*** -0.0352*** -0.0053*** -0.0104 0.0135*** 0.0360*** 0.0206*** 0.0096
(0.006) (0.008) (0.001) (0.007) (0.003) (0.009) (0.005) (0.007)
R&D Dummy 0.0238*** 0.0283*** 0.0046*** -0.0057 -0.0110*** -0.0036 -0.0173*** -0.0190***
(0.006) (0.008) (0.001) (0.007) (0.003) (0.008) (0.005) (0.007)
Sector dummies Yes Yes Yes Yes Yes Yes Yes Yes
ll -17941 -17941 -17941 -17941
N 14141 14141 14141 14141 14141 14141 14141 14141