Crack Growth Characteristic and Damage Evaluation under Creep-Fatigue
Interactive Condition for W-Added High-Cr Steel
+1Takashi Matsuzaki, Ryuji Sugiura
+2, Yoshiko Nagumo
+3and A. Toshimitsu Yokobori, Jr.
Graduate School of Engineering, Tohoku University, Sendai 980-8579, Japan
Crack growth characteristic under the conditions of high temperature creep and fatigue interaction is dominated by both of cyclic dependent mechanism due to fatigue and time dependent mechanism due to the time of load application (creep). For many cases with decrease in load frequency, this characteristic changes from the cyclic dependent mechanism to the time dependent mechanism through an unstable transition region induced by creep and fatigue competitive mechanisms. To understand the physical mechanism of the interactive effects of creep and fatigue, it is important to clarify the damage mechanisms around the crack. In the present study, the experiments of creep-fatigue crack growth tests and the quantitative analysis of damage by measuring Vickers hardness were conducted to understand the interactive effects of creep and fatigue on the crack growth characteristic. Additionally, by observing the material microstructure using EBSD, damage mechanisms were clarified. As a result, it was found that the creep effect contributes the expansion of damage region and the fatigue effect increases the density of damage within a given region. Interaction of these effects resulted in the occurrence of unstable transition region on the characteristic of creep-fatigue life. [doi:10.2320/matertrans.M2013340]
(Received September 5, 2013; Accepted September 27, 2013; Published November 25, 2013)
Keywords: creep-fatigue crack, creep-fatigue damage, high-chromium steel, Vickers hardness, electron backscatter diffraction
1. Introduction
High-Cr ferritic heat resistant steels were developed for the use in components of high temperature instruments such as coal-fired fuel power plant. Now they have been widely used for the new generation power plants which are considering the reduction of environmental burden. The high-Cr steel has been reported to have excellent characteristics of creep strength and ductility due to the tempered martensitic lath structure. However, its degradation and damage formation behaviors under creep and creep-fatigue interactive condi-tions are not clarified quantitatively enough yet due to the complexity of material microstructure.
To solve these issues, methodological studies on damage evaluation under creep and creep-fatigue interactive con-ditions using EBSD method and measuring the Vickers hardness have been conducted. Some studies indicated that the dislocation density which is induced by martensitic lath structure decreases as the damage progresses.15) Addition-ally, it is shown that the martensitic lath microstructure is thermally-stable and does not change under no applied load for Mod. 9%Cr steel.4)That is, the martensitic lath structure will change, depending on stress distribution resulting from the notched specimen with applied creep or creep-fatigue loadings. Moreover, it is reported that the crack initiation and growth behaviors of high-Cr steel are sensitive to the material microstructure,6) which lead to the scattering of crack initiation and growth lives.
Furthermore, the characteristics of creep crack growth life of CrMoV steel, 304 stainless steel and nickel-base superalloy under the creep-fatigue interactive conditions have been clarified by one of the present authors.7)Yokobori et al. reported that crack growth characteristic under the
conditions of high temperature creep and fatigue interaction is dominated by cyclic dependent mechanism due to fatigue and time dependent mechanism due to the time of load application (creep) and changes from the cyclic dependent to the time dependent mechanisms through an unstable transition region induced by creep and fatigue competitive mechanisms.7) Additionally, to establish the law of fracture life under the creep-fatigue interactive conditions, the theoretical method considering the interactive effects of creep and fatigue have been proposed. However, its physical mechanism has not been clarified yet.
In the present study, the experiments of creep-fatigue crack growth tests and the quantitative analysis of damage by measuring Vickers hardness were conducted to understand the interactive effects of creep and fatigue on the crack growth characteristic. Additionally, by observing the material microstructure using EBSD, damage mechanisms were clarified.
2. Materials
[image:1.595.305.547.744.785.2]The materials used are W-added 9%Cr steel and W-added 12% Cr steel. The chemical compositions of these materials are shown in Table 1. W-added 9% Cr steel is mainly used for the boiler component and W-added 12%Cr steel is used for the bolt, turbine blade and turbine rotor, which are expected to use under the temperatures of 593 and 650°C, respectively.8)IPF (Inverse polefigure) maps and polefigure maps of as-received W-added 912% Cr steels obtained by the EBSD observation are shown in Figs. 1 and 2, respectively. From the IPF maps shown in Fig. 1, the grain
Table 1 Chemical compositions of W-added 9%Cr and 12%Cr steels in mass%.
C Cr Mo W Nb V Co
W-added 9%Cr steel 0.101 8.96 0.48 1.97 0.065 0.201 ® W-added 12%Cr steel 0.09 10.89 0.17 2.61 0.06 0.2 2.52
+1This Paper was Originally Published in Japanese in J. Japan Inst. Metals 76(2012) 624633.
+2Corresponding author, E-mail: sugiura@md.mech.tohoku.ac.jp +3Graduate Student, Tohoku University
sizes of W-added 9%Cr steel and W-added 12%Cr steel are approximately 30 and 200 µm, respectively. The polefigure maps for the martensite phase shown in Figs. 2(a) and 2(b) represent the Kurdjumov-Sachs (K-S) orientation relationship which indicates that the W-added 912% Cr steels have martensitic lath microstructure.
3. Experimental Procedure
Crack growth tests under the creep-fatigue interactive conditions using C(T) specimens shown in Fig. 3 were performed on the basis of ASTM E1457-07 and E2760-10.9,10,11) The testing machine used was a lever arm high temperature creep-fatigue testing machine (Type RT-30) manufactured by TOSHIN KOGYO. The crack length and load line displacement were monitored during the tests. The crack length from the notch tip was measured by an electrical potential method using the Johnson-Schwalbes’ equation as shown in eq. (1).12,13)
a¼2³Wcos1 coshð³y0=2WÞ
cosh U
U0
cosh1coshð³y0=2WÞ
cosð³a0=2WÞ
8 > > > < > > > : 9 > > > = > > > ;
ð1Þ
whereais the length of the crack (mm),a0is the initial crack length (mm), y is the half distance between the output terminals (mm),U0is the initial voltage (µV),Uis the actual voltage of the specimen (µV) and W is the thickness of specimen (mm). The test temperatures were kept at a specified temperature with the precision of«2°C. The testing
conditions are shown in Table 2 and the stress waveform used in this experiment is shown in Fig. 4. Where,T is the testing temperature (°C), Kin is the initial stress intensity factor (MPam1/2), tR is the stress raising time (s), tD is the stress decline time (s),tHis the stress holding time (s),tfis the crack growth life (h). As shown in Fig. 4, the crack growth tests under the creep-fatigue interactive conditions were conducted by changing the stress holding timetHaccording to the ASTM standard.10)
(a) (b)
Fig. 1 IPF (Inverse polefigure) maps of W-added 9%Cr and 12%Cr steels; (a) W-added 9%Cr steel, (b) W-added 12%Cr steel.
(a) (b)
[image:2.595.118.480.71.219.2]Fig. 2 Polefigure maps of W-added 9%Cr and 12%Cr steels; (a) W-added 9%Cr steel, (b) W-added 12%Cr steel.
Table 2 Crack growth tests condition.
T [°C]
Kin
[MPam1/2] tR/tD
[s] tH [s] tf [h] W-added 9%Cr Steel
600 35 35 0 105 60 189.9 600 484.3 2500 753 9940 861 460 50000 1116 Creep 850.5 615 35 0 91 60 139 600 247 2500 339.5 9940 245 Creep 417 630 35 0 60 60 68 600 90 9940 66 50000 211 Creep 215 W-added
12%Cr Steel 650 35
35
0 92.5
60 110 600 113
[image:2.595.57.285.263.382.2] [image:2.595.48.289.662.714.2]The hardness measurement was conducted by micro-Vickers hardness tester (SHIMADZU HMV-1). The loading force and the loading time were 98 mN and 5 s, respectively. The orientation imaging microscopy (OIM) from TSL Inc. was used for fully-automated EBSD analysis to observe the crystallized microstructure such as the grain orientation distribution. The EBSD observations were conducted on a HITACHI S-4300 FE-SEM. Samples were polished to a mirror surface with 0.05 µm colloidal silica solution to remove the worked layer before EBSD observation.
4. Experimental Results
4.1 Characteristics of deformation and crack growth under creep-fatigue interactive conditions
The characteristics of load line displacement and crack growth of W-added 912% Cr steel at temperatures of 600 and 650°C, respectively, are shown in Figs. 58. The horizontal axis represents the normalized time t/tf, where t is the load application time andtfis the fracture life for each specimen.
For the characteristic of load line displacement of W-added 9% Cr steel as shown in Fig. 5, the value of load line displacement increases with increase in stress holding timetH ranging from 0 to 9940 s and takes a maximum value under the condition of tH=9940 s. When tHis larger than 9940 s, the value of load line displacement decreases and it saturates to that under creep condition. For the characteristic of crack growth of W-added 9%Cr steel as shown in Fig. 6, the value of crack growth length decreases with increase in stress holding timetHand it saturates to that under creep condition. Same tendency has been found for the characteristics of load line displacement and crack growth under the other testing temperature.
On the other hand, for the characteristic of load line displacement of W-added 12% Cr steel as shown in Fig. 7, the values of load line displacement under the creep-fatigue interactive conditions are much less than those of W-added 9% Cr steel, that is, creep deformation characteristic of W-added 12% Cr steel shows brittle manner as compared with that of W-added 9%Cr steel. The characteristic of load line displacement for W-added 12% Cr steel increases with the
Fig. 4 Stress wave form based on ASTM Standard E2760-10.
Fig. 3 Geometry and size of a C(T) specimen. (Unit: mm)
Fig. 5 Characteristic of load line displacement for W-added 9%Cr steel.
[image:3.595.48.299.68.369.2] [image:3.595.54.536.70.402.2] [image:3.595.306.547.258.437.2] [image:3.595.303.520.477.655.2]stress holding time increases and shows the maximum value attH=60 s. WhentHis larger than 60 s, the value of load line displacement decreases and saturates to that under creep condition. Additionally, the characteristics of crack growth length decrease with increase in stress holding timetHand it saturates to that under creep condition as shown in Fig. 8.
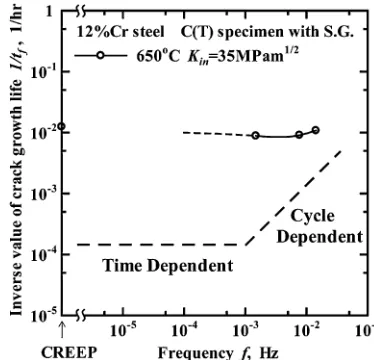
4.2 Characteristic of load frequency of crack growth life The characteristics of load frequency f of crack growth lifetffor W-added 912%Cr steel are shown in Figs. 914,15) and 10. Where, thex-axis represents the frequency calculated by eq. (2) with variation in the stress holding timetH.
f¼t 1
RþtDþtH ð2Þ
As the experimental relationship between load frequencyf and crack growth lifetfshown in Figs. 9 and 10, the method for separate estimation of the cycle-dependent mechanism from the time-dependent mechanism is proposed for the characteristics of load frequency of crack growth life.7)When the crack growth lifetf is dominated by the cycle-dependent mechanism, the relationship between log 1/tf and f is linear with a gradient of 45 deg. On the other hand, when the crack
growth life tf is dominated by the time-dependent mechan-ism, the relationship between log 1/tf and f is linear and parallel to the logf axis, i.e., there is a horizontal linear relationship between them. Therefore, from the experimental relationship between 1/tf and f, the discrimination whether the crack growth lifetfis dominated by the cycle-dependent, time-dependent, or a competitive mechanism can be conducted.7)
In Fig. 9, the experimental results of W-added 9%Cr steel showed that the inverse value of crack growth life 1/tf decreases approximately parallel to the life for the cycle-dependent mechanism with decrease in franging from 10¹2 to 10¹3Hz. In the range of 10¹3 to 10¹5Hz, the character-istics of load frequency of crack growth life tf showed an unstable equilibrium transition characteristic with an inflex-ion point. Furthermore, with increase in temperature, in the high load frequency range off>10¹3Hz, the gradient of the linear relationship between 1/tf andfbecomes small, which result in the appearance of time-dependent mechanism. From Fig. 10 the characteristic of load frequency of crack growth life tf of W-added 12% Cr steel showed the time-dependent mechanism under all load frequencyf.
Fig. 7 Characteristic of load line displacement for W-added 12%Cr steel.
Fig. 8 Characteristic of crack growth for W-added 12%Cr steel.
[image:4.595.50.291.66.247.2]Fig. 9 Characteristic of crack growth life under creep-fatigue condition for W-added 9%Cr steel.
[image:4.595.329.518.70.251.2] [image:4.595.330.517.294.474.2] [image:4.595.50.272.295.473.2]From these results mentioned above, the characteristic of load frequency of crack growth life showed multiple effects of time-dependent and cycle-dependent mechanisms as an unstable transition region. Additionally, this characteristic was found to be affected by testing temperature and the differences of materials. Yokobori et al. has been proposed the theoretical method considering the interactive effects of cycle-dependent and time-dependent mechanisms in order to establish the law of fracture life under the creep-fatigue interactive conditions.7) However, its physical mechanism has not been clarified yet.
To understand the physical mechanism of the interactive effects of creep and fatigue, it is important to clarify the damage mechanisms around the crack. In the next section, the quantitative analysis of damage by measuring Vickers hardness were conducted to understand the interactive effects of creep and fatigue on the crack growth characteristic. 4.3 Micro-Vickers hardness measurement along the
crack growth path
By using micro-Vickers hardness test of HMV-1 manufac-tured by SHIMADZU, the micro-Vickers hardness was measured in the crack growth direction, which is r direction in Fig. 11, until 80%of thefinal crack length that is equal to the accelerating point of crack growth at regular intervals of 0.2 mm. And the measurement was also conducted in the depth direction, which is d direction in Fig. 11, for 4 mm at regular intervals of 0.2 mm. The micro-Vickers hardness H was normalized by Hc, which is the value of hardness measured far from the crack growth path, and classified in six grades with colors. The micro-Vickers hardness tests were conducted under the conditions of loading force and loading time, 98 mN and 5 s, respectively.
The normalized micro-Vickers hardness for W-added 9% Cr steel tested under creep, fatigue (tH=0 s), and creep-fatigue interactive (tH=9940 s) conditions at 600°C are shown in Figs. 1214, respectively. The normalized micro-Vickers hardness for W-added 12% Cr steel tested under creep, fatigue (tH=0 s), and creep-fatigue interactive (tH=600 s) conditions at 650°C are shown in Figs. 1517, respectively.
From Fig. 12, for W-added 9%Cr steel tested under creep condition, the micro-Vickers hardness was degraded to the depth of 3.4 mm to the d direction, and the maximum degradation rate of hardness reaches 30%. From Fig. 13, for W-added 9% Cr steel tested under fatigue condition (tH=0 s), the micro-Vickers hardness was degraded to the depth of 1.2 mm to the d direction, and the degradation rate of hardness was limited to 1020%. From Fig. 14, for W-added 9% Cr steel tested under creep-fatigue interactive condition (tH=9940 s), the micro-Vickers hardness was degraded to the depth of 4.0 mm to the d direction, and the maximum degradation rate of hardness was 40%.
From these results, the damage region and degree estimated from the degradation of hardness were most severe under creep-fatigue interactive condition.
[image:5.595.309.547.400.570.2]From Fig. 15, for W-added 12% Cr steel tested under creep condition, the micro-Vickers hardness was degraded to
[image:5.595.93.245.485.578.2]Fig. 11 Measurement and observational sites for tested specimen.
Fig. 12 Measurement result of Vickers hardness for W-added 9%Cr steel under creep condition.
[image:5.595.151.449.619.771.2]the depth of 2.6 mm to the d direction, and the maximum degradation rate of hardness reaches 40%. From Fig. 16, for W-added 12% Cr steel tested under fatigue condition (tH=0 s), the micro-Vickers hardness was degraded only to the depth of 1.8 mm to the d direction, and the maximum degradation rate of hardness was limited to 20%. From Fig. 17, for W-added 12%Cr steel tested under creep-fatigue interactive condition (tH=600 s), the micro-Vickers hardness was degraded up to the depth of 3.0 mm to the d direction, and the maximum degradation rate of hardness reaches 40%. From these results, for W-added 12%Cr steel, it was shown that creep-fatigue damage formation behavior was similar to that under creep condition, different from the results for W-added 9% Cr steel.
From the results mentioned above, for W-added 9% Cr steel, the area and degree of damage under creep-fatigue interactive condition were notably larger and higher as compared with those of under the creep and fatigue conditions. Therefore, the reason why the unstable transition region in the characteristics of load frequency of crack growth life occurs under the creep-fatigue interactive condition may be due to the difference of damage formation behaviors as is mentioned above.
[image:6.595.305.547.68.240.2]On the other hand, for W-added 12%Cr steel, the damage region under creep-fatigue interactive condition was similar to that of under creep condition. Therefore, it seems that the characteristics of load frequency of crack growth life tf did not show unstable transition region and it was dominated by time-dependent mechanism.
Fig. 15 Measurement result of Vickers hardness for W-added 12%Cr steel under creep condition.
[image:6.595.60.388.68.242.2]Fig. 14 Measurement result of Vickers hardness for W-added 9%Cr steel under creep-fatigue condition. (tH=9940 s)
[image:6.595.148.450.294.467.2]Fig. 16 Measurement result of Vickers hardness for W-added 12%Cr steel under fatigue condition.
[image:6.595.306.547.514.670.2]In the next section, to clarify the contributing factor of damage formation, microstructural observation by using EBSD was conducted.
4.4 Microstructural observation of damage region using EBSD method
The EBSD observation was conducted on a HITACHI S-4300 FE-SEM. The OIM from TSL Inc. was used for fully-automated EBSD analysis to observe the microstructure such as the grain orientation distribution. Samples were polished to a mirror surface with 0.05 µm colloidal silica solution to remove the worked layer before EBSD observation. The
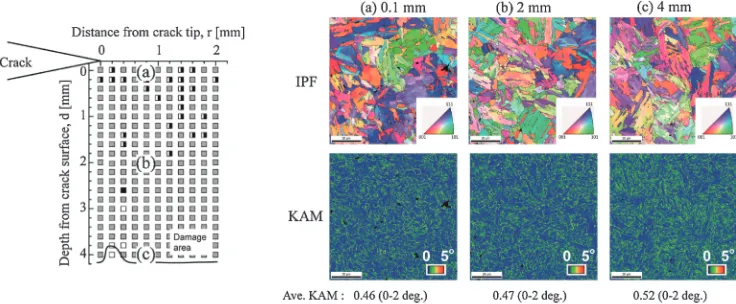
[image:7.595.148.518.72.225.2]observational points were in the position which corresponds to t/tf=0.5 in the r direction shown in the Figs. 6 and 8. At this position in the r direction, the measurement points were determined directly below the crack surface (0.1 mm), at 2 mm, and at 4 mm in the d direction. The EBSD observation was conducted with 0.2 µm step size in the 87 µm square area for each measurement point. The inverse polefigure (IPF) maps and the kernel average misorientation (KAM) maps are shown in Figs. 1823. The KAM value represents the difference of crystal orientation which is calculated by the average misorientation between a point and its neighbors.
[image:7.595.77.517.263.416.2]Fig. 18 Inverse polefigure and Kernel average misorientation maps of W-added 9%Cr under creep condition.
Fig. 19 Inverse polefigure and Kernel average misorientation maps of W-added 9%Cr steel under fatigue condition.
[image:7.595.146.514.454.606.2]As shown in Figs. 1820, for W-added 9% Cr steel, the distribution of KAM value in the damage region which is revealed from micro-Vickers hardness is different from that in the other region (undamaged region). Additionally, the average KAM value for an EBSD observational area is lowest in the damage region.
From the IPF and KAM maps shown in Figs. 2123, for W-added 12%Cr steel, the similar results were obtained with W-added 9% Cr steel. To clarify the difference of KAM value in damage region and undamaged region, the frequency distributions of the KAM value for the EBSD observational areas in Figs. 1823 are shown in Figs. 24 and 25.
[image:8.595.150.521.70.222.2]Figures 24(a), 24(b) and 24(c) show the frequency distribu-tions of the KAM value for W-added 9% Cr steel at the depths of 0.1, 2.0 and 4.0 mm from crack surface. In a similar way, the frequency distributions of the KAM value for W-added 12%Cr steel are shown in Figs. 25(a), 25(b) and 25(c). For W-added 9% Cr steel, the distribution of KAM value at the depth of 0.1 mm from the crack surface was not different under various testing conditions as shown in Fig. 24(a). From these results, the damage region is formed under any testing conditions at the depth of 0.1 mm from the crack surface. On the other hand, from Fig. 24(b), at the depth of 2.0 mm from the crack surface, the distribution
[image:8.595.99.515.265.414.2]Fig. 21 Inverse polefigure and Kernel average misorientation maps of W-added 12%Cr under creep condition.
[image:8.595.129.523.454.604.2]Fig. 22 Inverse polefigure and Kernel average misorientation maps of W-added 12%Cr steel under fatigue condition.
of the KAM values under fatigue condition was different from those of under creep and creep-fatigue interactive (tH=9940 s) conditions. Furthermore, the peak of KAM value moved to the higher side of the misorientation angle under fatigue condition and lower side of the misorientation angle under creep and creep-fatigue interactive conditions. From these results, the damage formation was not occurred at this depth under fatigue condition; therefore, the peak of KAM value moved to the higher side of the misorientation angle due to the remaining high dislocation density of martensite lath structure.3,16)On the other hand, under creep and creep-fatigue conditions, the peak of KAM value moved to the lower side of the misorientation angle due to the recovery of martensite lath structure.3,16)
Additionally, from Fig. 24(c), at the depth of 4.0 mm from the crack surface, the peak of KAM value under creep condition moved to the higher side of the misorientation angle corresponding to the undamaged region.
As shown in Figs. 25(a), (b) and (c), for W-added 12%Cr steel, the distribution of the KAM values was almost similar characteristics under any condition at each depth. The difference of the distribution of damage region under creep, fatigue, and creep-fatigue interactive conditions for W-added 12% Cr steel, which is estimated by the micro-Vickers hardness, does not affect the difference in KAM value. Therefore, this is the reason why the characteristic of crack growth life for W-added 12% Cr steel does not show the effect of creep-fatigue interaction.
5. Conclusions
For W-added 9%Cr steel, it is clarified that high damage region is formed widely under creep-fatigue interactive condition due to the interactive effect of creep which damage formation is widely occurred and fatigue which damage formation is high localized along the crack growth path. The (a)
(b)
[image:9.595.60.277.69.516.2](c)
Fig. 24 Number fraction of KAM in damage region of W-added 9%Cr steel; (a) 0.1 mm, (b) 2.0 mm, (c) 4.0 mm.
(a)
(b)
[image:9.595.315.534.70.516.2](c)
frequency range which causes the interactive effect of creep and fatigue damage is correlated to the frequency range of unstable transition region of the characteristic of crack growth life. For W-added 12% Cr steel, the characteristic of crack growth life was found to be mainly dominated by time dependent mechanism even under creep and fatigue condition.
REFERENCES
1) J. Pešička, R. Kužel, A. Dronhofer and G. Eggeler:Acta Mater.51 (2003) 48474862.
2) M. Kamaya, A. J. Wilkinson and J. M. Titchmarsh: INSS J.11(2004) 161172.
3) K. Kimura, K. Fujiyama, R. Ishii and K. Saito:Trans. Japan Soc. Mech. Eng. Ser. A66(2000) 158164.
4) K. Sawada, K. Maruyama, R. Komine and Y. Nagae: Tetsu-to-Hagane
83(1997) 5459.
5) T. Ohtani, F. Yin and Y. Kamada:J. Soc. Mater. Sci. Japan58(2009)
136142.
6) R. Sugiura, A. T. Yokobori, Jr., S. Takamori, M. Tabuchi, A. Fuji, M. Yoda, K. Kobayashi and T. Yokobori:Mater. Trans.48(2007) 2928 2936.
7) A. T. Yokobori, Jr., K. Akaishi, R. Sugiura and D. Kobayashi: Strength, Fracture and Complexity An Int. J.2(2004) 3545.
8) T. Fujita: The Thermal and Nuclear Power42(1991) 14851495. 9) ASTM E1457-07, Standard test method of measurement of creep crack
growth rates in metals, Annual Book of ASTM Standards, (2007). 10) ASTM E2760-10, Standard test method for creep-fatigue crack growth
testing.
11) T. Yokobori, T. Iwadate, S. Konosu, M. Tabuchi, A. Fuji and A. T. Yokobori, Jr.:Strength of Materials and Fractology,129, (Committee of JSPS, Sasaki Press Japan, 1999) p. 291.
12) H. H. Johnson: Mater. Res. Stand.5(1965) 442445.
13) K. H. Schwalbe and D. Hellman:J. Test. Eval.9(1981) 218220.
14) A. T. Yokobori, Jr., R. Sugiura, D. Yoshino, M. Tabuchi and Y. Hasegawa: Proc. ASME PVP07 CREEP8, (2007) CD-ROM. 15) A. T. Yokobori, Jr., R. Sugiura, S. Kimoto, D. Yoshino and T.