Wettability Model Considering Three-Phase Interfacial Energetics
in Particle Method
Shungo Natsui
+, Rikio Soda, Tatsuya Kon, Shigeru Ueda,
Junya Kano, Ryo Inoue and Tatsuro Ariyama
Institute of Multidisciplinary Research for Advanced Materials (IMRAM), Tohoku University, Sendai 980-8577, Japan
Wettability of a solid by a liquid plays a key role in achieving the purpose of the process in moving bed-type reactors. In recent years, particle method has been proposed for the design of processes which include multiphaseflows. Using this method, it is possible to analyze a free surfaceflow without explicitly tracking the interface. Although surface tension and wettability models using the particle method have already been proposed, the complexity of calculations of normal line and curvature of the surface particle has been pointed out as a problem. In this study, surface tension and wettability model were introduced in terms of interparticle potential, and theoretical and experimental verifications were performed for a 3-dimensional particle method which stabilizes the internal pressure distribution influids. The analytical solution for the droplet oscillation period by this method showed good agreement with the theoretical solution, and the surface tension between a gas and liquid could be calculated correctly. Because the difference in the number density of a liquid phase and solid phase becomes remarkable in a 3-dimensional space, a technique which corrects for this in particles at a three-phase interface was introduced. Time change in the droplet shape was compared with the experimental results by changing the droplet impact velocity to obtain agreement of the Weber number. It is considered possible to express the droplet shape correctly during rotating falling on a solid surface. [doi:10.2320/matertrans.M2011330]
(Received October 25, 2011; Accepted January 19, 2012; Published March 7, 2012)
Keywords: droplet, numerical analysis, wettability, moving particle semi-implicit (MPS) method, contact angle
1. Introduction
In materials processing, the behavior of droplets in solid particle groups in moving bed-type reactors becomes an issue in some cases. For example, in wet granulation processes, localization of droplets to which solid particles have adhered and bonding/rupture of particles due to formation of a liquid bridge between particles have an important influence on particle properties.1)In the ironmaking blast furnace, control
of the solidliquid coexisting zone, where the sintered ore raw material melts in a packed bed, has a large influence on furnace permeability, and an understanding of its behavior is therefore important.2,3) Solidliquid wettability in such high temperature processes is determined by the interfacial energy balance between the solid, gas, and liquid phases. As measurement of gasliquid surface tension in high temper-ature fields is important for clarifying the relationship between the physical properties of the melt and wettability phenomena, measurements of surface tension in high temperature fields have been made widely, and much knowledge has been obtained by performing simulations of the distribution of liquid phases dripping in packed beds based on the physical property values obtained thereby.4,5)
However, there have been few examples of analysis of wetting phenomena accompanying dispersion/bonding of droplets in packed bed processes from the viewpoint of hydrodynamics.
In recent years, new analytical methods have been proposed for the design of processes which include multi-phase flows. The Volume of Fluid (VOF) method is a powerful tool which is widely used in dynamic simulations of droplet motion, and analyses have been performed by comparison with experiments.68)Mousaviet al. carried out
a Direct Numerical Simulation (DNS), which considered three-phase interaction forces in a particle layer using a mesh of smaller scale than the particles.9)Analyses based on VOF
and DNS involve few empirical formulae for physical phenomena, making it possible to investigate the phenomena in principle. However, the spatial scale is different from that in actual industrial processes because the object region of the calculations is spatially limited. Algorithms which enable coarse-scaling of the calculation space to a degree where the essential characteristics are not lost and analysis of theflow
field at the maximum spatial scale given in the current computer environment are useful from the engineering point of view. The MPS (Moving Particle Semi-implicit) method is a particle method which was developed for analysis of incompressible free surfaceflows.10)With the MPS method, only liquid phase motion, including the free surface as a dispersed phase, can be described with comparative ease without considering other phenomena. For this reason, application to process design, etc. based on a non-empirical understanding of phenomena is expected.
Surface tension and wettability models using the particle method have already been proposed.11,12)Many of these are
based on the CSF (Continuum Surface Force) model proposed by Brackbill et al.13) The CSF model formulates
surface tension by assuming that afluid is a continuum, and has been widely used in techniques such as the VOF method, among others. Although the CSF model was also applied to the MPS method by Nomura et al.,14) the complexity of calculations of normal line and curvature of the surface particle has been pointed out as a problem. Furthermore, it is not possible to calculate particle curvature, which describes a dispersedfluid, because the number of surrounding particles is insufficient. From the viewpoint of calculation cost, a model which does not depend on surface curvature had become necessary. Recently, a surface tension/wettability +Corresponding author, E-mail: b0td5004@s.tohoku.ac.jp
model using the interparticle potential in the MPS method was proposed to address this need. As one advantage of this method, complex calculations are not necessary because the model gives the surface tension between particles using the same algorithm as in the molecular dynamics (MD) method.15,16) However, although the relationship between interparticle force and interfacial energy has been shown theoretically by Kondo et al.,17) it is difficult to say that verification of the calculation results and theory has been performed adequately. Particularly in the particle method, the difference in the number density of the liquid phase and solid phase becomes remarkable in 3-dimensional spaces due to the problem of spherical particle distribution, and in many cases, this approach is limited to knowledge of 2-dimensional spaces.
If surface tension can be modeled by an interparticle potential model, this technique can easily be applied to a wide range of fields of large-scale systems. In addition to materials processes, these include chemical plants, ceramic
filters, and nuclear power plants. Therefore, the aims of the present research are to develop this approach to a model which considers three-phase interfacial energetics, and to verify the computational accuracy of the model based on a comparison of the analytic/theoretical results for 3-dimensional space with experimental results.
2. Numerical Method
2.1 Moving particle semi-implicit (MPS) method
In the MPS method, afluid is expressed by afinite number of individual particles, and the behavior of a continuum is tracked by the motion of those particles.10) The governing
equations are an equation of continuity for an isothermal incompressible flow which is described by Lagrangian coordinates and the NavierStokes equation.
Dμ
Dt ¼ μr v ð1Þ
Dv
Dt¼
1
μrPþ¯r2vþgþ
1
μFs ð2Þ
where,v,t,μ,P,¯,g,Fsare a velocity vector, time, density,
pressure, a kinematic coefficient of viscosity, acceleration of gravity, and surface force, respectively. The differential operator is evaluated by the weighted average from information on surrounding particles. Weight is assigned to the strength of interaction using a weight function, which is defined as follows.
wij¼ re rij
1 (rijre)
0 (rij> re)
8 <
: ð3Þ
where,re,rijare the influence radius of the weight function and distance between particles, respectively. In this research,
re=2.1l0was assumed,18)where l0 is the particle diameter. For normalization, the sum of the weight functions of neighboring particles is defined as the particle number density.
ni¼
X
j
wij ð4Þ
In incompressible flows, a standard particle number density
n0 in the initial condition is obtained assuming a uniform
particle number density, and this is considered to represent the incompressible state. In the MPS method, discretization is performed as follows for the gradient, divergence, and Laplacian of an abitrary scalar quantityºand vector quantity uusing respective differential operator models.
hrºii¼ d
n0
X
j6¼i
ºjºi r2ij xijwij
" #
ð5Þ
hr uii¼ d n0
X
j6¼i
ðujuiÞ xij
r2ij wij
" #
ð6Þ
hr2ºi
i¼
2d n0
X
j6¼i
½ðºjºiÞwij ð7Þ
where,d,xare dimensionality and a particle coordinate.is a coefficient for obtaining agreement between the divergence of the variable distribution and the analytical solution.
¼X
j6¼i
ðwijr2ijÞ
, X
j6¼i
wij ð8Þ
An explicit solution to the particle motion equation is obtained from the governing equations by substituting the differential operators in the governing equations into the discrete model shown above. Because pressure remains as an unknown quantity, here, pressure is solved implicitly by introducing the Poisson equation so as to satisfy an incompressible condition. To maintain a smooth pressure distribution, in this research, a method which considers weak compressibility in the Poisson equation was adopted, and the following equation for the pressure gradient term was used for conservation of momentum.18)
2d n0
X
j6¼i
½ðPjcPiÞwij ¼μi t½r v
þ£ μi
t2
n0nki n0 ð9Þ
hrPii¼ d n0
X
j6¼i
PjþPi r2ij xijwij
" #
ð10Þ
where, c, £, v*, nkl are the expansion ratio of the diagonal component, a relaxation coefficient representing volume conservation, hypothetical particle velocity, and particle number density in the next time step, respectively. In this research, c=1.01 and £=0.01 were assumed.18) For
pressure calculation, the surface particle pressure is assumed to be 0 as the boundary condition. In conventional judgment by particle number density, particles in the flow interior are sometimes mistakenly judged to be surface particles. Therefore, in this research, judgment of surface particles is made using the neighboring particle numberNi.
Ni<¢N0 ð11Þ
where, N0, ¢ are the standard neighboring particle number in an incompressible state and a coefficient for surface judgment. Physically, ¢ corresponds to the thickness of the interface. In the present research,¢=0.85 was assumed from the viewpoints of calculation stability and accuracy.18)As a
2.2 Surface tension calculation model
Surface tension can be given as the work necessary to form an interface between dissimilar phases per unit of area. An examination of droplet behavior must consider a gasliquid interface and a solidliquid interface. In MPS method calculations for twofluids which include a gas, the pressure differential becomes large, and as a result, the pressure term in eq. (2) becomes excessive, making convergent calculation difficult. Therefore, in this research, the liquid phase is considered to comprise MPS particles, and a gas phase is assumed to exist in spaces where particles do not exist. In the model of surface tension betweenfluids at a free surface, the interparticle potential method proposed by Kondo et al.17)
was used as the basic model. Interparticle potential is defined as follows, and interparticle potential force is given by the space derivative of interparticle potentialºðrÞ.
Fs¼CX
j6¼i @º @r
rij
jrijj
ð12Þ
ºðrijÞ ¼13 rij32l0þ12rest
ðrijrestÞ2 ð13Þ
where, C is the interparticle potential coefficient. In the surface tension/wettability model, rest=3.1l0 was used for calculation stability.17) Assuming that the interparticle distance does not change significantly due to surface formation, and considering the formation of twoSL surfaces by separation of region A particles from region B particles, the liquidliquid potential coefficientCLLwas obtained from
the surface formation energy.
CLL¼2·12SL
, X
j6¼i
ºðrijÞ ð14Þ
·12is the interfacial energy between a gas and a liquid. Here, the interfacial area is given asSL=l02.F
Sis the same form as
the intermolecular interaction force used in the MD method. Accordingly, the surface tension for each particle can be cal-culated without considering the curvature of the free surface.
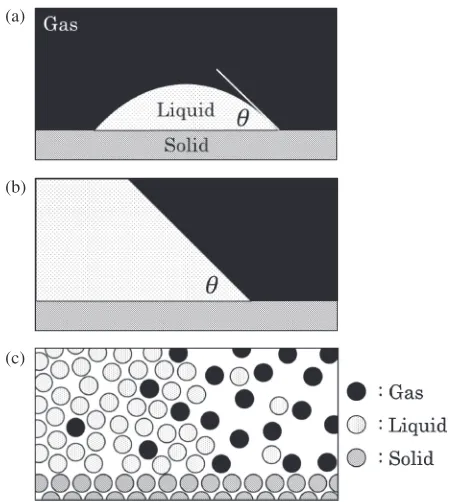
[image:3.595.314.539.68.319.2]2.3 Wettability calculation model
Figure 1 is a schematic illustration showing, at different scales, the shape of a three-phase interface where a liquid phase is in contact with the surface of a solid phase.19)As
shown in Figs. 1(a) and 1(b), wettability is expressed quantitatively by the contact angleª. In the present research, the macroscopic solidliquid interparticle force takes the same form as intermolecular interaction force, and its magnitude is given depending on the contact angleª. Here, the contact angleªis a macroscopic thermodynamic quantity and does not depend on the nature of the intermolecular force. Accordingly, at the molecular level shown in Fig. 1(c), the macroscopic contact angle ª gives no molecular-level information on the shape of the surface. In the particle method, the contact angleªcan be given as a ratio of forces balanced in the vertical and horizontal directions at a three-phase interface. As shown in Fig. 2(a), Kondoet al.adopted a method which gives the interparticle potential force as the relationship of the gasliquid interfacial free energy·12and contact angleªby way of Young’s equation.17)
·13·23¼·12cosª ð15Þ
where,·23and·13are the interfacial free energy between the solid and gas phases and the solid and liquid phases, respectively. A similar potential is also introduced between solid particles and liquid particles to express wettability. The necessary energy for separation of the solidliquid interface is given as follows, assuming equivalency of the interfacial areasS of the two phases.
CSL CLL¼
ð·12þ·23·13ÞS
2·12S ð16Þ When eq. (15) is substituted into eq. (16), the solidliquid potential coefficientCSLis obtained.
(a)
(b)
(c)
Fig. 1 Schematic diagrams of shape at gasliquid interface in contact with a solid surface. The macroscopic contact angle gives no information on the location of individual molecules. (a) Macroscopic scale (b) Up-close view of 3 interfaces (c) Molecular scale.
(a)
(b)
[image:3.595.344.504.386.580.2]CSL¼12ð1þcosªÞ CLL ð17Þ
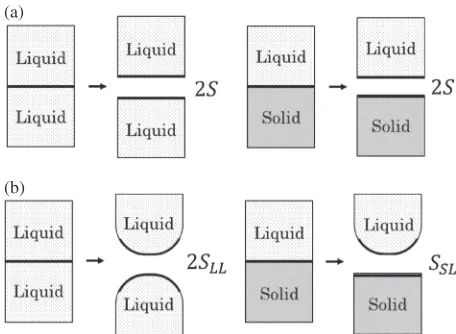
In eq. (16), the solidliquid potentialCSL is given uniquely by the potential CLL and contact angle ª of liquidliquid phases by expressing the difference between ·23 and ·13, which are parameters that cannot be given experimentally, by the surface tension of the liquid ·12 and the wetting angle cosª. However, this model does not reflect the horizontal forces between solid and liquid particles. Therefore, the contact angle is a parameter which simply expresses the ratio of the vertical force component to the surface tension of the liquid. Therefore, in this research, the authors introduced a concept of potential force which differentiates the interpar-ticle force of the solidliquid interface and that of the solid gas interface, as shown in Fig. 2(b).
The difference in the number densities of the liquid phase and solid phase becomes particularly remarkable in 3-dimensional spaces. On the other hand, Kondoet al.posited the assumption of equivalence of the interfacial areas S.17) The interfacial area in interface separation is assumed to be constant. However, this assumption cannot be applied to gas liquid interfaces, where the interfacial shape changes, and also cannot adequately express the phenomena, in that it is not possible to consider the changes in the internal stress of the interface, including the solid phase. The concept of interface formation by separation of dissimilar phases is shown in Fig. 3. The decrease in the droplet interfacial area during interfacial separation cannot be ignored, and it is necessary to compensate for this when considering a three-phase interface. Assuming the values of the liquidliquid contact interfacial area SLL and the solidliquid contact interfacial areaSSLare not identical, the following equation is materialized by particle arrangement.
CSL CLL ¼
ð·12þ·23·13ÞSSL
2·12SLL ð18Þ Here, it is necessary to eliminate the disagreement between the particle number densities of the liquid phase and solid phase, in which liquid phase particles are affected by force in
a three-phase system. If the following conditions are satisfied,
SSLcan be obtained numerically.
(1) In an interface of a certain thickness, the contact surface area ratio is equivalent to the particle number ratio. (2) The condition of incompressibility is strictly
material-ized, and the particle number densities of the liquid phase and solid phase at the solidliquid interface are constant.
SSL¼2SLL
X
j6¼i wLLij
, X
j6¼i wSLij
" #
ð19Þ
w¼ij¼ 1 (rijre) 0 (rij> re)
ð20Þ
where, w¼ij and ¼ are a weight function for judgment of a solidliquid interface and a symbol for expressing solid liquid or liquidliquid, respectively. Based on the above, the solidliquid potential coefficient for a three-phase system is corrected as follows.
CSL¼12ð1þcosªÞ CLL 2
X
j6¼i wLLij
, X
j6¼i wSLij
" #
ð21Þ
2.4 Calculation algorithm
The programs used in this research are all original programs which were developed by the authors. The respective computer codes were written in Fortran90/95, and these were compiled by Intel Fortran compiler Version 11.1 on UNIX and then run. To reduce calculation time, parallel processing of the program code was performed by OpenMP. The CPU used in this work was Intel Xeon X5680 (3.33 GHz, 6 cores)©2.
3. Results and Discussions
As physical verification of the model, the simulation results were compared with the theoretical or experimental results by the following procedure. Figure 4 shows a schematic illustration of the initial arrangement in the droplet motion simulation. First, droplet motion in a gas phase was compared with the theoretical oscillation period of a fluid with no viscosity.20) Next, for wettability with the solid
phase, the contact angle was compared with the result of an experiment in which a droplet was dropped on a horizontal solid surface.21,22)Finally, for dynamic droplet behavior, the
contact angle was compared with the result of an experiment in which a droplet was dropped on a solid surface inclined at an angle of 60°.23,24)
3.1 Droplet oscillation
Theoretical solutions exist for the oscillation mode and frequency under zero gravity.25,26)In a 3-dimensional system,
½2¼sðs1Þðsþ2Þ ·12
μR3 ð22Þ
where, ½, s, and R are frequency, oscillation mode, and equilibrium droplet radius. Accordingly, the oscillation periodTis given as follows:
T ¼2½³ ð23Þ
(a)
(b)
[image:4.595.54.282.70.237.2]The simple and typical form which shows three-dimension has an oval sphere and a cube. In case s=2, the vibration mode is axisymmetric oscillation of a droplet with an elliptical cross section, and the equation expresses a period in which the long and short axes are interchanged.
T ¼2³
ffiffiffiffiffiffiffiffiffiffi
μR3 8·12
s
ð24Þ
Whens=4, this is an oscillation mode in which the droplet cross section is square.
T ¼2³
ffiffiffiffiffiffiffiffiffiffiffiffi
μR3 72·12
s
ð25Þ
In analysis of droplet oscillation by the MPS method, it is necessary to clarify the dependency between droplet oscillation and spatial resolution, as the handling of the surface thickness for spatial discretization using particles and similar factors are considered to influence local motion. Therefore, droplet motion was analyzed for various cases with different particle numbers. The calculation conditions are shown in Table 1. As shown in Fig. 4(a), the initial arrangement of the droplet was cubic with a side length of
L=0.080 [m]. The liquid phase was water. For verification with the theoretical solution for the oscillation period, conditions of zero gravity, nonviscosity, and homogeneous melt were assumed.
The time change in droplet shape calculated with 64000 particles is shown in Fig. 5. The droplet shape changed from cubic to spherical as a result of oscillation and attenuation due to surface tension. Attenuation of the amplitude of oscillation occurred in spite of the fact that this is an inviscid
fluid. This is attributed to the inherent viscosity in particles.16)
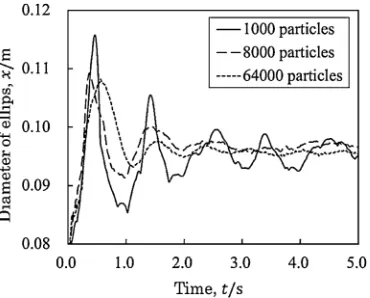
In comparison with the conventional MPS method, local changes are slight and the oscillation period is stable because pressure oscillation is suppressed. Figure 6 shows the change in the width of the droplet in thex-axis direction. Oscillation
intensity showed smaller values as the number of particles was increased, that is, as the analysis was performed at higher resolutions. In a case with 8000 particles, a space error is large, and the error of an oscillating frequency becomes large. It is considered that thefirst period oscillation was thes=4 mode, and this changed to thes=2 mode after attenuation. The mode will become continuous if the number of particles increases. The oscillation period is stable. If the effect of compression is not a factor, considering that 4/3³R3=L3,
using R=0.0496 [m], whens=2, T=2.878 [s], and when
s=4, T=0.959 [s]. Although the calculation results vary depending on resolution, the first oscillation period is approximatelyT=1.0 [s], which agrees with the theoretical period as shown in eq. (25). Figure 7 shows the first oscillation period (time between short sides) for various surface tension coefficients, together with the theoretical oscillation period. As the calculated results show good agreement with the theoretical solution, it can be understood that the absolute value of the surface tension between the gas and liquid phases was estimated accurately using this model.
3.2 Droplet motion on solid surface
The solidliquid contact angle obtained in the droplet contact experiment using a solid surface was compared with the results of a simulation at the same scale. Here, as shown in Fig. 4(d), the part containing the liquid at the angle formed between the solid surface and a tangential line drawn on the surface of the liquid at the point of intersection between the droplet and a horizontal solid surface under gravity was considered to be the contact angleª. As shown in Fig. 4(b), a spherical droplet was made to impact on a horizontal solid surface. To consider the dynamic behavior of the droplet, the impact speed Uwas changed so as to obtain agreement of the Weber number We.
We¼μDU· 2
12 ð26Þ
[image:5.595.48.290.67.286.2]Figure 8(a) shows a schematic diagram of the experimental apparatus. The droplet is dropped from a syringe, comes into contact with the solid surface, and after attenuation of oscillation, reaches a state of equilibrium. In this experiment,
Table 1 Calculation conditions for droplet oscillation.
Gas Air (293 K)
Liquid Water (293 K)
Densityμ, kg/m3 1.00©103
Kinetic viscosity¯, m2/s 0.0
Surface tension coefficient·L, N/m 7.28©10¹2
Droplet diameterL, m 8.0©10¹2
Gravity accelerationg, m/s2 0.0
Time step¦t, s 1.0©10¹4
Case study
Number of particle 103 203 403
Diameter of particlel0, m 8.0©10¹3 4.0©10¹3 2.0©10¹3
Time step¦t, s 1.0©10¹4
(a) (b)
(c) (d)
[image:5.595.304.549.83.254.2]the droplet was placed into contact with the solid surface gently so as to obtain We=0.87. The static droplet shape was recorded with a camera. Water was used as liquid. Two types of solids were used, one being a Teflon laminate, and the other, a glass plate which had been degreased with methyl ethyl ketone. Figure 8(b) shows the droplet immediately before dropping. The droplet diameter and volume are 2.0©10¹3[m] and V=4.19©10¹9[m3], respectively.
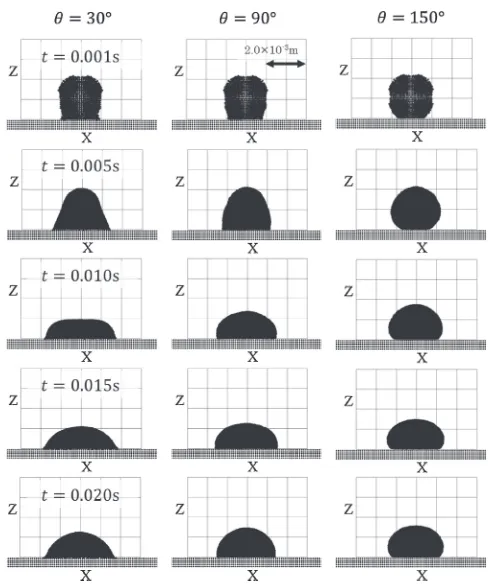
Based on this, the calculation conditions were set as shown in Table 2, and acceleration of gravity was g=9.8 [m/s2]. Calculations were made changing the contact angle ª. Figure 9 shows snapshots of the droplet shape at contact angles of ª=30, 90, and 150°. From impact until time
t=0.015 [s] after dropping, the droplet gradually spread in the horizontal direction, and its shape changed from spherical to oblate. After t=0.020 [s], the shape remained substan-Fig. 6 Oscillation of cubic droplets deformed into an ellipse calculated
with different particle numbers. Time change of diameter of the ellipse in the x direction.
Fig. 5 Snapshots of calculated oscillation of droplet with cubic initial shape (64000 particles).
[image:6.595.135.463.69.433.2] [image:6.595.78.263.477.626.2] [image:6.595.332.518.478.645.2]tially unchanged and the droplet achieved a stable state. In the case of ª=30°, the droplet assumed a dome-like shape as the liquid film at the solidliquid interface contracted, whereas, in the case of ª=150°, it demonstrated behavior resembling elastic deformation.
Figure 10 shows the results of an experiment and simulation of the static droplet shape. The simulation results were compared att=0.100 [s], when the droplet had become sufficiently static. As shown in Fig. 10(b), the apparent contact angle obtained with the conventional model which was calculated by eq. (17) is larger than the given contact angle. However, as shown in Fig. 10(c), the contact angle can be expressed satisfactorily with the proposed model when
ª=90°. Whenª=30°, the wetting angle could be estimated correctly in comparison with that in Fig. 10(b). In compar-ison with the experimental value shown in Fig. 10(a), the contact angle is somewhat excessive, and minute wetting in the vicinity of the wall surface cannot be reproduced. This is attributed to the face that the MPS method cannot express events of smaller scale than the particle diameter, and thus cannot express thin liquid films. For high spatial resolution analysis of the phenomenon of wetting of a solid wall, further reduction of the surface particle thickness is necessary. However, when the object of interest is a large-scale industrial process, it can be thought that this model enables qualitative consideration of droplet behavior, even in cases where the number of calculation points forming the droplet is small. There is a possibility that Kondoet al.overestimated
CLL, and as a result,17)gave a poor evaluation of wettability,
because the interfacial area of the liquid phase is compara-tively large. Equation (21) rationalized balance of horizontal
forces in consideration of the potential balance between liquid, solid and gas phases.
In order to compare the dynamic droplet shape with the experimental results, the droplet impact velocity U was changed so as to obtain agreement between the experimental conditions22,23) and the contact angle and Weber number.
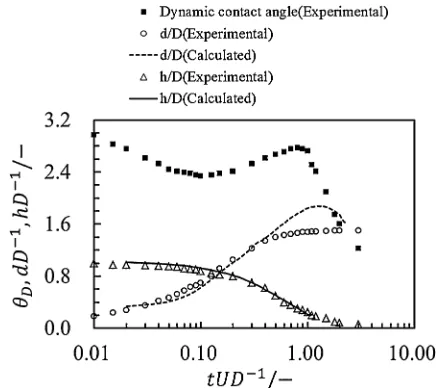
In this research, the comparison was made for We=51. Figures 11 and 12 show the dynamic contact angle ªD, as
(a) (b)
[image:7.595.48.291.65.173.2]Fig. 8 Schematic diagram of experimental apparatus for measurement of contact angle and initial droplet shape. (a) Schematic diagram (b) Initial shape of a droplet.
Table 2 Calculation and experimental conditions for liquid wettability.
Gas Air (293 K)
Solid Teflon laminate (293 K)
Liquid Water (293 K)
Densityμ, kg/m3 1.00©103
Kinetic viscosity¯, m2/s 1.36©10¹6
Surface tension coefficient·L, N/m 7.28©10¹2
Droplet diameterL, m 2.0©10¹3
Gravity accelerationg, m/s2 9.8
Number offluid particle 203
Diameter of particlel0, m 1.0©10¹4
Time step¦t, s 1.0©10¹5
[image:7.595.304.548.66.358.2]Fig. 9 Time changes in calculated droplet shapes at different contact angles depending on potential ratio between solid and liquid particles (We=0.87).
[image:7.595.47.291.245.388.2] [image:7.595.312.541.419.635.2]defined in Fig. 4(d), the ratio d/D of the wetting diameter (spread diameter) of the droplet relative to its initial diameter, and the ratio h/D of droplet height relative to its initial diameter, for the casesªD=17 and 90°, respectively. In both cases, the experimental results and calculated results showed very similar tendencies. On the other hand, differences occurred at the maximum wetting length (i.e., maximum value of d/D). This is considered to be an error which occurred because individual particles were evaluated as a minute wetting thinfilm when the droplet spread on the solid surface. Furthermore, the interparticle potential due to the dynamic contact angle is not considered. Although it appears that the concept of potential which was introduced in this research can correctly express the energy balance at a solid gasliquid three-phase interface, there is room for discussion regarding the quantifiability of interfacial energy for isolated particles and similar cases where the number of calculation points is small.
3.3 Droplet motion on inclined solid surface
[image:8.595.61.282.68.263.2]The behavior of a droplet which was dropped on a solid surface with an inclination of 60° was analyzed. Figure 13 shows the 3-dimensional behavior of a droplet on an inclined solid surface, in which the droplet color represents time. In the case of ª=30°, a liquidfilm extends out behind the droplet, expressing the phenomenon of wetting of the solid surface. This effect becomes greater with increasing size of the particles, which are the minimum unit of fluid volume in the MPS method. Because it becomes impossible to reproduce the minute separation of the trailing liquid film, there is also a strong need to consider a physical model of contact angle hysteresis from this viewpoint. Figure 14 shows a comparison of the droplet shape in the steady state as obtained experimentally and by simulation. The difference in the advancing and receding contact angles could be Fig. 11 Comparison of calculated and experimental results for temporal
evolution of spread diameter of water droplet assuming constant contact angleª=17° (D=2.4 mm, We=51).
Fig. 12 Comparison of calculated and experimental results for temporal evolution of spread diameter of water droplet assuming constant contact angleª=90° (D=2.4 mm, We=51).
(a)
[image:8.595.326.524.71.319.2](b)
Fig. 13 3-dimensional calculated regimes of droplet impact and sliding down inclined surface (We=0.87).
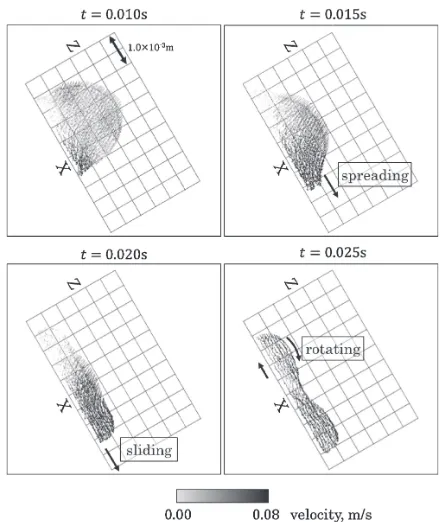
[image:8.595.58.280.321.515.2] [image:8.595.317.537.369.549.2]expressed in the simulation. Both contact angles are slightly overestimated in comparison with the experimental results. Figure 15 shows the time change in the velocity vector distribution in the vertical cross section of a droplet. It can be understood that the droplet spreads along the wall surface after impacting on the solid surface. At this time, its velocity increases in the direction of rotating falling due to the effect of gravity. On the other hand, att=0.025, a caterpillar-like rotating motion is reproduced in the back part of the droplet. This droplet behavior shows good agreement with the analytical results reported by Tanaka et al.27) Thus, it is possible that the rotating mode seen in rotating falling on a water-repellant solid surface has been reproduced correctly.
4. Conclusion
Surface tension and wettability were considered in terms of interparticle potential, and theoretical and experimental verifi -cations were performed for a 3-dimensional particle method which stabilizes the internal pressure distribution in fluids. The analytical solution for the droplet oscillation period by this method showed good agreement with the theoretical solution, and the surface tension between a gas and liquid could be calculated correctly. In comparison with the conven-tional particle method, local changes due to surface tension were slight because pressure oscillation was suppressed.
Because the difference in the number density of a liquid phase and solid phase becomes remarkable in a 3-dimen-sional space, a technique which corrects for this in particles at a three-phase interface was introduced. Droplet motion on a solid surface under gravity was compared experimentally. This research demonstrated that the solidliquid contact angle shows good agreement with the experimental results when compared with the conventional method, and the static contact angle can be calculated correctly using the proposed
method. Time change in the droplet shape was compared with the experimental results by changing the droplet impact velocity to obtain agreement of the Weber number. The reproducibility of minute wetting films improves as the particle diameter decreases.
A simulation of rotating-type falling of a droplet on an inclined solid surface was also performed, and demonstrated that the proposed method is applicable to dynamic droplet motion. It is also considered possible to express the droplet shape correctly during rotating falling on a solid surface. However, for accurate calculation of the rotating velocity, it will be necessary to express the difficulty of droplet rotating falling by considering contact angle hysteresis.
Acknowledgements
Authors gratefully acknowledge the partial financial support from Japan Society for the Promotion of Science (JSPS) for conduction this research work.
REFERENCES
1) S. M. Iveson, N. W. Page and J. D. Litster:Powder Technol.130(2003) 97101.
2) S. Ueda, S. Natsui, H. Nogami, J. Yagi and T. Ariyama:ISIJ Int.50
(2010) 914923.
3) Z. Fan, S. Natsui, S. Ueda, T. Yang, J. Kano, R. Inoue and T. Ariyama:
ISIJ Int.50(2010) 946953.
4) P. R. Austine, H. Nogami and J. Yagi:ISIJ Int.37(1997) 748755.
5) S. Natsui, H. Nogami, S. Ueda, J. Kano, R. Inoue and T. Ariyama:ISIJ Int.51(2011) 4150.
6) Š.Šikalo, H. D. Wilhelm, I. V. Roisman, S. Jakirlićand C. Tropea:
Phys. Fluids17(2005) 062103.
7) S. F. Lunkad, V. V. Buwa and K. D. P. Nigam:Chem. Eng. Sci.62
(2007) 72147224.
8) F. Augier, A. Koudil, A. Royon-Lebeaud, L. Muszynski and Q. Yanouri:Chem. Eng. Sci.65(2010) 255260.
9) S. M. Mousavi, A. Jafari, S. Yaghmaei, M. Vossoughi and P. Sarkomaa:
Miner. Eng.19(2006) 10771083.
10) S. Koshizuka and Y. Oka: Nucl. Sci. Eng.123(1996) 421434. 11) S. Adami, X. Y. Hu and N. A. Adams:J. Comp. Phys.229(2010)
50115021.
12) M. Zhang:J. Comp. Phys.229(2010) 72387259.
13) J. U. Brackbill, D. B. Kothe and C. Zemach:J. Comp. Phys.100(1992) 335354.
14) K. Nomura, S. Koshizuka, Y. Oka and H. Obata:J. Nucl. Sci. Technol.
38(2001) 10571064.
15) M. Matsumoto and S. Nakazawa: Therm. Sci. Eng.15(2007) 5561. 16) A. Tartakovsky and P. Meakin:Phys. Rev. E72(2005) 026301.
17) M. Kondo, S. Koshizuka and M. Takimoto: Trans. JSCES2007(2007) 21.
18) M. Tanaka and T. Masunaga:J. Comp. Phys.229(2010) 42794290.
19) J. N. Israelachivili: Intermolecular and surface forces, 3rd ed., (Academic Press, London, 2010) pp. 415461.
20) Z. Sun, G. Xi and X. Chen:Nucl. Eng. Design239(2009) 612627.
21) J. Liu, S. Koshizuka and Y. Oka:J. Comp. Phys.202(2005) 6593.
22) Š.Šikalo, C. Tropea and E. N. Ganić:Exp. Therm. Fluid Sci.29(2005) 795802.
23) Š.Šikalo, C. Tropea and E. N. Ganić:J. Colloid Interf. Sci.286(2005) 661669.
24) N. Le Grand, A. Daerr and L. Limat:J. Fluid Mech.541(2005) 293 315.
25) L. Reileigh:Proc. R. Soc. Lond.29(1879) p. 71.
26) H. Lamb: Hydrodynamics, 6th ed., (Cambridge Univ. Press, Cambridge, UK, 1932) pp. 471475.
[image:9.595.58.278.67.328.2]27) Y. Tanaka, Y. Washio, M. Yoshino and T. Hirata: JASCOME8(2008) 12-081128.